You are not logged in.
This means you
CAN ONLY VIEW reports that were published prior to Thursday, March 20, 2025.
You
MUST UPGRADE YOUR MEMBERSHIP if you want to see any current reports.
AFTER MARKET UPDATE - MONDAY, JUNE 5TH, 2023
Previous After Market Report Next After Market Report >>>
|
|
|
|
DOW |
-199.90 |
33,562.86 |
-0.59% |
|
Volume |
847,780,478 |
-14% |
|
Volume |
4,365,358,300 |
-2% |
|
NASDAQ |
-11.34 |
13,229.43 |
-0.09% |
|
Advancers |
1,011 |
35% |
|
Advancers |
1,709 |
38% |
|
S&P 500 |
-8.62 |
4,273.75 |
-0.20% |
|
Decliners |
1,863 |
65% |
|
Decliners |
2,754 |
62% |
|
Russell 2000 |
-24.19 |
1,806.72 |
-1.32% |
|
52 Wk Highs |
47 |
|
|
52 Wk Highs |
124 |
|
|
S&P 600 |
-24.01 |
1,157.70 |
-2.03% |
|
52 Wk Lows |
25 |
|
|
52 Wk Lows |
72 |
|
|
 |
Less Leadership Shown as Major Averages Fall
Kenneth J. Gruneisen - Passed the CAN SLIM® Master's Exam
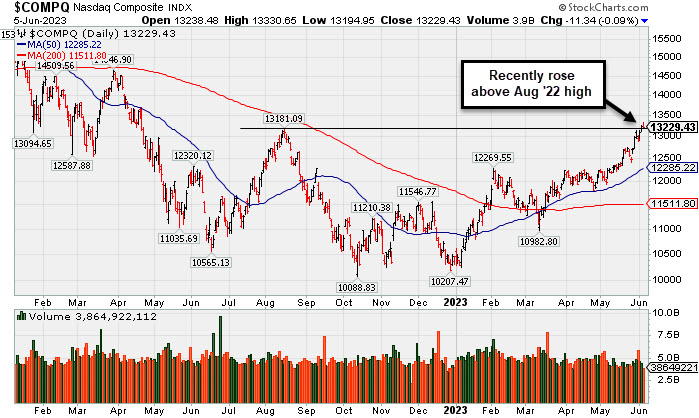
The Dow shed 199 points (-0.6%), while the Nasdaq Composite fell 0.1% and the S&P 500 declined 0.2%. Volume totals reported were lighter on the NYSE and on the Nasdaq exchange versus the prior session. Decliners led advancers by more than a 3-2 margin on the NYSE and on the Nasdaq exchange. There were 32 high-ranked companies from the Leaders List that hit a new 52-week high and were listed on the BreakOuts Page versus 55 on the prior session. New 52-week highs totals outnumbered new 52-week lows totals on the NYSE and on the Nasdaq exchange. The major indices are in a confirmed uptrend (M criteria). Appropriate new buying efforts may be considered under the fact-based investment system.
PICTURED: The Nasdaq Composite Index hit a new 2023 high but ended the session lower. The tech-heavy index recently rose above its August 2022 high.
U.S. equities finished lower on Monday as this morning’s rally in technology and energy stocks reversed in the afternoon amid renewed concerns of an economic slowdown. Seven of 11 sectors finished in negative territory.
On the data front, the Institute for Supply Management (ISM) Services Index for May unexpectedly fell to 50.3, its lowest level of the year, from April’s 51.9 print. The decline, which narrowly avoided falling below 50 and into contraction territory, came as business activity and orders downshifted and prices slid to a three-year low. Final May prints for the S&P Global Services and Composite Purchasing Managers’ Index (PMIs) also declined unexpectedly to 54.9 and 54.3, respectively. Meanwhile, durable goods orders increased 1.1% in April, while factory orders climbed 0.4% and capital goods orders rose 1.3%.
Treasuries were little changed on expectations that the Federal Reserve (Fed) may pause interest rate hikes at its upcoming meeting. The yield on the 10-year note was unchanged at 3.69%, while the 30-year bond yield was up one basis point (0.01%) to 3.89%. Meanwhile, the yield on the two-year note fell three basis points (0.03%) to 4.47%. In commodities, West Texas Intermediate (WTI) crude advanced just 0.1% to $71.83/barrel as investors digested news that Saudi Arabia pledged to cut its oil production by an additional one million barrels a day starting in July, taking its production to the lowest level for several years.
|
 Kenneth J. Gruneisen started out as a licensed stockbroker in August 1987, a couple of months prior to the historic stock market crash that took the Dow Jones Industrial Average down -22.6% in a single day. He has published daily fact-based fundamental and technical analysis on high-ranked stocks online for two decades. Through FACTBASEDINVESTING.COM, Kenneth provides educational articles, news, market commentary, and other information regarding proven investment systems that work in good times and bad.
Comments contained in the body of this report are technical opinions only and are not necessarily those of Gruneisen Growth Corp. The material herein has been obtained from sources believed to be reliable and accurate, however, its accuracy and completeness cannot be guaranteed. Our firm, employees, and customers may effect transactions, including transactions contrary to any recommendation herein, or have positions in the securities mentioned herein or options with respect thereto. Any recommendation contained in this report may not be suitable for all investors and it is not to be deemed an offer or solicitation on our part with respect to the purchase or sale of any securities. |
|
 |
Energy, Financial, and Tech Indexes Pulled Back
Kenneth J. Gruneisen - Passed the CAN SLIM® Master's Exam
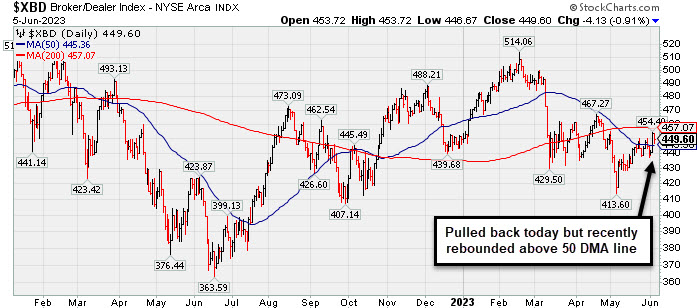
The Bank ($BKX -1.11%) and Broker/Dealer ($XBD -0.88%) indexes both lost ground while the Retail ($RLX +0.27%) eked out a small gain. The Semiconductor ($SOX -1.64%) and Networking ($NWX -2.08%) both lost ground while the Biotech ($BTK +0.34%) eked out a small gain. The Oil Services ($OSX -1.94%) and Integrated Oil Services ($XOI -0.73%) both lost ground while the Gold & Silver ($XAU -0.03%) finished flat.
PICTURED: The Broker/Dealer ($XBD -0.88%) pulled back on Monday but recently rebounded above its 50-day moving average (DMA) line while recovering from its May '23 low.
| Oil Services |
$OSX |
74.56 |
-1.47 |
-1.94% |
-11.09% |
| Integrated Oil |
$XOI |
1,631.22 |
-12.01 |
-0.73% |
-8.73% |
| Semiconductor |
$SOX |
3,444.12 |
-57.29 |
-1.64% |
+36.02% |
| Networking |
$NWX |
794.09 |
-16.86 |
-2.08% |
+1.38% |
| Broker/Dealer |
$XBD |
449.73 |
-3.99 |
-0.88% |
+0.13% |
| Retail |
$RLX |
3,300.42 |
+9.03 |
+0.27% |
+19.84% |
| Gold & Silver |
$XAU |
125.31 |
-0.03 |
-0.03% |
+3.68% |
| Bank |
$BKX |
79.38 |
-0.89 |
-1.11% |
-21.29% |
| Biotech |
$BTK |
5,390.10 |
+18.07 |
+0.34% |
+2.06% |
|
|
|
 |
Palo Alto Powers to New Highs Again
Kenneth J. Gruneisen - Passed the CAN SLIM® Master's Exam
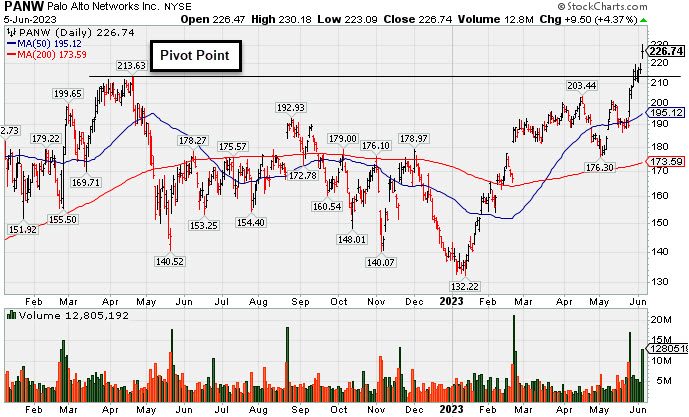
Palo Alto Networks (PANW+$9.55 or +4.40% to $226.79) was highlighted in yellow with new pivot point cited based on its 4/20/22 high plus 10 cents in the earlier mid-day report (read here). It powered to new all-time highs with today's gap up and 8th consecutive volume-driven gain. The gain helped clinch a technical buy signal, however it is quickly getting extended from the lengthy new base. It has an 89 Earnings Per Share Rating. It has shown bullish action after reporting Apr '23 quarterly earnings +83% on +24% sales revenues versus the year-ago period. Prior quarterly comparisons were above the +25% minimum earnings guideline (C criteria). It had a downturn in FY '20 earnings like many companies during the pandemic but has continued posting strong annual earnings (A criteria) since. PANW's share price was impacted by a 3:1 split on 9/14/22 and it now has a supply (S criteria) of 305.9 million shares outstanding. The number of top-rated funds owning its shares rose from 892 in Jun '17 to 2,533 in Mar '23, a very reassuring sign concerning the I criteria. Its current Up/Down Volume Ratio of 1.8 is an unbiased indication that over the past 50 days it has been under accumulation. It has an A Timeliness Rating and a C Sponsorship Rating.
Symbol/Exchange
Company Name
Industry Group | PRICE | CHANGE
(%Change) | Day High | Volume
(% DAV)
(% 50 day avg vol) | 52 Wk Hi
% From Hi | Featured
Date | Price
Featured | Pivot Featured | | Max Buy |  GPK - NYSE GPK - NYSE
Graphic Packaging Hldg
CONSUMER NON-DURABLES - Packaging and Containers | $25.42 | +0.42
1.66% | $25.90 | 3,559,749
128.30% of 50 DAV
50 DAV is 2,774,600 | $26.16
-2.85%
| 10/25/2022 | $22.75 | PP = $24.17 | | MB = $25.38 |  Most Recent Note - 6/5/2023 2:51:16 PM Most Recent Note - 6/5/2023 2:51:16 PM
G - Gapped up today rebounding well above its 50 DMA line ($25.08) with today's 3rd consecutive gain backed by above average volume. It has not formed a sound new base but quickly recovered after testing its 4/27/23 low last week. Reported Mar '23 quarterly earnings +60% on +9% sales revenues versus the year-ago period.
>>> FEATURED STOCK ARTICLE : Packaging Firm Due to Report Earnings News - 5/1/2023 | View all notes | Set NEW NOTE alert | Company Profile | SEC News | Chart | Request a new note C A S I | STRL - NASDAQ
Sterling Infrastructure
Bldg-Heavy Construction | $49.92 | +0.72
1.46% | $49.97 | 273,814
113.62% of 50 DAV
50 DAV is 241,000 | $49.26
1.34%
| 12/14/2022 | $32.41 | PP = $33.72 | | MB = $35.41 | Most Recent Note - 6/2/2023 3:50:25 PM
G - Hitting another new all-time high with slightly above average volume behind today's big gain. Bullish action has continued although it reported Mar '23 quarterly earnings +0% on +10% sales revenues versus the year-ago period, below the +25% minimum earnings guideline (C criteria) raising fundamental concerns.
>>> FEATURED STOCK ARTICLE : 50-Day Moving Average Line Acted as Recent Resistance - 4/28/2023 | View all notes | Set NEW NOTE alert | Company Profile | SEC News | Chart | Request a new note C A S I | FIX - NYSE
Comfort Systems USA
Bldg-A/C and Heating Prds | $152.28 | -2.58
-1.67% | $153.61 | 239,006
87.23% of 50 DAV
50 DAV is 274,000 | $156.19
-2.50%
| 4/27/2023 | $148.85 | PP = $152.23 | | MB = $159.84 | Most Recent Note - 6/2/2023 1:26:13 PM
Y - Gapped up today, still hovering near its all-time high. No resistance remains due to overhead supply, however, it has made little headway in recent weeks. Subsequent gains and new highs backed by at least +40% above average volume may help reconfirm a technical buy signal.
>>> FEATURED STOCK ARTICLE : Churning Action While Recently Hovering Near All-Time High - 5/12/2023 | View all notes | Set NEW NOTE alert | Company Profile | SEC News | Chart | Request a new note C A S I | KOF - NYSE
Coca-Cola Femsa ADR
Beverages-Non-Alcoholic | $84.67 | +0.90
1.07% | $85.22 | 120,184
60.70% of 50 DAV
50 DAV is 198,000 | $91.23
-7.19%
| 3/7/2023 | $76.63 | PP = $77.11 | | MB = $80.97 | Most Recent Note - 6/2/2023 1:30:12 PM
G - Finding support near its 50 DMA line ($84.35) with today's 2nd gain backed by lighter volume following 7 consecutive losses marked by higher volume. More damaging losses would trigger a technical sell signal. Reported Mar '23 quarterly earnings +53% on +24% sales revenues versus the year-ago period. Prior highs in the $79-$77 area define the next support to watch below its 50 DMA line.
>>> FEATURED STOCK ARTICLE : Posted Gain Afrer Reporting Strong Mar '23 Quarterly Results - 5/2/2023 | View all notes | Set NEW NOTE alert | Company Profile | SEC News | Chart | Request a new note C A S I | CLH - NYSE
Clean Harbors
Pollution Control | $148.97 | -1.94
-1.29% | $150.50 | 230,479
60.81% of 50 DAV
50 DAV is 379,000 | $151.30
-1.54%
| 3/10/2023 | $136.89 | PP = $136.74 | | MB = $143.58 | Most Recent Note - 6/2/2023 3:52:11 PM
G - Hitting a new all-time high with today's big gain backed by near average volume. Found support near its 50 DMA line ($140) this week. More damaging losses would raise greater concerns. Reported Mar '23 quarterly earnings +64% on +12% sales revenues versus the year-ago period. Fundamentals remain strong.
>>> FEATURED STOCK ARTICLE : Showed Resilience Near 50-Day Moving Average Following Sell-Off - 5/10/2023 | View all notes | Set NEW NOTE alert | Company Profile | SEC News | Chart | Request a new note C A S I | Symbol/Exchange
Company Name
Industry Group | PRICE | CHANGE
(%Change) | Day High | Volume
(% DAV)
(% 50 day avg vol) | 52 Wk Hi
% From Hi | Featured
Date | Price
Featured | Pivot Featured | | Max Buy | SPSC - NASDAQ
SPS Commerce
Comp Sftwr-Spec Enterprs | $163.94 | +1.21
0.74% | $164.40 | 135,420
96.73% of 50 DAV
50 DAV is 140,000 | $164.69
-0.46%
| 4/24/2023 | $150.01 | PP = $157.56 | | MB = $165.44 | Most Recent Note - 6/2/2023 4:05:37 PM
Y - Posted a 2nd solid gain today after pulling back testing its 50 DMA line ($151.91) following a "negative reversal". When wedging to a new 52-week high the recent gains above the pivot point were not backed by the +40% above average volume needed to trigger a proper technical buy signal. Reported Mar '23 quarterly earnings +22% on +20% versus the year-ago period, below the +25% minimum earnings guideline (C criteria) raising some fundamental concerns.
>>> FEATURED STOCK ARTICLE : Pulled Back After Quietly Wedging to New Highs - 5/31/2023 | View all notes | Set NEW NOTE alert | Company Profile | SEC News | Chart | Request a new note C A S I | HUBB - NYSE
Hubbell
Electrical-Power/Equipmt | $294.24 | -0.25
-0.08% | $294.87 | 394,322
97.36% of 50 DAV
50 DAV is 405,000 | $296.28
-0.69%
| 4/25/2023 | $262.85 | PP = $257.51 | | MB = $270.39 | Most Recent Note - 6/2/2023 4:03:47 PM
G - Gapped up today and posted a solid gain with lighter volume for another new all-time high, getting more extended from the prior base. Prior highs in the $263 area define initial support to watch on pullbacks. Fundamentals remain strong. See the latest FSU analysis for more details and an annotated graph.
>>> FEATURED STOCK ARTICLE : Extended From Prior Base and Perched Near High - 6/1/2023 | View all notes | Set NEW NOTE alert | Company Profile | SEC News | Chart | Request a new note C A S I | NVR - NYSE
NVR
Bldg-Resident/Comml | $5,671.20 | -39.80
-0.70% | $5,806.32 | 12,055
52.41% of 50 DAV
50 DAV is 23,000 | $5,986.96
-5.27%
| 4/25/2023 | $5,882.18 | PP = $5,978.25 | | MB = $6,277.16 | Most Recent Note - 6/2/2023 1:32:19 PM
G - Rebounding above its 50 DMA line ($5,693) with today's big gain helping its technical stance. Reported Mar '23 quarterly earnings -14% on -3% sales revenues versus the year-ago period, below the +25% minimum earnings guideline (C criteria) raising fundamental concerns, and its color code was changed to green. Prior quarterly comparisons were well above the +25% minimum earnings guideline (C criteria). Annual earnings (A criteria) growth has been very strong.
>>> FEATURED STOCK ARTICLE : Fell From High and Raised Concern With Subpar Mar '23 Report - 4/27/2023 | View all notes | Set NEW NOTE alert | Company Profile | SEC News | Chart | Request a new note C A S I | PHM - NYSE
PulteGroup
Bldg-Resident/Comml | $69.52 | +0.14
0.19% | $69.78 | 1,593,979
55.71% of 50 DAV
50 DAV is 2,861,000 | $70.54
-1.45%
| 4/25/2023 | $65.17 | PP = $64.01 | | MB = $67.21 | Most Recent Note - 6/2/2023 4:21:44 PM
G - Color code is changed to green after rising back above its "max buy" level. Reported earnings +28% for the Mar '23 quarter versus the year-ago period. Important support to watch is its 50 DMA line ($63.74). See the latest FSU analysis for more details and a new annotated graph.
>>> FEATURED STOCK ARTICLE : Rebounded Above "Max Buy" Level Toward Recent High - 6/2/2023 | View all notes | Set NEW NOTE alert | Company Profile | SEC News | Chart | Request a new note C A S I | COKE - NASDAQ
Coca-Cola Consolidated
Beverages-Non-Alcoholic | $667.63 | -24.60
-3.55% | $692.36 | 44,666
135.35% of 50 DAV
50 DAV is 33,000 | $694.20
-3.83%
| 5/4/2023 | $646.66 | PP = $656.21 | | MB = $689.02 | Most Recent Note - 6/5/2023 2:47:33 PM
Y - Color code is changed to yellow today after pulling back below its "max buy" level. Bullish action came after it reported Mar '23 quarterly earnings +93% on +12% sales revenues versus the year-ago period, continuing its strong earnings track record.
>>> FEATURED STOCK ARTICLE : COKE is Showing Real Strength - 5/4/2023 | View all notes | Set NEW NOTE alert | Company Profile | SEC News | Chart | Request a new note C A S I | Symbol/Exchange
Company Name
Industry Group | PRICE | CHANGE
(%Change) | Day High | Volume
(% DAV)
(% 50 day avg vol) | 52 Wk Hi
% From Hi | Featured
Date | Price
Featured | Pivot Featured | | Max Buy | AMPH - NASDAQ
Amphastar Pharm
Medical-Biomed/Biotech | $46.07 | -0.63
-1.35% | $46.70 | 300,809
76.93% of 50 DAV
50 DAV is 391,000 | $46.86
-1.69%
| 5/15/2023 | $43.56 | PP = $44.15 | | MB = $46.36 | Most Recent Note - 6/2/2023 1:24:42 PM
Y - Hitting a new all-time high and trading near its "max buy" level with today's 5th consecutive gain backed by ever-increasing volume but still below the +40% above average volume guideline. Subsequent gains and a strong close above the pivot point backed by at least +40% above average volume may clinch a technical buy signal. Fundamentals remain strong.
>>> FEATURED STOCK ARTICLE : Weak Finish After Early Gain When Perched Near All-Time High - 5/15/2023 | View all notes | Set NEW NOTE alert | Company Profile | SEC News | Chart | Request a new note C A S I | ANET - NYSE
Arista Networks
Computer-Networking | $162.61 | +0.11
0.07% | $164.04 | 1,989,463
61.46% of 50 DAV
50 DAV is 3,237,000 | $178.36
-8.83%
| 5/30/2023 | $176.35 | PP = $171.54 | | MB = $180.12 | Most Recent Note - 6/2/2023 3:58:23 PM
Y - Pulling back again today. Stalled this week after a streak of 4 consecutive volume-driven gains hitting a new high triggered a technical buy signal. Color code was changed to yellow with new pivot point cited based on its 3/23/23 high plus 10 cents in the 5/30/23 mid-day report. Reported Mar '23 quarterly earnings +70% on +54% sales revenues versus the year-ago period and fundamentals remain strong.
>>> FEATURED STOCK ARTICLE : Technical Sell Signal Triggered by Damaging Volume-Driven Loss - 5/3/2023 | View all notes | Set NEW NOTE alert | Company Profile | SEC News | Chart | Request a new note C A S I | PANW - NASDAQ
Palo Alto Networks
Computer Sftwr-Security | $226.79 | +9.55
4.40% | $230.18 | 13,471,335
345.15% of 50 DAV
50 DAV is 3,903,000 | $219.93
3.12%
| 6/5/2023 | $228.35 | PP = $213.73 | | MB = $224.42 | Most Recent Note - 6/5/2023 5:02:14 PM
Y - Color code was changed to yellow in the earlier mid-day report with new pivot point cited based on its 4/20/22 high plus 10 cents. It powered to a new all-time high with today's gap up and 8th consecutive volume-driven gain, however, it is quickly getting extended from the lengthy new base. Share price was impacted by a 3:1 split on 9/14/22. Reported Apr '23 quarterly earnings +83% on +24% sales revenues versus the year-ago period, and prior quarterly comparisons were above the +25% minimum earnings guideline (C criteria). See the latest FSU analysis for more details and a new annotated graph.
>>> FEATURED STOCK ARTICLE : Palo Alto Powers to New Highs Again - 6/5/2023 | View all notes | Set NEW NOTE alert | Company Profile | SEC News | Chart | Request a new note C A S I |
|
|
|
Color Codes Explained :
Y - Better candidates highlighted by our
staff of experts.
G - Previously featured
in past reports as yellow but may no longer be buyable under the
guidelines.
***Last / Change / Volume data in this table is the closing quote data***
|
|
|
THESE ARE NOT BUY RECOMMENDATIONS!
Comments contained in the body of this report are technical
opinions only. The material herein has been obtained
from sources believed to be reliable and accurate, however,
its accuracy and completeness cannot be guaranteed.
This site is not an investment advisor, hence it does
not endorse or recommend any securities or other investments.
Any recommendation contained in this report may not
be suitable for all investors and it is not to be deemed
an offer or solicitation on our part with respect to
the purchase or sale of any securities. All trademarks,
service marks and trade names appearing in this report
are the property of their respective owners, and are
likewise used for identification purposes only.
This report is a service available
only to active Paid Premium Members.
You may opt-out of receiving report notifications
at any time. Questions or comments may be submitted
by writing to Premium Membership Services 665 S.E. 10 Street, Suite 201 Deerfield Beach, FL 33441-5634 or by calling 1-800-965-8307
or 954-785-1121.
|
|
|