You are not logged in.
This means you
CAN ONLY VIEW reports that were published prior to Thursday, March 20, 2025.
You
MUST UPGRADE YOUR MEMBERSHIP if you want to see any current reports.
AFTER MARKET UPDATE - MONDAY, MAY 1ST, 2023
Previous After Market Report Next After Market Report >>>
|
|
|
|
DOW |
-46.46 |
34,051.70 |
-0.14% |
|
Volume |
800,500,093 |
-25% |
|
Volume |
5,206,229,400 |
-3% |
|
NASDAQ |
-13.99 |
12,212.60 |
-0.11% |
|
Advancers |
1,173 |
40% |
|
Advancers |
2,058 |
46% |
|
S&P 500 |
-1.61 |
4,167.87 |
-0.04% |
|
Decliners |
1,739 |
60% |
|
Decliners |
2,373 |
54% |
|
Russell 2000 |
+0.22 |
1,769.21 |
+0.01% |
|
52 Wk Highs |
79 |
|
|
52 Wk Highs |
102 |
|
|
S&P 600 |
-1.03 |
1,147.14 |
-0.09% |
|
52 Wk Lows |
33 |
|
|
52 Wk Lows |
199 |
|
|
 |
Leadership Improved but Major Indices Seemed Indecisive
Kenneth J. Gruneisen - Passed the CAN SLIM® Master's Exam
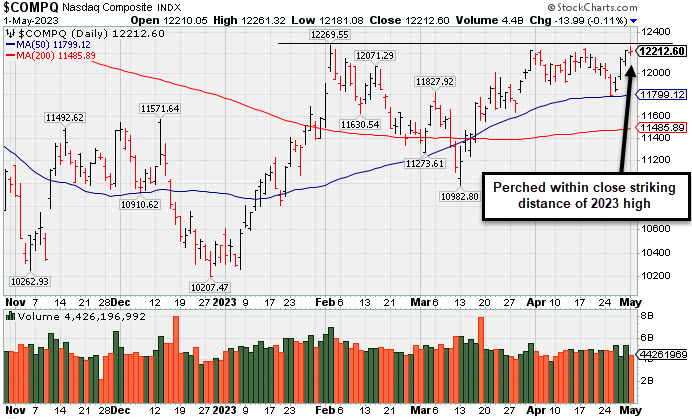
The Dow Jones Industrial Average and the Nasdaq Composite Index each fell 0.1% while the S&P 500 finished just below the flat line. Volume totals reported on Monday were lighter than the prior session on the NYSE and on the Nasdaq exchange. Breadth was negative as decliners led advancers by almost a 3-2 margin on the NYSE and by a narrower margin on the Nasdaq exchange. Leadership improved as there were 44 high-ranked companies from the Leaders List that hit a new 52-week high and were listed on the BreakOuts Page, versus the total of 36 on the prior session. New 52-week highs outnumbered new lows on the NYSE but new lows still outnumbered new highs on the Nasdaq exchange.The major indices are in an uptrend under pressure (M criteria). Appropriate new buying efforts may be considered under the fact-based investment system.
PICTURED: The Nasdaq Composite Index found support above its 50-day moving average (DMA) line last week and it is perched within close striking distance of its 2023 high.
U.S. equities finished flat Monday as investors digested the latest news in the banking sector. They were also looking ahead to the Federal Reserve (Fed) monetary policy meeting which is slated to commence tomorrow. The central bank is widely expected to raise interest rates by 25 basis points (0.25%). Fed Chair Jerome Powell’s post-meeting comments will garner attention as investors try to gauge the future course of monetary policy.
On the data front, the Institute for Supply Management (ISM) Manufacturing Index climbed more than expected to 47.1 in April, indicating a slower pace of contraction (a reading below 50). April’s print marks the sixth-straight month of contraction, the longest stretch since 2009. The report indicated the manufacturing sector faces headwinds from higher borrowing costs, tighter credit conditions, and weaker demand amid higher prices. The final April update on the S&P Global U.S. Manufacturing Purchasing Managers’ Index (PMI) was revised lower from 50.4 to 50.2. Meanwhile, construction spending climbed 0.3% month-over-month in March versus estimates of a 0.1% monthly gain. Treasuries weakened, with the yield on the benchmark 10-year note up 14 basis points (0.14%) to 3.58%, while the 30-year bond yield climbed 16 basis points (0.16%) to 3.83%. The yield on the two-year note, which is more sensitive to changes in monetary policy, advanced 10 basis points (0.10%) to 4.14%. In commodities, West Texas Intermediate (WTI) crude shed 1.4% to $75.70/barrel amid heightened concerns over the global economic outlook.
|
 Kenneth J. Gruneisen started out as a licensed stockbroker in August 1987, a couple of months prior to the historic stock market crash that took the Dow Jones Industrial Average down -22.6% in a single day. He has published daily fact-based fundamental and technical analysis on high-ranked stocks online for two decades. Through FACTBASEDINVESTING.COM, Kenneth provides educational articles, news, market commentary, and other information regarding proven investment systems that work in good times and bad.
Comments contained in the body of this report are technical opinions only and are not necessarily those of Gruneisen Growth Corp. The material herein has been obtained from sources believed to be reliable and accurate, however, its accuracy and completeness cannot be guaranteed. Our firm, employees, and customers may effect transactions, including transactions contrary to any recommendation herein, or have positions in the securities mentioned herein or options with respect thereto. Any recommendation contained in this report may not be suitable for all investors and it is not to be deemed an offer or solicitation on our part with respect to the purchase or sale of any securities. |
|
 |
Financial, Retail, and Commodity-Linked Groups Fell; Techs Rose
Kenneth J. Gruneisen - Passed the CAN SLIM® Master's Exam
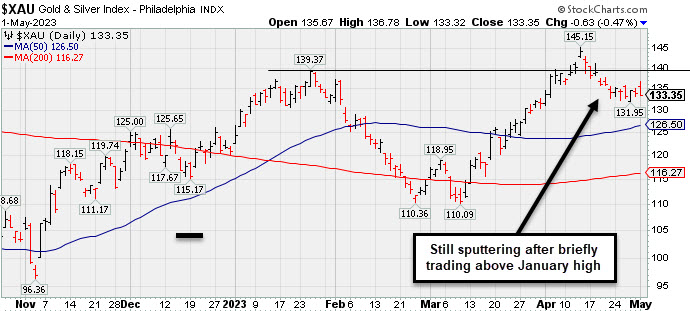
Losses for the Retail Index ($RLX -1.93%), Bank Index ($BKX -1.78%), and Broker/Dealer Index ($XBD -0.83%) weigherd on the major averages. Meanwhile, the tech sector had a positive bias as the Semiconductor Index ($SOX +0.81%), Biotech Index ($BTK +0.55%), and Networking Index ($NWX +0.37%) each posted gains. Commodity-linked groups fell as the Oil Services Index ($OSX -0.68%), Integrated Oil Index ($XOI -0.76%), and Gold & Silver Index ($XAU -0.47%) each lost ground.
PICTURED: The Gold & Silver Index ($XAU -0.47%) has still been sputtering after briefly trading above its January high.
| Oil Services |
$OSX |
77.87 |
-0.53 |
-0.68% |
-7.14% |
| Integrated Oil |
$XOI |
1,741.09 |
-13.29 |
-0.76% |
-2.58% |
| Semiconductor |
$SOX |
3,019.09 |
+24.12 |
+0.81% |
+19.23% |
| Networking |
$NWX |
771.78 |
+2.83 |
+0.37% |
-1.47% |
| Broker/Dealer |
$XBD |
448.43 |
-3.74 |
-0.83% |
-0.16% |
| Retail |
$RLX |
2,999.81 |
-59.02 |
-1.93% |
+8.93% |
| Gold & Silver |
$XAU |
133.35 |
-0.63 |
-0.47% |
+10.33% |
| Bank |
$BKX |
79.83 |
-1.45 |
-1.78% |
-20.84% |
| Biotech |
$BTK |
5,288.54 |
+28.94 |
+0.55% |
+0.14% |
|
|
|
 |
Packaging Firm Due to Report Earnings News
Kenneth J. Gruneisen - Passed the CAN SLIM® Master's Exam
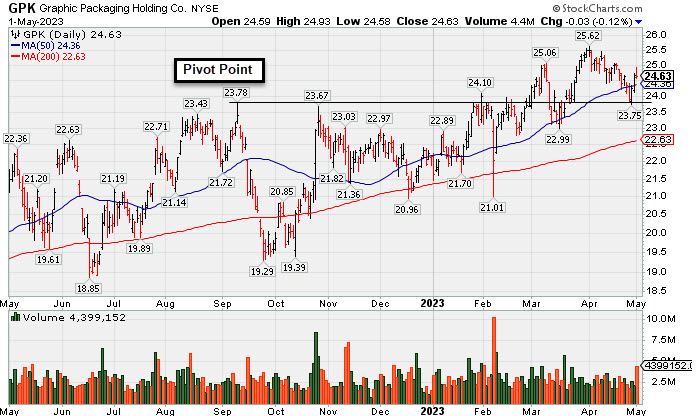
Graphic Packaging Hldg (GPK -$0.03 or -0.12% to $24.63) had a "negative reversal" today as it churned above average volume. A rebound above its 50-day moving average (DMA) line ($24.39) last week helped its outlook improve. It is perched just -3.9% below its all-time high. Recent gains lacked great volume conviction. Keep in mind it is due to report Mar '23 quarterly results in the morning on May 2nd. Volume and volatility often increase near earnings news.
GPK was last shown in this FSU section on 4/10/23 with an annotated graph under the headline, "Quietly Consolidating Just Below 'Max Buy' Level". It was highlighted in yellow with pivot point cited based on its 9/12/22 high plus 10 cents in the 10/25/22 mid-day report (read here). It has an 98 Earnings Per Share Rating. It reported Dec '22 quarterly earnings +74% on +20% sales revenues versus the year ago period. The past 4 quarterly comparisons were well above the +25% minimum earnings guideline (C criteria). Its annual earnings history has been good, meeting the fact-based investment system's fundamental guidelines (A criteria).
The Paper & Paper Products group is ranked 164th on the 197 Industry Groups list and it has a D (18) Group Relative Strength Rating (L criteria). The number of top-rated funds owning its shares rose from 596 in Sep '21 to 789 in Mar '23, a reassuring sign concerning the I criteria. Its current Up/Down Volume Ratio of 1.3 is an unbiased indication its shares have been under accumulation over the past 50 days.
|
|
|
Color Codes Explained :
Y - Better candidates highlighted by our
staff of experts.
G - Previously featured
in past reports as yellow but may no longer be buyable under the
guidelines.
***Last / Change / Volume data in this table is the closing quote data***
Symbol/Exchange
Company Name
Industry Group |
PRICE |
CHANGE
(%Change) |
Day High |
Volume
(% DAV)
(% 50 day avg vol) |
52 Wk Hi
% From Hi |
Featured
Date |
Price
Featured |
Pivot Featured |
|
Max Buy |
 GPK
-
NYSE
GPK
-
NYSE
Graphic Packaging
CONSUMER NON-DURABLES - Packaging and Containers
|
$24.63
|
-0.03
-0.12% |
$24.93
|
4,399,152
154.52% of 50 DAV
50 DAV is 2,847,000
|
$25.62
-3.86%
|
10/25/2022
|
$22.75
|
PP = $24.17
|
|
MB = $25.38
|
 Most Recent Note - 5/1/2023 5:47:37 PM
Y - Due to report Mar '23 quarterly results before the open on Tuesday, May 2nd. Volume and volatility often increase near earnings news. Rebounded above its 50 DMA line ($24.39) last week helping its outlook improve. It is perched just -3.9% below its all-time high. Recent gains lacked great volume conviction. See the latest FSU analysis for more details and a new annotated graph.
>>> FEATURED STOCK ARTICLE : Packaging Firm Due to Report Earnings News - 5/1/2023 |
View all notes |
Set NEW NOTE alert |
Company Profile |
SEC
News |
Chart |
Request a new note
C
A
S
I |
STRL
-
NASDAQ
Sterling Infrastructure
MATERIALS and; CONSTRUCTION - Heavy Construction
|
$37.59
|
+0.67
1.81% |
$37.83
|
310,823
127.91% of 50 DAV
50 DAV is 243,000
|
$42.00
-10.50%
|
12/14/2022
|
$32.41
|
PP = $33.72
|
|
MB = $35.41
|
Most Recent Note - 4/28/2023 4:51:52 PM
G - Posted a 2nd consecutive gain today with below-average volume. Met resistance at its 50 DMA line recently, and a rebound above the 50 DMA line ($37.74) is needed for its outlook to improve. Due to report Mar '23 quarterly results on 5/01/23. Volume and volatility often increase near earnings news. See the latest FSU analysis for more details and a new annotated graph.
>>> FEATURED STOCK ARTICLE : 50-Day Moving Average Line Acted as Recent Resistance - 4/28/2023 |
View all notes |
Set NEW NOTE alert |
Company Profile |
SEC
News |
Chart |
Request a new note
C
A
S
I |
PERI
-
NASDAQ
Perion Network
Comml Svcs-Advertising
|
$35.70
|
+0.67
1.91% |
$36.00
|
497,130
69.53% of 50 DAV
50 DAV is 715,000
|
$42.75
-16.49%
|
1/25/2023
|
$31.79
|
PP = $33.19
|
|
MB = $34.85
|
Most Recent Note - 4/28/2023 3:12:43 PM
G - Volume totals have been cooling while remaining below its 50 DMA line ($36.75) after damaging volume-driven losses triggered a technical sell signal. A rebound above the 50 DMA line is needed to help its outlook improve.
>>> FEATURED STOCK ARTICLE : Perion Pulls Back Toward 50-Day Moving Average Line - 4/20/2023 |
View all notes |
Set NEW NOTE alert |
Company Profile |
SEC
News |
Chart |
Request a new note
C
A
S
I |
FIX
-
NYSE
Comfort Systems USA
MATERIALS and CONSTRUCTION - General Contractors
|
$147.51
|
-1.98
-1.32% |
$152.49
|
221,792
71.32% of 50 DAV
50 DAV is 311,000
|
$152.13
-3.04%
|
4/27/2023
|
$148.85
|
PP = $152.23
|
|
MB = $159.84
|
Most Recent Note - 4/27/2023 5:25:35 PM
Y - Bullish action came today after it reported Mar '23 quarterly earnings +66% on +33% sales revenues versus the year-ago period. Powered above its 50 DMA liner ($138) with a considerable gain backed by twice its average volume. Its color code is changed to yellow with pivot point cited based on its 3/03/23 high plus 10 cents. Very little resistance remains due to overhead supply up to the $152 level. A gain and new high backed by at least +40% above average volume may trigger a technical buy signal.
>>> FEATURED STOCK ARTICLE : Consolidating Near 50-Day Moving Average and -10.5% off High - 4/21/2023 |
View all notes |
Set NEW NOTE alert |
Company Profile |
SEC
News |
Chart |
Request a new note
C
A
S
I |
KOF
-
NYSE
Coca-Cola Femsa ADR
FOOD and BEVERAGE - Beverages - Soft Drinks
|
$83.72
|
+0.73
0.88% |
$83.90
|
115,133
60.92% of 50 DAV
50 DAV is 189,000
|
$85.61
-2.21%
|
3/7/2023
|
$76.63
|
PP = $77.11
|
|
MB = $80.97
|
Most Recent Note - 4/28/2023 3:10:59 PM
G - Rebounding near its all-time high with today's quiet gain. It is extended from the prior base. On pullbacks, prior highs in the $79-$77 area define initial support to watch along with its 50 DMA line ($78.34).
>>> FEATURED STOCK ARTICLE : Streak of 11 Straight Gains into New High Territory - 4/12/2023 |
View all notes |
Set NEW NOTE alert |
Company Profile |
SEC
News |
Chart |
Request a new note
C
A
S
I |
Symbol/Exchange
Company Name
Industry Group |
PRICE |
CHANGE
(%Change) |
Day High |
Volume
(% DAV)
(% 50 day avg vol) |
52 Wk Hi
% From Hi |
Featured
Date |
Price
Featured |
Pivot Featured |
|
Max Buy |
ANET
-
NYSE
Arista Networks
Computer-Networking
|
$160.16
|
+0.00
0.00% |
$162.09
|
4,024,890
162.95% of 50 DAV
50 DAV is 2,470,000
|
$171.44
-6.58%
|
4/24/2023
|
$156.56
|
PP = $171.54
|
|
MB = $180.12
|
Most Recent Note - 5/1/2023 5:49:28 PM
Y - Posted a 4th consecutive gain today, finding support above its 50 DMA line ($155). New pivot point cited was based on its 3/23/23 high plus 10 cents. Subsequent gains above the pivot point backed by at least +40% above average volume may trigger a new (or add-on) technical buy signal. Prior highs in the $148-145 area define additional near-term support to watch on pullbacks.
>>> FEATURED STOCK ARTICLE : Near High With Volume Cooling Following Volume-Driven Gains - 4/17/2023 |
View all notes |
Set NEW NOTE alert |
Company Profile |
SEC
News |
Chart |
Request a new note
C
A
S
I |
CLH
-
NYSE
Clean Harbors
Pollution Control
|
$146.15
|
+0.99
0.68% |
$147.76
|
271,660
63.32% of 50 DAV
50 DAV is 429,000
|
$146.05
0.07%
|
3/10/2023
|
$136.89
|
PP = $136.74
|
|
MB = $143.58
|
Most Recent Note - 4/28/2023 3:14:19 PM
G - Volume is light behind today's 3rd consecutive gain and it is poised for its best-ever close. Recently wedging up above its "max buy" level with gains backed by lackluster volume, not action considered indicative of fresh institutional buying demand. Found prompt support near its 50 DMA line ($137.27) during recent consolidations. Fundamentals remain strong.
>>> FEATURED STOCK ARTICLE : Wedged to a New High Close Above "Max Buy" Level - 4/19/2023 |
View all notes |
Set NEW NOTE alert |
Company Profile |
SEC
News |
Chart |
Request a new note
C
A
S
I |
MTRN
-
NYSE
Materion
METALS and MINING - Industrial Metals and Minerals
|
$107.98
|
-0.33
-0.30% |
$109.99
|
82,292
68.58% of 50 DAV
50 DAV is 120,000
|
$119.75
-9.83%
|
4/18/2023
|
$114.52
|
PP = $118.30
|
|
MB = $124.22
|
Most Recent Note - 4/28/2023 4:23:46 PM
G - Met resistance today when rebounding and remains below its 50 DMA line ($111). Encountered distributional pressure when poised to break out. A prompt rebound above the 50 DMA line is needed for its outlook to improve. Subsequent gains and a strong close above the pivot point backed by at least +40% above average volume may trigger a proper technical buy signal. Due to report Mar '23 quarterly results on 5/03/23. Volume and volatility often increase near earnings news.
>>> FEATURED STOCK ARTICLE : Encountered Distributional Pressure When Poised for Breakout - 4/18/2023 |
View all notes |
Set NEW NOTE alert |
Company Profile |
SEC
News |
Chart |
Request a new note
C
A
S
I |
SPSC
-
NASDAQ
SPS Commerce
COMPUTER SOFTWARE and SERVICES - Application Software
|
$148.41
|
+1.11
0.75% |
$149.50
|
88,840
56.95% of 50 DAV
50 DAV is 156,000
|
$157.46
-5.75%
|
4/24/2023
|
$150.01
|
PP = $157.56
|
|
MB = $165.44
|
Most Recent Note - 4/27/2023 5:29:19 PM
G - Posted a solid gain today with below-average volume and rebounded near its 50 DMA line ($148.48) which may act as resistance. Highlighted in yellow with new pivot point cited based on its 2/15/23 high plus 10 cents in the 4/24/23 mid-day report. A prompt rebound above its 50 DMA line ($148.48) is needed for its outlook to improve. Subsequent gains above the pivot point backed by at least +40% above average volume may trigger a technical buy signal. Reported Mar '23 quarterly earnings +22% on +20% versus the year-ago period raising some fundamental concerns. Volume and volatility often increase near earnings news.
>>> FEATURED STOCK ARTICLE : Sputtered While Perched in Striking Distance of 52-Week HIgh - 4/24/2023 |
View all notes |
Set NEW NOTE alert |
Company Profile |
SEC
News |
Chart |
Request a new note
C
A
S
I |
HUBB
-
NYSE
Hubbell
Electrical-Power/Equipmt
|
$272.86
|
+3.54
1.31% |
$273.60
|
441,444
110.92% of 50 DAV
50 DAV is 398,000
|
$269.37
1.30%
|
4/25/2023
|
$262.85
|
PP = $257.51
|
|
MB = $270.39
|
Most Recent Note - 4/27/2023 5:31:51 PM
Y - Posted a 4th consecutive gain today and hit a new high with volume +19% above average. Gap up and close above the pivot point on 4/25/23 with a considerable gain backed by +367% triggered a technical buy signal. Highlighted in yellow in the 4/25/23 mid-day report with pivot point cited based on its 3/06/23 high after a 4-month double bottom base. Rebounded above its 50 DMA line ($240) and touched a new 52-week high. Reported strong Mar '23 quarterly earnings +70% on +11% sales revenues versus the year-ago period. Its Mar, Jun, Sep, and Dec '22 quarterly earnings increases were above the +25% minimum (C criteria). Annual earnings history (A criteria) had a downturn in FY '20 like many companies during the pandemic.
>>> FEATURED STOCK ARTICLE : Gap Up Following Earnings Triggered Technical Buy Signal - 4/25/2023 |
View all notes |
Set NEW NOTE alert |
Company Profile |
SEC
News |
Chart |
Request a new note
C
A
S
I |
Symbol/Exchange
Company Name
Industry Group |
PRICE |
CHANGE
(%Change) |
Day High |
Volume
(% DAV)
(% 50 day avg vol) |
52 Wk Hi
% From Hi |
Featured
Date |
Price
Featured |
Pivot Featured |
|
Max Buy |
NVR
-
NYSE
NVR Inc
MATERIALS and CONSTRUCTION - Residential Construction
|
$5,870.49
|
+30.49
0.52% |
$5,899.00
|
18,582
80.79% of 50 DAV
50 DAV is 23,000
|
$5,986.96
-1.95%
|
4/25/2023
|
$5,882.18
|
PP = $5,978.25
|
|
MB = $6,277.16
|
Most Recent Note - 4/28/2023 4:28:11 PM
G - Reported Mar '23 quarterly earnings -14% on -3% sales revenues versus the year-ago period, below the +25% minimum earnings guideline (C criteria) raising fundamental concerns, and its color code is changed to green. Posted a gain today with light volume. Highlighted in yellow in the 4/25/23 mid-day report with pivot point cited based on its 12/30/21 high plus 10 cents. Pulled back after rallying to touch a new all-time high. Confirming gains and a close above the pivot point backed by at least +40% above average volume may clinch a proper technical buy signal. . Prior quarterly comparisons were well above the +25% minimum earnings guideline (C criteria). Annual earnings (A criteria) growth has been very strong.
>>> FEATURED STOCK ARTICLE : Fell From High and Raised Concern With Subpar Mar '23 Report - 4/27/2023 |
View all notes |
Set NEW NOTE alert |
Company Profile |
SEC
News |
Chart |
Request a new note
C
A
S
I |
PHM
-
NYSE
PulteGroup
MATERIALS and CONSTRUCTION - Residential Construction
|
$65.78
|
-1.37
-2.04% |
$67.40
|
3,758,349
129.91% of 50 DAV
50 DAV is 2,893,000
|
$67.20
-2.11%
|
4/25/2023
|
$65.17
|
PP = $64.01
|
|
MB = $67.21
|
Most Recent Note - 5/1/2023 5:51:15 PM
Y - Pulled back today with above-average volume. Highlighted in yellow with pivot point cited based on its May 2021 high in the 4/25/23 mid-day report. Bullish action came after it reported earnings +28% for the Mar '23 quarter versus the year-ago period. This Building - Residential/Commercial firm has posted 13 strong quarterly comparisons above the +25% minimum earnings guideline (C criteria). Annual earnings (A criteria) history has been strong.
>>> FEATURED STOCK ARTICLE : Recently Rallying to New All-Time Highs - 4/26/2023 |
View all notes |
Set NEW NOTE alert |
Company Profile |
SEC
News |
Chart |
Request a new note
C
A
S
I |
|
|
|
THESE ARE NOT BUY RECOMMENDATIONS!
Comments contained in the body of this report are technical
opinions only. The material herein has been obtained
from sources believed to be reliable and accurate, however,
its accuracy and completeness cannot be guaranteed.
This site is not an investment advisor, hence it does
not endorse or recommend any securities or other investments.
Any recommendation contained in this report may not
be suitable for all investors and it is not to be deemed
an offer or solicitation on our part with respect to
the purchase or sale of any securities. All trademarks,
service marks and trade names appearing in this report
are the property of their respective owners, and are
likewise used for identification purposes only.
This report is a service available
only to active Paid Premium Members.
You may opt-out of receiving report notifications
at any time. Questions or comments may be submitted
by writing to Premium Membership Services 665 S.E. 10 Street, Suite 201 Deerfield Beach, FL 33441-5634 or by calling 1-800-965-8307
or 954-785-1121.
|
|
|