You are not logged in.
This means you
CAN ONLY VIEW reports that were published prior to Tuesday, March 25, 2025.
You
MUST UPGRADE YOUR MEMBERSHIP if you want to see any current reports.
AFTER MARKET UPDATE - MONDAY, JANUARY 9TH, 2023
Previous After Market Report Next After Market Report >>>
|
|
|
|
DOW |
-112.96 |
33,517.65 |
-0.34% |
|
Volume |
924,979,443 |
+12% |
|
Volume |
5,094,871,100 |
-1% |
|
NASDAQ |
+66.36 |
10,635.65 |
+0.63% |
|
Advancers |
1,832 |
61% |
|
Advancers |
2,741 |
59% |
|
S&P 500 |
-2.99 |
3,892.09 |
-0.08% |
|
Decliners |
1,188 |
39% |
|
Decliners |
1,880 |
41% |
|
Russell 2000 |
+3.11 |
1,795.91 |
+0.17% |
|
52 Wk Highs |
100 |
|
|
52 Wk Highs |
117 |
|
|
S&P 600 |
+0.13 |
1,185.96 |
+0.01% |
|
52 Wk Lows |
9 |
|
|
52 Wk Lows |
39 |
|
|
The market is in a correction (M criteria). Disciplined investors know to avoid new buying, reduce exposure and raise cash until a new confirmed rally with a solid follow-through day is noted.
|
 |
Leadership Improved While Major Indices Ended Mixed
Kenneth J. Gruneisen - Passed the CAN SLIM® Master's Exam
The Dow lost 112 points, while the S&P 500 declined 0.1%. The Nasdaq Composite gained 0.6% as investors piled into the beaten-up tech stocks. Volume totals were mixed, higher than the prior session on the NYSE and lighter on the Nasdaq exchange. Advancers led decliners by a 3-2 margin on the NYSE and on the Nasdaq exchange. Leadership improved as there were 25 high-ranked companies from the Leaders List that hit new 52-week highs and were listed on the BreakOuts Page versus the total of 10 on the prior session. New 52-week highs outnumbered new 52-week lows on the NYSE and on the Nasdaq exchange. The market is in a correction (M criteria). Disciplined investors know to avoid new buying, reduce exposure and raise cash until a new confirmed rally with a solid follow-through day is noted.
Chart courtesy of www.stockcharts.com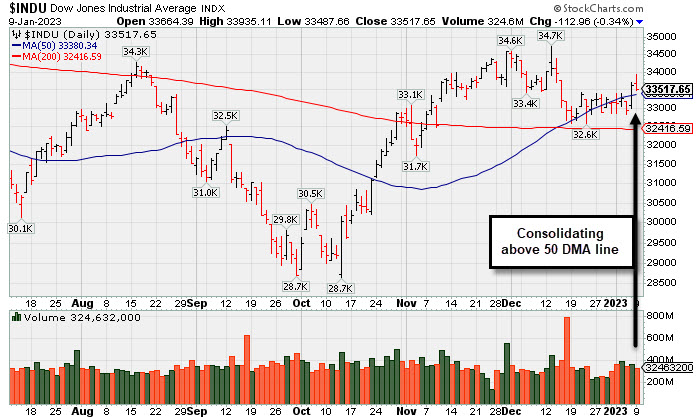 PICTURED: The Dow Jones Industrial Average is consolidating above its 50-day moving average line and remains well above its October low. The Blue Chip index is in healthier shape, technically, versus the other major indices.
U.S. equities reversed earlier gains to close mixed Monday as investors continue to assess if inflation data. Six of the eleven S&P 500 sectors finished in negative territory, with Health Care leading laggards. On the data front, consumer credit unexpectedly rose in November to $27.96 billion versus the estimated $25 billion as credit-card balances increased by the most in three months.
Treasuries strengthened after the New York Federal Reserve (Fed) released a survey Monday afternoon stating consumers see inflation easing this year along with a considerable decease in their spending habits. The yield on the benchmark 10-year note declined three basis points (0.03%) to 3.53%, while the 30-year bond yield dipped four basis points (0.04%) to 3.65%. The yield on the two-year note, which is more sensitive to changes in Fed policy, decreased six basis points (0.06%) to 4.20%. In commodities, West Texas Intermediate (WTI) crude increased 1.4% to $74.83/barrel as China continues to reopen its borders, boosting the outlook for crude oil demand. Meanwhile, the Biden administration slowed its release of U.S. crude reserves into the market last week as some see its distribution nearing the end. The Biden administration has also sparked conversation about refilling the Strategic Petroleum Reserve (SPR) this year. In the metals complex, Gold increased 0.3%, hovering around its eight-month peak as the dollar weakened.
|
 Kenneth J. Gruneisen started out as a licensed stockbroker in August 1987, a couple of months prior to the historic stock market crash that took the Dow Jones Industrial Average down -22.6% in a single day. He has published daily fact-based fundamental and technical analysis on high-ranked stocks online for two decades. Through FACTBASEDINVESTING.COM, Kenneth provides educational articles, news, market commentary, and other information regarding proven investment systems that work in good times and bad.
Comments contained in the body of this report are technical opinions only and are not necessarily those of Gruneisen Growth Corp. The material herein has been obtained from sources believed to be reliable and accurate, however, its accuracy and completeness cannot be guaranteed. Our firm, employees, and customers may effect transactions, including transactions contrary to any recommendation herein, or have positions in the securities mentioned herein or options with respect thereto. Any recommendation contained in this report may not be suitable for all investors and it is not to be deemed an offer or solicitation on our part with respect to the purchase or sale of any securities. |
|
 |
Semiconductor, Broker/Dealer, and Oil Services Indexes Led Gainers
Kenneth J. Gruneisen - Passed the CAN SLIM® Master's Exam
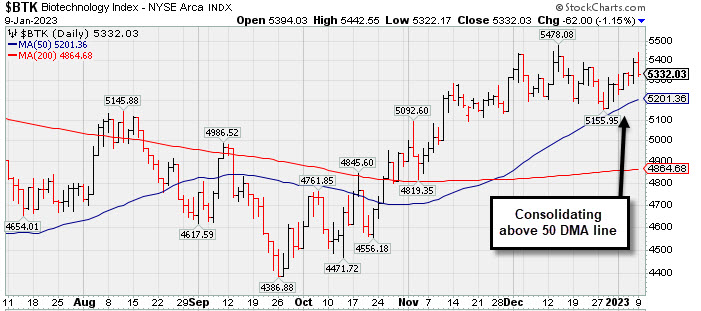
Financial indexes were mixed as the Broker/Dealer Index ($XBD +0.86%) rose while the Bank Index ($BKX -0.44%) edged lower. The Retail Index ($RLX +0.06%) was little changed. The Semiconductor Index ($SOX +1.92%) posted a solid gain while the Networking Index ($NWX +0.35%) inched higher, meanwhile the Biotech Index ($BTK -1.15%) lost ground. Commodity-linked groups were mixed as the Oil Services Index ($OSX +2.11%) posted a solid gain while the Integrated Oil Index ($XOI +0.06%) finished flat and the Gold & Silver Index ($XAU -0.54%) edged lower.
PICTURED: The Biotech Index ($BTK -1.15%) is consolidating above its 50-day moving average (DMA) line toward its 200 DMA line.
| Oil Services |
$OSX |
86.94 |
+1.79 |
+2.11% |
+3.67% |
| Integrated Oil |
$XOI |
1,781.36 |
+1.08 |
+0.06% |
-0.33% |
| Semiconductor |
$SOX |
2,686.75 |
+50.65 |
+1.92% |
+6.11% |
| Networking |
$NWX |
801.63 |
+2.76 |
+0.35% |
+2.34% |
| Broker/Dealer |
$XBD |
466.72 |
+3.96 |
+0.86% |
+3.92% |
| Retail |
$RLX |
2,817.64 |
+1.80 |
+0.06% |
+2.31% |
| Gold & Silver |
$XAU |
131.33 |
-0.71 |
-0.54% |
+8.66% |
| Bank |
$BKX |
104.80 |
-0.46 |
-0.44% |
+3.92% |
| Biotech |
$BTK |
5,332.03 |
-62.00 |
-1.15% |
+0.96% |
|
|
|
 |
Finding Support Near 50-Day Moving Average After Failed Breakout Attempt
Kenneth J. Gruneisen - Passed the CAN SLIM® Master's Exam
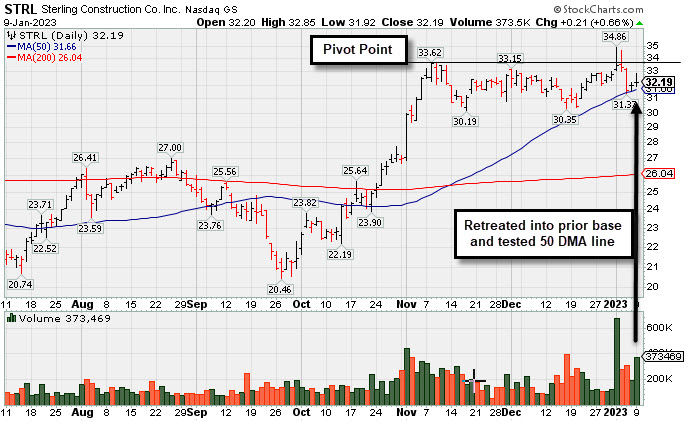
Sterling Infrastructure (STRL+$0.21 or +0.66% to $32.19) abruptly retreated from its 52-week high with 2 consecutive losses backed by above average volume, negating the recent breakout attempt and testing support at its 50-day moving average (DMA) line. It was highlighted in yellow with pivot point cited based on its 11/08/22 high plus 10 cents in the 12/14/22 mid-day report.
Although it faces no resistance due to overhead supply, it reversed most of its early gain on 1/03/22 and closed near the session low - action indicative of distributional pressure rather than that of hearty institutional buying demand. Subsequent gains and a close above the pivot point backed by at least +40% above average volume are needed to trigger a proper technical buy signal. Some of the recent action may rightly be attributed to the broader market's weakness as the market (M criteria) made a noted shift to a "correction". Disciplined investors will watch for a new confirmed uptrend with follow-through day to be noted.
STRL was highlighted in yellow with pivot point cited based on its 11/08/22 high plus 10 cents in the 12/14/22 mid-day report (read here) and is was covered in greater detail that evening with an annotated graph under the headline, "Sterling Infrastructure Forming Orderly Base Pattern".
STRL hails from the Building - Heavy Construction industry group which is ranked 53rd on the 197 Industry Groups list (L criteria). It has a 99 Earnings Per Share Rating. It reported Sep '22 quarterly earnings +35% on +20% sales revenues versus the year ago period, its 5th quarterly comparison at or above the +25% minimum earnings guideline (C criteria). Annual earnings (A criteria) growth has been strong and steady since FY '17.
The company has a small supply of only 30.3 million shares outstanding. That can lead to greater price volatility in the event of institutional buying or selling. The number of top rated funds owning its shares only rose from 337 in Dec '21 to 338 in Sep '22. However, its current Up/Down volume ratio of 1.2 is an unbiased indication its shares have been under accumulation over the past 50 days.
|
|
|
Color Codes Explained :
Y - Better candidates highlighted by our
staff of experts.
G - Previously featured
in past reports as yellow but may no longer be buyable under the
guidelines.
***Last / Change / Volume data in this table is the closing quote data***
Symbol/Exchange
Company Name
Industry Group |
PRICE |
CHANGE
(%Change) |
Day High |
Volume
(% DAV)
(% 50 day avg vol) |
52 Wk Hi
% From Hi |
Featured
Date |
Price
Featured |
Pivot Featured |
|
Max Buy |
 CMC
-
NYSE
CMC
-
NYSE
Commercial Metals Co
METALS and MINING - Steel and Iron
|
$50.33
|
-0.28
-0.55% |
$52.27
|
1,962,227
207.20% of 50 DAV
50 DAV is 947,000
|
$51.70
-2.65%
|
10/14/2022
|
$41.61
|
PP = $44.45
|
|
MB = $46.67
|
 Most Recent Note - 1/9/2023 1:18:38 PM
G - Hit another new 52-week high with today's 4th consecutive gain. Its 50 DMA line ($47.81) and prior low in the $46.50 area define important near-term support to watch on pullbacks. Fundamentals remain strong.
>>> FEATURED STOCK ARTICLE : Consolidating Above 50-Day Moving Average Line and Prior High - 1/3/2023 |
View all notes |
Set NEW NOTE alert |
Company Profile |
SEC
News |
Chart |
Request a new note
C
A
S
I |
GPK
-
NYSE
Graphic Packaging Hldg
CONSUMER NON-DURABLES - Packaging and Containers
|
$22.40
|
-0.42
-1.84% |
$22.99
|
2,249,107
75.07% of 50 DAV
50 DAV is 2,996,000
|
$24.07
-6.94%
|
10/25/2022
|
$22.75
|
PP = $24.17
|
|
MB = $25.38
|
Most Recent Note - 1/6/2023 3:55:23 PM
Y - Color code is changed to yellow after gapping up today and rebounding above the 50 DMA line ($22.39) helping its outlook improve. Faces some resistance due to overhead supply up to the $24 level. Fundamentals remain strong.
>>> FEATURED STOCK ARTICLE : Violated 50-Day Moving Average After Recently Failing to Break Out - 12/15/2022 |
View all notes |
Set NEW NOTE alert |
Company Profile |
SEC
News |
Chart |
Request a new note
C
A
S
I |
GFF
-
NYSE
Griffon Corporation
MATERIALS and CONSTRUCTION - General Building Materials
|
$38.75
|
+2.66
7.37% |
$39.59
|
1,438,880
332.30% of 50 DAV
50 DAV is 433,000
|
$37.69
2.81%
|
11/10/2022
|
$34.13
|
PP = $35.02
|
|
MB = $36.77
|
Most Recent Note - 1/9/2023 1:25:35 PM
G - Hitting a new high and rising above its "max buy" level with today's big volume-driven gain and its color code is changed to green. Its 50 DMA line ($34.61) defines near-term support above recent lows in the $33.82 area. Reported Sep '22 quarterly earnings +230% on +24% sales revenues versus the year ago period.
>>> FEATURED STOCK ARTICLE : Rose Above Max Buy Level With 4th Consecutive Gain - 1/4/2023 |
View all notes |
Set NEW NOTE alert |
Company Profile |
SEC
News |
Chart |
Request a new note
C
A
S
I |
CPRX
-
NASDAQ
Catalyst Pharma Inc
Medical-Biomed/Biotech
|
$19.02
|
-0.58
-2.96% |
$20.35
|
2,858,951
119.47% of 50 DAV
50 DAV is 2,393,000
|
$20.51
-7.26%
|
11/22/2022
|
$17.38
|
PP = $16.66
|
|
MB = $17.49
|
Most Recent Note - 1/9/2023 7:39:06 PM
G - After hitting a new 52-week high on the prior session it ended near the session low with a big loss today. Its 50 DMA line ($16.61) defines near-term support to watch on pullbacks..
>>> FEATURED STOCK ARTICLE : Powerful Rally to New High for Catalyst - 12/20/2022 |
View all notes |
Set NEW NOTE alert |
Company Profile |
SEC
News |
Chart |
Request a new note
C
A
S
I |
TITN
-
NASDAQ
Titan Machinery Inc
SPECIALTY RETAIL
|
$41.10
|
-0.24
-0.58% |
$42.49
|
201,604
89.60% of 50 DAV
50 DAV is 225,000
|
$44.35
-7.33%
|
11/30/2022
|
$40.10
|
PP = $38.68
|
|
MB = $40.61
|
Most Recent Note - 1/6/2023 3:57:27 PM
Y - Posting a 3rd consecutive gain today with higher volume. Found support when recently consolidating near the prior high in the $38 area which defines initial support to watch above its 50 DMA line ($37.35). Fundamentals remain strong after reporting Oct '22 quarterly earnings +91% on +47% sales revenues.
>>> FEATURED STOCK ARTICLE : Found Support Near Prior High Following Breakout - 12/30/2022 |
View all notes |
Set NEW NOTE alert |
Company Profile |
SEC
News |
Chart |
Request a new note
C
A
S
I |
Symbol/Exchange
Company Name
Industry Group |
PRICE |
CHANGE
(%Change) |
Day High |
Volume
(% DAV)
(% 50 day avg vol) |
52 Wk Hi
% From Hi |
Featured
Date |
Price
Featured |
Pivot Featured |
|
Max Buy |
MYE
-
NYSE
Myers Industries Inc
Containers/Packaging
|
$23.33
|
+0.61
2.68% |
$23.53
|
110,552
64.27% of 50 DAV
50 DAV is 172,000
|
$25.55
-8.69%
|
12/8/2022
|
$23.94
|
PP = $25.65
|
|
MB = $26.93
|
Most Recent Note - 1/9/2023 7:40:02 PM
Y - Posted a 2nd consecutive gain today with below average volume after testing its 50 DMA line ($22.24) last week. More damaging losses would trigger a technical sell signal. Still faces resistance due to overhead supply up to the $25.50 level.
>>> FEATURED STOCK ARTICLE : Pullback Testing 50-Day Moving Average Line - 1/5/2023 |
View all notes |
Set NEW NOTE alert |
Company Profile |
SEC
News |
Chart |
Request a new note
C
A
S
I |
BOX
-
NYSE
Box Inc Cl A
Computer Sftwr-Database
|
$29.84
|
-0.07
-0.23% |
$30.74
|
1,132,627
95.58% of 50 DAV
50 DAV is 1,185,000
|
$33.04
-9.69%
|
12/12/2022
|
$29.83
|
PP = $29.57
|
|
MB = $31.05
|
Most Recent Note - 1/5/2023 5:38:27 PM
Y - Slumped for a bigger loss today after trading in a tight range for the past 3 weeks and its color code is changed to yellow while pulling back below its "max buy" level. Faces some resistance due to overhead supply up to the $33 level. Quarterly and annual earnings increases have been strong and steady.
>>> FEATURED STOCK ARTICLE : Pulled Back After Perched Near All-Time High - 1/6/2023 |
View all notes |
Set NEW NOTE alert |
Company Profile |
SEC
News |
Chart |
Request a new note
C
A
S
I |
STRL
-
NASDAQ
Sterling Infrastructure
MATERIALS and; CONSTRUCTION - Heavy Construction
|
$32.19
|
+0.21
0.66% |
$32.85
|
373,492
176.18% of 50 DAV
50 DAV is 212,000
|
$34.86
-7.66%
|
12/14/2022
|
$32.41
|
PP = $33.72
|
|
MB = $35.41
|
Most Recent Note - 1/9/2023 7:37:29 PM
Y - Testing support at its 50 DMA line ($31.66) after its recent failed breakout attempt. Highlighted in yellow with pivot point cited based on its 11/08/22 high plus 10 cents in the 12/14/22 mid-day report. See the latest FSU analysis for more details and a new annotated graph. New buying efforts are discouraged in all stocks while the market is in a correction. Disciplined investors will watch for a new confirmed uptrend with follow-through day to be noted.
>>> FEATURED STOCK ARTICLE : Finding Support Near 50-Day Moving Average After Failed Breakout Attempt - 1/9/2023 |
View all notes |
Set NEW NOTE alert |
Company Profile |
SEC
News |
Chart |
Request a new note
C
A
S
I |
|
|
|
THESE ARE NOT BUY RECOMMENDATIONS!
Comments contained in the body of this report are technical
opinions only. The material herein has been obtained
from sources believed to be reliable and accurate, however,
its accuracy and completeness cannot be guaranteed.
This site is not an investment advisor, hence it does
not endorse or recommend any securities or other investments.
Any recommendation contained in this report may not
be suitable for all investors and it is not to be deemed
an offer or solicitation on our part with respect to
the purchase or sale of any securities. All trademarks,
service marks and trade names appearing in this report
are the property of their respective owners, and are
likewise used for identification purposes only.
This report is a service available
only to active Paid Premium Members.
You may opt-out of receiving report notifications
at any time. Questions or comments may be submitted
by writing to Premium Membership Services 665 S.E. 10 Street, Suite 201 Deerfield Beach, FL 33441-5634 or by calling 1-800-965-8307
or 954-785-1121.
|
|
|