You are not logged in.
This means you
CAN ONLY VIEW reports that were published prior to Thursday, March 20, 2025.
You
MUST UPGRADE YOUR MEMBERSHIP if you want to see any current reports.
AFTER MARKET UPDATE - FRIDAY, MAY 12TH, 2023
Previous After Market Report Next After Market Report >>>
|
|
|
|
DOW |
-8.89 |
33,300.62 |
-0.03% |
|
Volume |
781,699,866 |
-7% |
|
Volume |
4,197,244,700 |
-8% |
|
NASDAQ |
-43.76 |
12,284.74 |
-0.35% |
|
Advancers |
1,260 |
44% |
|
Advancers |
1,733 |
40% |
|
S&P 500 |
-6.54 |
4,124.08 |
-0.16% |
|
Decliners |
1,603 |
56% |
|
Decliners |
2,645 |
60% |
|
Russell 2000 |
-3.86 |
1,740.85 |
-0.22% |
|
52 Wk Highs |
44 |
|
|
52 Wk Highs |
76 |
|
|
S&P 600 |
-3.11 |
1,119.61 |
-0.28% |
|
52 Wk Lows |
112 |
|
|
52 Wk Lows |
248 |
|
|
 |
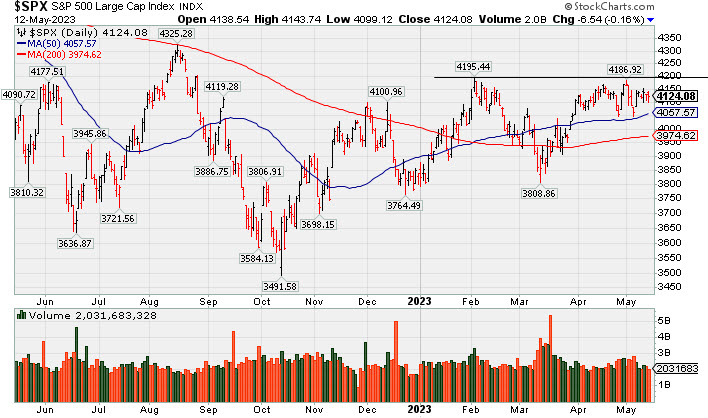
Leadership Improved But Major Indices Still Appear Indecisive
Kenneth J. Gruneisen - Passed the CAN SLIM® Master's Exam
The Dow declined 8 points while the Nasdaq Composite shed 0.4% and the S&P 500 fell 0.2% on Friday. For the week, the major averages finished mixed amid recessionary woes and optimism on easing inflation. Volume totals reported were lighter on the NYSE and on the Nasdaq exchange, indicative of less institutional conviction. Decliners led advancers by a 4-3 margin on the NYSE and on 3-2 the Nasdaq exchange. There were 29 high-ranked companies from the Leaders List that hit a new 52-week high and were listed on the BreakOuts Page, versus the total of 19 on the prior session. New 52-week lows totals expanded and outnumbered new 52-week highs totals on the NYSE and on the Nasdaq exchange. The major indices are in an uptrend under pressure (M criteria). Appropriate new buying efforts may be considered under the fact-based investment system.
PICTURED: The S&P 500 Index is consolidating above support at its 50-day moving average (DMA) line and remains perched within close striking distance of its 2023 high.
Seven of 11 sectors finished in positive territory while U.S. equities finished lower Friday amid heightened concerns over the economic outlook. Investor sentiment came under pressure after today’s planned meeting between President Biden and House Speaker Kevin McCarthy regarding the debt ceiling was postponed. Regional bank shares tumbled today as worries over the banking sector persisted.
On the data front, the University of Michigan Consumer Sentiment Index ticked lower to 57.7 in May, its lowest in six months. The short-term inflation expectations component of the report eased less than expected to 4.5%, while the long-term expectations component unexpectedly ticked higher to 3.2%, its highest level in over ten years. Meanwhile, the import price index came in higher than expected at 0.4% month-over-month in April, notching its first rise in 2023, after falling a revised 0.8% in March. Treasuries weakened, with the yield on the benchmark 10-year note up eight basis points (0.08%) to 3.46%, while the 30-year bond yield advanced five basis points (0.05%) to 3.78%. The yield on the two-year note, which is more sensitive to changes in monetary policy, rose 10 basis points (0.10%) to 3.99%. In commodities, West Texas Intermediate (WTI) crude shed 1% to $70.13/barrel amid strength in the U.S. dollar and concerns over the global demand outlook.
|
 Kenneth J. Gruneisen started out as a licensed stockbroker in August 1987, a couple of months prior to the historic stock market crash that took the Dow Jones Industrial Average down -22.6% in a single day. He has published daily fact-based fundamental and technical analysis on high-ranked stocks online for two decades. Through FACTBASEDINVESTING.COM, Kenneth provides educational articles, news, market commentary, and other information regarding proven investment systems that work in good times and bad.
Comments contained in the body of this report are technical opinions only and are not necessarily those of Gruneisen Growth Corp. The material herein has been obtained from sources believed to be reliable and accurate, however, its accuracy and completeness cannot be guaranteed. Our firm, employees, and customers may effect transactions, including transactions contrary to any recommendation herein, or have positions in the securities mentioned herein or options with respect thereto. Any recommendation contained in this report may not be suitable for all investors and it is not to be deemed an offer or solicitation on our part with respect to the purchase or sale of any securities. |
|
 |
Retail and Financial Indexes Edged Lower
Kenneth J. Gruneisen - Passed the CAN SLIM® Master's Exam
The Retail Index ($RLX -0.73%) and Bank Index ($BKX -0.79%) both lost ground and created a drag on the major indices on Friday and the Broker/Dealer Index ($XBD -0.33%) also edged lower. Commodity-linked groups were little changed as the Gold & Silver Index ($XAU +0.04%), Oil Services Index ($OSX -0.07%), and Integrated Oil Index ($XOI +0.06%) all finished flat. The tech sector was indecisive as the Semiconductor Index ($SOX -0.20%) and Biotech Index ($BTK -0.08%) inched lower while the Networking Index ($NWX +0.24%) inched higher.
PICTURED: The Retail Index ($RLX -0.73%) has made gradual progress above its 50-day and 200-day moving average (DMA) lines toward the February high.
| Oil Services |
$OSX |
71.74 |
-0.05 |
-0.07% |
-14.45% |
| Integrated Oil |
$XOI |
1,628.01 |
+0.98 |
+0.06% |
-8.91% |
| Semiconductor |
$SOX |
2,972.85 |
-5.87 |
-0.20% |
+17.41% |
| Networking |
$NWX |
726.70 |
+1.73 |
+0.24% |
-7.23% |
| Broker/Dealer |
$XBD |
430.19 |
-1.41 |
-0.33% |
-4.22% |
| Retail |
$RLX |
3,107.42 |
-22.93 |
-0.73% |
+12.83% |
| Gold & Silver |
$XAU |
133.52 |
+0.06 |
+0.04% |
+10.47% |
| Bank |
$BKX |
72.64 |
-0.58 |
-0.79% |
-27.97% |
| Biotech |
$BTK |
5,310.03 |
-3.99 |
-0.08% |
+0.55% |
|
|
|
 |
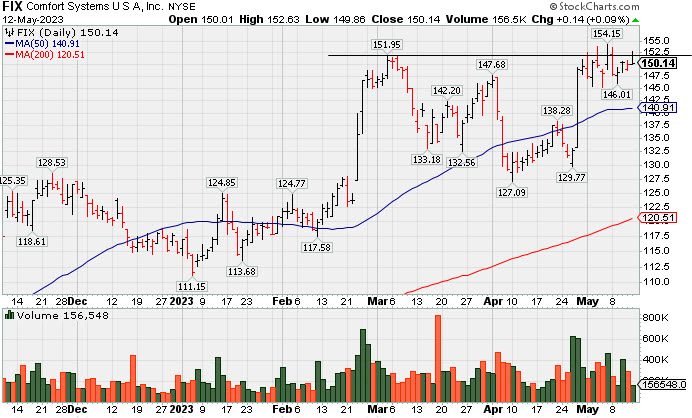
Churning Action While Recently Hovering Near All-Time High
Kenneth J. Gruneisen - Passed the CAN SLIM® Master's Exam
Comfort Systems U S A (FIX +$0.29 or +0.19% to $150.29) inched higher today with lighter volume. No resistance remains due to overhead supply, however, it has made no meaningful price progress in the past 2 weeks while churing above average volume, which is action indictive of distributional pressure. Its current Up/Down Volume Ratio of 1.0 is an unbiased indication of neutral action over the past 50 days concerning Accumulation/Distribution. Additional confirming volume-driven gains to new highs would be a reassuring sign of fresh institutional buying demand. Its 50-day moving average (DMA) line ($141) defines near-term support to watch on pullbacks.
Annual earnings history has been strong and steady. It now has a 98 Earnings Per Share Rating. Bullish action came after it reported Mar '23 quarterly earnings +66% on +33% sales revenues versus the year-ago period. FIX was highlighted in yellow in the 2/23/23 mid-day report (read here) with a pivot point cited based on its 11/23/22 high plus 10 cents. It was last shown in greater detail on 4/21/23 with an annotated graph under the headline, "Consolidating Near 50-Day Moving Average and -10.5% off High."
It hails from the Building - A/C & Heating Products group which is currently ranked 26th on the 197 Industry Groups list. It has a small supply of only 35.8 million shares outstanding (S criteria) which can contribute to greater price volatility in the event of institutional buying or selling. The number of top-rated funds that own its shares rose from 487 in Jun '22 to 594 in Mar '23, a reassuring sign regarding the I criteria. Its current Up/Down Volume Ratio is 1.0, an unbiased indication its shares have been under accumulation over the past 50 days.
|
|
|
Color Codes Explained :
Y - Better candidates highlighted by our
staff of experts.
G - Previously featured
in past reports as yellow but may no longer be buyable under the
guidelines.
***Last / Change / Volume data in this table is the closing quote data***
Symbol/Exchange
Company Name
Industry Group |
PRICE |
CHANGE
(%Change) |
Day High |
Volume
(% DAV)
(% 50 day avg vol) |
52 Wk Hi
% From Hi |
Featured
Date |
Price
Featured |
Pivot Featured |
|
Max Buy |
 GPK
-
NYSE
GPK
-
NYSE
Graphic Packaging
CONSUMER NON-DURABLES - Packaging and Containers
|
$25.95
|
+0.27
1.05% |
$25.97
|
1,938,892
63.82% of 50 DAV
50 DAV is 3,038,000
|
$26.16
-0.80%
|
10/25/2022
|
$22.75
|
PP = $24.17
|
|
MB = $25.38
|
 Most Recent Note - 5/12/2023 5:35:34 PM
G - Volume totals have been cooling while quietly perched near its all-time high. Reported Mar '23 quarterly earnings +60% on +9% sales revenues versus the year-ago period. Its 50 DMA line ($24.74) defines important near-term support to watch on pullbacks.
>>> FEATURED STOCK ARTICLE : Packaging Firm Due to Report Earnings News - 5/1/2023 |
View all notes |
Set NEW NOTE alert |
Company Profile |
SEC
News |
Chart |
Request a new note
C
A
S
I |
STRL
-
NASDAQ
Sterling Infrastructure
MATERIALS and; CONSTRUCTION - Heavy Construction
|
$42.65
|
-0.03
-0.07% |
$43.45
|
151,763
61.44% of 50 DAV
50 DAV is 247,000
|
$43.60
-2.18%
|
12/14/2022
|
$32.41
|
PP = $33.72
|
|
MB = $35.41
|
Most Recent Note - 5/11/2023 6:26:45 PM
G - Perched at its all-time high with volume totals cooling. Reported Mar '23 quarterly earnings +0% on +10% sales revenues versus the year-ago period, below the +25% minimum earnings guideline (C criteria) raising fundamental concerns.
>>> FEATURED STOCK ARTICLE : 50-Day Moving Average Line Acted as Recent Resistance - 4/28/2023 |
View all notes |
Set NEW NOTE alert |
Company Profile |
SEC
News |
Chart |
Request a new note
C
A
S
I |
FIX
-
NYSE
Comfort Systems USA
MATERIALS and CONSTRUCTION - General Contractors
|
$150.29
|
+0.29
0.19% |
$152.63
|
228,914
77.60% of 50 DAV
50 DAV is 295,000
|
$154.15
-2.50%
|
4/27/2023
|
$148.85
|
PP = $152.23
|
|
MB = $159.84
|
Most Recent Note - 5/12/2023 5:38:55 PM
Y - Perched near its all-time high. No resistance remains due to overhead supply, however, it has made little headway in recent weeks while churning above-average volume. Subsequent gains and new highs backed by at least +40% above average volume may help reconfirm a technical buy signal. See the latest FSU analysis for more details and a new annotated graph.
>>> FEATURED STOCK ARTICLE : Churning Action While Recently Hovering Near All-Time High - 5/12/2023 |
View all notes |
Set NEW NOTE alert |
Company Profile |
SEC
News |
Chart |
Request a new note
C
A
S
I |
KOF
-
NYSE
Coca-Cola Femsa ADR
FOOD and BEVERAGE - Beverages - Soft Drinks
|
$88.73
|
-1.89
-2.09% |
$90.74
|
114,278
57.43% of 50 DAV
50 DAV is 199,000
|
$91.23
-2.74%
|
3/7/2023
|
$76.63
|
PP = $77.11
|
|
MB = $80.97
|
Most Recent Note - 5/12/2023 5:39:59 PM
G - Pulled back from its all-time high with lighter volume today. Reported Mar '23 quarterly earnings +53% on +24% sales revenues versus the year-ago period. On pullbacks, prior highs in the $79-$77 area define initial support to watch along with its 50 DMA line ($81.51).
>>> FEATURED STOCK ARTICLE : Posted Gain Afrer Reporting Strong Mar '23 Quarterly Results - 5/2/2023 |
View all notes |
Set NEW NOTE alert |
Company Profile |
SEC
News |
Chart |
Request a new note
C
A
S
I |
CLH
-
NYSE
Clean Harbors
Pollution Control
|
$138.51
|
-1.45
-1.04% |
$140.73
|
208,880
47.69% of 50 DAV
50 DAV is 438,000
|
$147.76
-6.26%
|
3/10/2023
|
$136.89
|
PP = $136.74
|
|
MB = $143.58
|
Most Recent Note - 5/10/2023 5:47:17 PM
Y - Found support near its 50 DMA line ($138.24) after a big loss last week triggered a technical sell signal. More damaging losses would raise greater concerns. Reported Mar '23 quarterly earnings +64% on +12% sales revenues versus the year-ago period. Recently wedged up above its "max buy" level with gains backed by lackluster volume, not action considered indicative of fresh institutional buying demand. Fundamentals remain strong. See the latest FSU analysis for more details and a new annotated graph.
>>> FEATURED STOCK ARTICLE : Showed Resilience Near 50-Day Moving Average Following Sell-Off - 5/10/2023 |
View all notes |
Set NEW NOTE alert |
Company Profile |
SEC
News |
Chart |
Request a new note
C
A
S
I |
Symbol/Exchange
Company Name
Industry Group |
PRICE |
CHANGE
(%Change) |
Day High |
Volume
(% DAV)
(% 50 day avg vol) |
52 Wk Hi
% From Hi |
Featured
Date |
Price
Featured |
Pivot Featured |
|
Max Buy |
MTRN
-
NYSE
Materion
METALS and MINING - Industrial Metals and Minerals
|
$101.63
|
-0.81
-0.79% |
$103.93
|
68,071
66.09% of 50 DAV
50 DAV is 103,000
|
$121.29
-16.21%
|
4/18/2023
|
$114.52
|
PP = $118.30
|
|
MB = $124.22
|
Most Recent Note - 5/9/2023 6:54:29 PM
G - Fell with lighter volume after abruptly retreating on 5/04/23 for damaging loss with above-average volume as it again violated its 50 DMA line ($110.75) raising concerns. Disciplined investors may note that it did not quite produce a gain and a strong close above the pivot point backed by at least +40% above average volume to trigger a proper technical buy signal. Reported Mar '23 quarterly earnings +13% versus the year-ago period, below the +25% minimum guideline (C criteria) raising fundamental concerns. See the latest FSU analysis for more details and a new annotated graph.
>>> FEATURED STOCK ARTICLE : Materion Sputtering Below 50 DMA Line After Subpar Earnings - 5/9/2023 |
View all notes |
Set NEW NOTE alert |
Company Profile |
SEC
News |
Chart |
Request a new note
C
A
S
I |
SPSC
-
NASDAQ
SPS Commerce
COMPUTER SOFTWARE and SERVICES - Application Software
|
$155.72
|
+0.03
0.02% |
$156.32
|
138,125
93.96% of 50 DAV
50 DAV is 147,000
|
$159.65
-2.46%
|
4/24/2023
|
$150.01
|
PP = $157.56
|
|
MB = $165.44
|
Most Recent Note - 5/10/2023 5:31:28 PM
Y - Hit a new 52-week high with today's 4th consecutive gain backed by average volume. Subsequent gains above the pivot point backed by at least +40% above average volume may trigger a technical buy signal. Reported Mar '23 quarterly earnings +22% on +20% versus the year-ago period, below the +25% minimum earnings guideline (C criteria) raising some fundamental concerns.
>>> FEATURED STOCK ARTICLE : Sputtered While Perched in Striking Distance of 52-Week HIgh - 4/24/2023 |
View all notes |
Set NEW NOTE alert |
Company Profile |
SEC
News |
Chart |
Request a new note
C
A
S
I |
HUBB
-
NYSE
Hubbell
Electrical-Power/Equipmt
|
$273.52
|
+0.77
0.28% |
$277.59
|
386,385
99.07% of 50 DAV
50 DAV is 390,000
|
$282.19
-3.07%
|
4/25/2023
|
$262.85
|
PP = $257.51
|
|
MB = $270.39
|
Most Recent Note - 5/9/2023 3:04:04 PM
G - Holding its ground near its all-time high with volume totals cooling. Bullish action came after its strong Mar '23 quarterly results. Prior highs in the $263 area define initial support to watch on pullbacks.
>>> FEATURED STOCK ARTICLE : Gap Up Following Earnings Triggered Technical Buy Signal - 4/25/2023 |
View all notes |
Set NEW NOTE alert |
Company Profile |
SEC
News |
Chart |
Request a new note
C
A
S
I |
NVR
-
NYSE
NVR Inc
MATERIALS and CONSTRUCTION - Residential Construction
|
$5,822.41
|
-15.42
-0.26% |
$5,868.00
|
16,044
72.93% of 50 DAV
50 DAV is 22,000
|
$5,986.96
-2.75%
|
4/25/2023
|
$5,882.18
|
PP = $5,978.25
|
|
MB = $6,277.16
|
Most Recent Note - 5/10/2023 5:53:37 PM
G - Still hovering near its all-time high with volume totals cooling. Reported Mar '23 quarterly earnings -14% on -3% sales revenues versus the year-ago period, below the +25% minimum earnings guideline (C criteria) raising fundamental concerns, and its color code was changed to green. Confirming gains and a close above the pivot point backed by at least +40% above average volume may clinch a proper technical buy signal. Prior quarterly comparisons were well above the +25% minimum earnings guideline (C criteria). Annual earnings (A criteria) growth has been very strong.
>>> FEATURED STOCK ARTICLE : Fell From High and Raised Concern With Subpar Mar '23 Report - 4/27/2023 |
View all notes |
Set NEW NOTE alert |
Company Profile |
SEC
News |
Chart |
Request a new note
C
A
S
I |
PHM
-
NYSE
PulteGroup
MATERIALS and CONSTRUCTION - Residential Construction
|
$68.43
|
+0.31
0.46% |
$68.88
|
2,559,735
85.13% of 50 DAV
50 DAV is 3,007,000
|
$68.73
-0.44%
|
4/25/2023
|
$65.17
|
PP = $64.01
|
|
MB = $67.21
|
Most Recent Note - 5/10/2023 5:59:32 PM
G - Perched at its all-time high and "max buy" level and its color code is changed to green. Reported earnings +28% for the Mar '23 quarter versus the year-ago period. Prior highs in the $64-60 area define initial support to watch above its 50 DMA line ($59.61).
>>> FEATURED STOCK ARTICLE : Recently Rallying to New All-Time Highs - 4/26/2023 |
View all notes |
Set NEW NOTE alert |
Company Profile |
SEC
News |
Chart |
Request a new note
C
A
S
I |
Symbol/Exchange
Company Name
Industry Group |
PRICE |
CHANGE
(%Change) |
Day High |
Volume
(% DAV)
(% 50 day avg vol) |
52 Wk Hi
% From Hi |
Featured
Date |
Price
Featured |
Pivot Featured |
|
Max Buy |
COKE
-
NASDAQ
Coca-Cola Consolidated
FOOD and BEVERAGE - Beverages - Soft Drinks
|
$632.00
|
-1.22
-0.19% |
$634.39
|
32,995
94.27% of 50 DAV
50 DAV is 35,000
|
$694.20
-8.96%
|
5/4/2023
|
$646.66
|
PP = $656.21
|
|
MB = $689.02
|
Most Recent Note - 5/9/2023 3:09:26 PM
Y - Pulling back today for a 3rd consecutive loss, raising concerns while slumping back below the pivot point cited. Solid gain on 5/04/23 backed by +128% above average volume as it closed above the new pivot point cited based on its 6/07/22 high plus 10 cents triggered a technical buy signal. Bullish action came after it reported Mar '23 quarterly earnings +93% on +12% sales revenues versus the year-ago period, continuing its strong earnings track record.
>>> FEATURED STOCK ARTICLE : COKE is Showing Real Strength - 5/4/2023 |
View all notes |
Set NEW NOTE alert |
Company Profile |
SEC
News |
Chart |
Request a new note
C
A
S
I |
|
|
|
THESE ARE NOT BUY RECOMMENDATIONS!
Comments contained in the body of this report are technical
opinions only. The material herein has been obtained
from sources believed to be reliable and accurate, however,
its accuracy and completeness cannot be guaranteed.
This site is not an investment advisor, hence it does
not endorse or recommend any securities or other investments.
Any recommendation contained in this report may not
be suitable for all investors and it is not to be deemed
an offer or solicitation on our part with respect to
the purchase or sale of any securities. All trademarks,
service marks and trade names appearing in this report
are the property of their respective owners, and are
likewise used for identification purposes only.
This report is a service available
only to active Paid Premium Members.
You may opt-out of receiving report notifications
at any time. Questions or comments may be submitted
by writing to Premium Membership Services 665 S.E. 10 Street, Suite 201 Deerfield Beach, FL 33441-5634 or by calling 1-800-965-8307
or 954-785-1121.
|
|
|