You are not logged in.
This means you
CAN ONLY VIEW reports that were published prior to Thursday, March 20, 2025.
You
MUST UPGRADE YOUR MEMBERSHIP if you want to see any current reports.
AFTER MARKET UPDATE - FRIDAY, JUNE 2ND, 2023
Previous After Market Report Next After Market Report >>>
|
|
|
|
DOW |
+701.19 |
33,762.76 |
+2.12% |
|
Volume |
988,487,185 |
-1% |
|
Volume |
4,449,178,600 |
-4% |
|
NASDAQ |
+139.78 |
13,240.77 |
+1.07% |
|
Advancers |
2,448 |
84% |
|
Advancers |
3,284 |
74% |
|
S&P 500 |
+61.35 |
4,282.37 |
+1.45% |
|
Decliners |
451 |
16% |
|
Decliners |
1,143 |
26% |
|
Russell 2000 |
+62.97 |
1,830.91 |
+3.56% |
|
52 Wk Highs |
89 |
|
|
52 Wk Highs |
127 |
|
|
S&P 600 |
+46.13 |
1,181.71 |
+4.06% |
|
52 Wk Lows |
15 |
|
|
52 Wk Lows |
53 |
|
|
 |
Indices Rose and Leadership Improved After Debt Ceiling Deal
Kenneth J. Gruneisen - Passed the CAN SLIM® Master's Exam
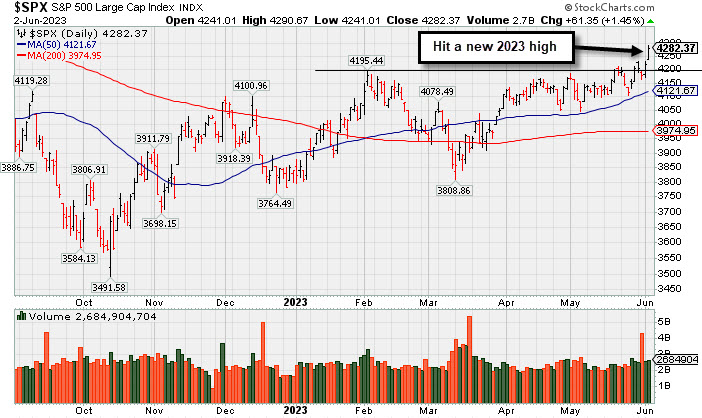
The Dow surged by 701 points (2.1%) while the S&P 500 increased 1.5% and Nasdaq Composite climbed 1.1% for its sixth consecutive week of gains. Volume totals reported were lighter on the NYSE and on the Nasdaq exchange versus the prior session, a sign of lackluster buying demand coming from the institutional crowd. Advancers led decliners by more than a 5-1 margin on the NYSE and by nearly 3-1 on the Nasdaq exchange. Leadership improved as there were 55 high-ranked companies from the Leaders List that hit a new 52-week high and were listed on the BreakOuts Page versus 16 on the prior session. New 52-week highs totals expanded and outnumbered shrinking new 52-week lows totals on the NYSE and on the Nasdaq exchange. The major indices are in a confirmed uptrend (M criteria). Appropriate new buying efforts may be considered under the fact-based investment system.
PICTURED: The S&P 500 Index hit a new 2023 high. The benchmark index found support at its 50-day moving average (DMA) line during the recent consolidation.
All 11 sectors finished in positive territory as U.S. equity markets rallied on Friday. Investors celebrated a strong May jobs report and the U.S. Senate’s (with a 63-36 majority vote) passing of debt-ceiling legislation, averting a default. The bill is now headed to the White House to be signed into law. Bond yields also rose on Friday’s robust payroll figures. On the data front today, non-farm payrolls added 339,000 new jobs in May, exceeding the consensus forecast of 195,000. Upward revisions for March and April underscored May’s stronger-than-anticipated data. The unemployment rate ticked up last month to 3.7% from 3.4% in April, exceeding consensus expectations. Meanwhile, the labor force participation rate was unchanged in May at 62.6%, matching expectations.
Treasury yields across the yield curve moved higher. The yield on the benchmark 10-year note rose by nine basis points (0.09%) to 3.69%, while the 30-year bond yield increased by six basis points (0.06%) to 3.88%. The yield on the two-year note jumped by 16 basis points (0.16%) to 4.50%. In commodities, West Texas Intermediate (WTI) crude advanced 2.7% to $71.98/barrel following news that the U.S. Congress passed a debt-ceiling deal ahead of the Organization of Petroleum Exporting Countries and their allies (OPEC+) meeting this weekend.
|
 Kenneth J. Gruneisen started out as a licensed stockbroker in August 1987, a couple of months prior to the historic stock market crash that took the Dow Jones Industrial Average down -22.6% in a single day. He has published daily fact-based fundamental and technical analysis on high-ranked stocks online for two decades. Through FACTBASEDINVESTING.COM, Kenneth provides educational articles, news, market commentary, and other information regarding proven investment systems that work in good times and bad.
Comments contained in the body of this report are technical opinions only and are not necessarily those of Gruneisen Growth Corp. The material herein has been obtained from sources believed to be reliable and accurate, however, its accuracy and completeness cannot be guaranteed. Our firm, employees, and customers may effect transactions, including transactions contrary to any recommendation herein, or have positions in the securities mentioned herein or options with respect thereto. Any recommendation contained in this report may not be suitable for all investors and it is not to be deemed an offer or solicitation on our part with respect to the purchase or sale of any securities. |
|
 |
Financial and Energy-Linked Groups Led Gainers
Kenneth J. Gruneisen - Passed the CAN SLIM® Master's Exam
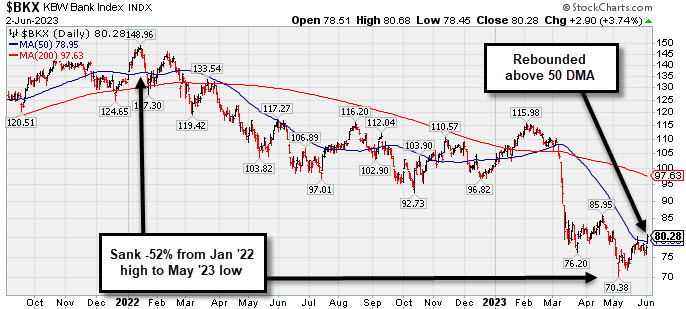
The Bank ($BKX +3.74%) and Broker/Dealer ($XBD +3.06%) both posted influential gains and the Retail ($RLX +1.68%) also rose. The tech sector had a positive bias as the Biotech ($BTK +1.66%) and the Networking ($NWX +2.24%) both rose but the Semiconductor ($SOX -0.15%) ended slightly in the red. Energy-linked groups also had a positive bias as the Oil Services ($OSX +5.50%) and the Integrated Oil ($XOI +3.01%) both posted solid gains. The Gold & Silver ($XAU -0.83%) was a standout decliner on the mostly positive session.
PICTURED: The Bank ($BKX +1.61%) rose for a 2nd consecutive session and closed above 50-day moving average (DMA) line. It slumped -52% from its Jan '22 high to its May '23 low.
| Oil Services |
$OSX |
76.03 |
+3.97 |
+5.50% |
-9.34% |
| Integrated Oil |
$XOI |
1,643.23 |
+48.08 |
+3.01% |
-8.06% |
| Semiconductor |
$SOX |
3,501.40 |
-5.33 |
-0.15% |
+38.28% |
| Networking |
$NWX |
810.95 |
+17.75 |
+2.24% |
+3.53% |
| Broker/Dealer |
$XBD |
453.72 |
+13.49 |
+3.06% |
+1.02% |
| Retail |
$RLX |
3,291.39 |
+54.52 |
+1.68% |
+19.51% |
| Gold & Silver |
$XAU |
125.34 |
-1.05 |
-0.83% |
+3.71% |
| Bank |
$BKX |
80.28 |
+2.90 |
+3.74% |
-20.40% |
| Biotech |
$BTK |
5,372.03 |
+87.59 |
+1.66% |
+1.72% |
|
|
|
 |
Rebounded Above "Max Buy" Level Toward Recent High
Kenneth J. Gruneisen - Passed the CAN SLIM® Master's Exam
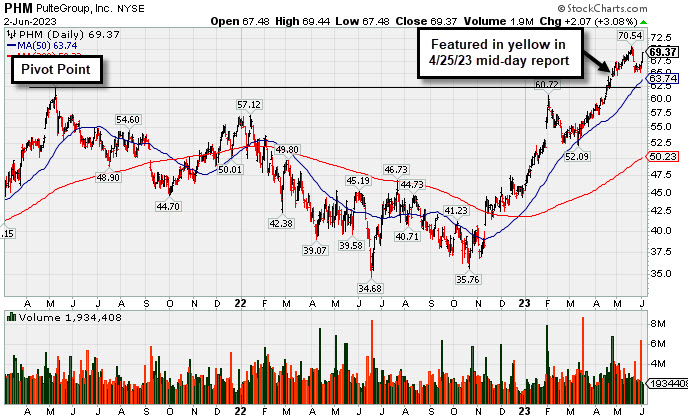
PulteGroup's (PHM +$2.07 or +3.08% to $69.37) color code was changed to green after rising back above its "max buy" level. Important support to watch on pullbacks is its 50-day moving average (DMA) line ($63.73).PHM was highlighted in yellow in the 4/25/23 mid-day report (read here) with pivot point cited based on its May 2021 high. It was shown in greater detail that evening with an annotated graph under the headline, "Recently Rallying to New All-Time Highs".
Bullish action came after it reported earnings +28% for the Mar '23 quarter versus the year-ago period. This Building - Residential/Commercial firm has posted 13 strong quarterly comparisons above the +25% minimum earnings guideline (C criteria). Annual earnings (A criteria) history has been strong. It has a 98 Earnings Per Share Rating.
The number of top-rated funds owning its shares rose from 1,709 in Dec '22 to 1,784 in Mar '23. Its current Up/Down Volume Ratio of 1.7 is an unbiased indication its shares have been under accumulation over the past 50 days. It has a Timeliness Rating of A and an Accumulation/Distribution Rating of C+.
Chart courtesy of www.stockcharts.com
 Symbol/Exchange
Company Name
Industry Group | PRICE | CHANGE
(%Change) | Day High | Volume
(% DAV)
(% 50 day avg vol) | 52 Wk Hi
% From Hi | Featured
Date | Price
Featured | Pivot Featured | | Max Buy |  GPK - NYSE GPK - NYSE
Graphic Packaging Hldg
CONSUMER NON-DURABLES - Packaging and Containers | $25.00 | +0.84
3.48% | $25.05 | 2,559,015
92.40% of 50 DAV
50 DAV is 2,769,400 | $26.16
-4.43%
| 10/25/2022 | $22.75 | PP = $24.17 | | MB = $25.38 |  Most Recent Note - 6/2/2023 4:02:37 PM Most Recent Note - 6/2/2023 4:02:37 PM
G - Rebounded near its 50 DMA line ($25.05) with today's big gain backed by below average volume. Tested its 4/27/23 low this week which defines near term support to watch. Subsequent gains and a close above the 50 DMA line is needed for its outlook to improve. Reported Mar '23 quarterly earnings +60% on +9% sales revenues versus the year-ago period.
>>> FEATURED STOCK ARTICLE : Packaging Firm Due to Report Earnings News - 5/1/2023 | View all notes | Set NEW NOTE alert | Company Profile | SEC News | Chart | Request a new note C A S I | STRL - NASDAQ
Sterling Infrastructure
Bldg-Heavy Construction | $49.20 | +2.76
5.94% | $49.26 | 328,366
137.97% of 50 DAV
50 DAV is 238,000 | $48.44
1.57%
| 12/14/2022 | $32.41 | PP = $33.72 | | MB = $35.41 | Most Recent Note - 6/2/2023 3:50:25 PM
G - Hitting another new all-time high with slightly above average volume behind today's big gain. Bullish action has continued although it reported Mar '23 quarterly earnings +0% on +10% sales revenues versus the year-ago period, below the +25% minimum earnings guideline (C criteria) raising fundamental concerns.
>>> FEATURED STOCK ARTICLE : 50-Day Moving Average Line Acted as Recent Resistance - 4/28/2023 | View all notes | Set NEW NOTE alert | Company Profile | SEC News | Chart | Request a new note C A S I | FIX - NYSE
Comfort Systems USA
Bldg-A/C and Heating Prds | $154.86 | +6.48
4.37% | $154.93 | 286,497
103.80% of 50 DAV
50 DAV is 276,000 | $156.19
-0.85%
| 4/27/2023 | $148.85 | PP = $152.23 | | MB = $159.84 | Most Recent Note - 6/2/2023 1:26:13 PM
Y - Gapped up today, still hovering near its all-time high. No resistance remains due to overhead supply, however, it has made little headway in recent weeks. Subsequent gains and new highs backed by at least +40% above average volume may help reconfirm a technical buy signal.
>>> FEATURED STOCK ARTICLE : Churning Action While Recently Hovering Near All-Time High - 5/12/2023 | View all notes | Set NEW NOTE alert | Company Profile | SEC News | Chart | Request a new note C A S I | KOF - NYSE
Coca-Cola Femsa ADR
Beverages-Non-Alcoholic | $83.77 | +0.32
0.38% | $84.91 | 178,515
89.71% of 50 DAV
50 DAV is 199,000 | $91.23
-8.18%
| 3/7/2023 | $76.63 | PP = $77.11 | | MB = $80.97 | Most Recent Note - 6/2/2023 1:30:12 PM
G - Finding support near its 50 DMA line ($84.35) with today's 2nd gain backed by lighter volume following 7 consecutive losses marked by higher volume. More damaging losses would trigger a technical sell signal. Reported Mar '23 quarterly earnings +53% on +24% sales revenues versus the year-ago period. Prior highs in the $79-$77 area define the next support to watch below its 50 DMA line.
>>> FEATURED STOCK ARTICLE : Posted Gain Afrer Reporting Strong Mar '23 Quarterly Results - 5/2/2023 | View all notes | Set NEW NOTE alert | Company Profile | SEC News | Chart | Request a new note C A S I | CLH - NYSE
Clean Harbors
Pollution Control | $150.91 | +7.42
5.17% | $151.30 | 502,326
132.89% of 50 DAV
50 DAV is 378,000 | $147.76
2.13%
| 3/10/2023 | $136.89 | PP = $136.74 | | MB = $143.58 | Most Recent Note - 6/2/2023 3:52:11 PM
G - Hitting a new all-time high with today's big gain backed by near average volume. Found support near its 50 DMA line ($140) this week. More damaging losses would raise greater concerns. Reported Mar '23 quarterly earnings +64% on +12% sales revenues versus the year-ago period. Fundamentals remain strong.
>>> FEATURED STOCK ARTICLE : Showed Resilience Near 50-Day Moving Average Following Sell-Off - 5/10/2023 | View all notes | Set NEW NOTE alert | Company Profile | SEC News | Chart | Request a new note C A S I | Symbol/Exchange
Company Name
Industry Group | PRICE | CHANGE
(%Change) | Day High | Volume
(% DAV)
(% 50 day avg vol) | 52 Wk Hi
% From Hi | Featured
Date | Price
Featured | Pivot Featured | | Max Buy | SPSC - NASDAQ
SPS Commerce
Comp Sftwr-Spec Enterprs | $162.73 | +4.26
2.69% | $163.40 | 164,356
118.24% of 50 DAV
50 DAV is 139,000 | $164.69
-1.19%
| 4/24/2023 | $150.01 | PP = $157.56 | | MB = $165.44 | Most Recent Note - 6/2/2023 4:05:37 PM
Y - Posted a 2nd solid gain today after pulling back testing its 50 DMA line ($151.91) following a "negative reversal". When wedging to a new 52-week high the recent gains above the pivot point were not backed by the +40% above average volume needed to trigger a proper technical buy signal. Reported Mar '23 quarterly earnings +22% on +20% versus the year-ago period, below the +25% minimum earnings guideline (C criteria) raising some fundamental concerns.
>>> FEATURED STOCK ARTICLE : Pulled Back After Quietly Wedging to New Highs - 5/31/2023 | View all notes | Set NEW NOTE alert | Company Profile | SEC News | Chart | Request a new note C A S I | HUBB - NYSE
Hubbell
Electrical-Power/Equipmt | $294.49 | +7.24
2.52% | $296.28 | 318,556
79.64% of 50 DAV
50 DAV is 400,000 | $291.91
0.88%
| 4/25/2023 | $262.85 | PP = $257.51 | | MB = $270.39 | Most Recent Note - 6/2/2023 4:03:47 PM
G - Gapped up today and posted a solid gain with lighter volume for another new all-time high, getting more extended from the prior base. Prior highs in the $263 area define initial support to watch on pullbacks. Fundamentals remain strong. See the latest FSU analysis for more details and an annotated graph.
>>> FEATURED STOCK ARTICLE : Extended From Prior Base and Perched Near High - 6/1/2023 | View all notes | Set NEW NOTE alert | Company Profile | SEC News | Chart | Request a new note C A S I | NVR - NYSE
NVR
Bldg-Resident/Comml | $5,711.00 | +140.39
2.52% | $5,732.09 | 23,850
103.70% of 50 DAV
50 DAV is 23,000 | $5,986.96
-4.61%
| 4/25/2023 | $5,882.18 | PP = $5,978.25 | | MB = $6,277.16 | Most Recent Note - 6/2/2023 1:32:19 PM
G - Rebounding above its 50 DMA line ($5,693) with today's big gain helping its technical stance. Reported Mar '23 quarterly earnings -14% on -3% sales revenues versus the year-ago period, below the +25% minimum earnings guideline (C criteria) raising fundamental concerns, and its color code was changed to green. Prior quarterly comparisons were well above the +25% minimum earnings guideline (C criteria). Annual earnings (A criteria) growth has been very strong.
>>> FEATURED STOCK ARTICLE : Fell From High and Raised Concern With Subpar Mar '23 Report - 4/27/2023 | View all notes | Set NEW NOTE alert | Company Profile | SEC News | Chart | Request a new note C A S I | PHM - NYSE
PulteGroup
Bldg-Resident/Comml | $69.38 | +2.08
3.09% | $69.44 | 2,450,064
85.16% of 50 DAV
50 DAV is 2,877,000 | $70.54
-1.64%
| 4/25/2023 | $65.17 | PP = $64.01 | | MB = $67.21 | Most Recent Note - 6/2/2023 4:21:44 PM
G - Color code is changed to green after rising back above its "max buy" level. Reported earnings +28% for the Mar '23 quarter versus the year-ago period. Important support to watch is its 50 DMA line ($63.74). See the latest FSU analysis for more details and a new annotated graph.
>>> FEATURED STOCK ARTICLE : Rebounded Above "Max Buy" Level Toward Recent High - 6/2/2023 | View all notes | Set NEW NOTE alert | Company Profile | SEC News | Chart | Request a new note C A S I | COKE - NASDAQ
Coca-Cola Consolidated
Beverages-Non-Alcoholic | $692.23 | +11.99
1.76% | $693.92 | 45,776
138.72% of 50 DAV
50 DAV is 33,000 | $694.20
-0.28%
| 5/4/2023 | $646.66 | PP = $656.21 | | MB = $689.02 | Most Recent Note - 6/2/2023 11:15:54 AM
G - Color code is changed to green after rising above its "max buy" level. Bullish action came after it reported Mar '23 quarterly earnings +93% on +12% sales revenues versus the year-ago period, continuing its strong earnings track record.
>>> FEATURED STOCK ARTICLE : COKE is Showing Real Strength - 5/4/2023 | View all notes | Set NEW NOTE alert | Company Profile | SEC News | Chart | Request a new note C A S I | Symbol/Exchange
Company Name
Industry Group | PRICE | CHANGE
(%Change) | Day High | Volume
(% DAV)
(% 50 day avg vol) | 52 Wk Hi
% From Hi | Featured
Date | Price
Featured | Pivot Featured | | Max Buy | AMPH - NASDAQ
Amphastar Pharm
Medical-Biomed/Biotech | $46.70 | +1.56
3.46% | $46.86 | 604,870
156.70% of 50 DAV
50 DAV is 386,000 | $45.50
2.64%
| 5/15/2023 | $43.56 | PP = $44.15 | | MB = $46.36 | Most Recent Note - 6/2/2023 1:24:42 PM
Y - Hitting a new all-time high and trading near its "max buy" level with today's 5th consecutive gain backed by ever-increasing volume but still below the +40% above average volume guideline. Subsequent gains and a strong close above the pivot point backed by at least +40% above average volume may clinch a technical buy signal. Fundamentals remain strong.
>>> FEATURED STOCK ARTICLE : Weak Finish After Early Gain When Perched Near All-Time High - 5/15/2023 | View all notes | Set NEW NOTE alert | Company Profile | SEC News | Chart | Request a new note C A S I | ANET - NYSE
Arista Networks
Computer-Networking | $162.50 | -4.18
-2.51% | $169.98 | 3,369,498
104.32% of 50 DAV
50 DAV is 3,230,000 | $178.36
-8.89%
| 5/30/2023 | $176.35 | PP = $171.54 | | MB = $180.12 | Most Recent Note - 6/2/2023 3:58:23 PM
Y - Pulling back again today. Stalled this week after a streak of 4 consecutive volume-driven gains hitting a new high triggered a technical buy signal. Color code was changed to yellow with new pivot point cited based on its 3/23/23 high plus 10 cents in the 5/30/23 mid-day report. Reported Mar '23 quarterly earnings +70% on +54% sales revenues versus the year-ago period and fundamentals remain strong.
>>> FEATURED STOCK ARTICLE : Technical Sell Signal Triggered by Damaging Volume-Driven Loss - 5/3/2023 | View all notes | Set NEW NOTE alert | Company Profile | SEC News | Chart | Request a new note C A S I |
|
|
|
Color Codes Explained :
Y - Better candidates highlighted by our
staff of experts.
G - Previously featured
in past reports as yellow but may no longer be buyable under the
guidelines.
***Last / Change / Volume data in this table is the closing quote data***
|
|
|
THESE ARE NOT BUY RECOMMENDATIONS!
Comments contained in the body of this report are technical
opinions only. The material herein has been obtained
from sources believed to be reliable and accurate, however,
its accuracy and completeness cannot be guaranteed.
This site is not an investment advisor, hence it does
not endorse or recommend any securities or other investments.
Any recommendation contained in this report may not
be suitable for all investors and it is not to be deemed
an offer or solicitation on our part with respect to
the purchase or sale of any securities. All trademarks,
service marks and trade names appearing in this report
are the property of their respective owners, and are
likewise used for identification purposes only.
This report is a service available
only to active Paid Premium Members.
You may opt-out of receiving report notifications
at any time. Questions or comments may be submitted
by writing to Premium Membership Services 665 S.E. 10 Street, Suite 201 Deerfield Beach, FL 33441-5634 or by calling 1-800-965-8307
or 954-785-1121.
|
|
|