You are not logged in.
This means you
CAN ONLY VIEW reports that were published prior to Thursday, March 20, 2025.
You
MUST UPGRADE YOUR MEMBERSHIP if you want to see any current reports.
AFTER MARKET UPDATE - THURSDAY, MAY 4TH, 2023
Previous After Market Report Next After Market Report >>>
|
|
|
|
DOW |
-286.50 |
33,127.74 |
-0.86% |
|
Volume |
1,077,966,298 |
+7% |
|
Volume |
4,806,770,200 |
-16% |
|
NASDAQ |
-58.93 |
11,966.40 |
-0.49% |
|
Advancers |
835 |
29% |
|
Advancers |
1,752 |
40% |
|
S&P 500 |
-29.53 |
4,061.22 |
-0.72% |
|
Decliners |
2,028 |
71% |
|
Decliners |
2,621 |
60% |
|
Russell 2000 |
-20.47 |
1,718.81 |
-1.18% |
|
52 Wk Highs |
34 |
|
|
52 Wk Highs |
62 |
|
|
S&P 600 |
-13.57 |
1,112.45 |
-1.21% |
|
52 Wk Lows |
246 |
|
|
52 Wk Lows |
474 |
|
|
 |
Weakness in Financials Again Pressures Major Indices
Kenneth J. Gruneisen - Passed the CAN SLIM® Master's Exam
The Dow lost 286 points (-0.9%), while the Nasdaq Composite shed 0.5%. The S&P 500 fell 0.7%. Volume totals reported were near the prior session on the NYSE and lighter on the Nasdaq exchange. Decliners led advancers by more than a 2-1 margin on the NYSE and by a 3-2 margin on the Nasdaq exchange. There were 29 high-ranked companies from the Leaders List that hit a new 52-week high and were listed on the BreakOuts Page, versus the total of 53 on the prior session. New 52-week lows totals swelled and outnumbered shrinking new highs totals on the NYSE and on the Nasdaq exchange.The major indices are in an uptrend under pressure (M criteria). Appropriate new buying efforts may be considered under the fact-based investment system.
PICTURED: The S&P 500 Index undercut the April low and nearly tested its 50-day moving average (DMA) line with higher volume behind Thursday's 4th consecutive loss after challenging its February high.
U.S. equities finished lower amid reignited concerns about the banking sector. Investors were also digesting the Federal Reserve’s (Fed) monetary policy decision. Yesterday, the central bank opted to raise interest rates by 25 basis points (0.25%). In his post-meeting press conference, Fed Chair Jerome Powell indicated he believes policy is tight, but he is willing to do more if needed to bring down inflation. The policy statement released with the announcement stated they would carefully monitor the impacts of their efforts, signaling they no longer expect additional increases.
On the data front today, initial jobless claims for the week ended April 29 came in at 242,000, up from the prior week’s revised 229,000 print. Meanwhile, a preliminary reading of first-quarter nonfarm productivity fell 2.7% after climbing 1.6% in the prior quarter, while unit labor costs climbed by an annualized 6.3%. The combination of declining productivity and accelerating labor costs paints a difficult path for the Fed as the try to curb inflation. April’s U.S. Challenger job cuts announcement showed job cuts rose 175.9% year-over-year, with retailers and the technology sector announcing the most cuts. Treasuries were mixed, with the yield on the 10-year up one basis point (0.01%) to 3.36%, while the 30-year bond yield climbed five basis points (0.05%) to 3.72%. The yield on the two-year note fell 10 basis points (0.10%) to 3.76%. In commodities, West Texas Intermediate (WTI) crude fell 0.2% to $68.48/barrel amid concerns over the global economic outlook.
|
 Kenneth J. Gruneisen started out as a licensed stockbroker in August 1987, a couple of months prior to the historic stock market crash that took the Dow Jones Industrial Average down -22.6% in a single day. He has published daily fact-based fundamental and technical analysis on high-ranked stocks online for two decades. Through FACTBASEDINVESTING.COM, Kenneth provides educational articles, news, market commentary, and other information regarding proven investment systems that work in good times and bad.
Comments contained in the body of this report are technical opinions only and are not necessarily those of Gruneisen Growth Corp. The material herein has been obtained from sources believed to be reliable and accurate, however, its accuracy and completeness cannot be guaranteed. Our firm, employees, and customers may effect transactions, including transactions contrary to any recommendation herein, or have positions in the securities mentioned herein or options with respect thereto. Any recommendation contained in this report may not be suitable for all investors and it is not to be deemed an offer or solicitation on our part with respect to the purchase or sale of any securities. |
|
 |
Financials Fell as Gold & Silver and Biotech Indexes Rose
Kenneth J. Gruneisen - Passed the CAN SLIM® Master's Exam
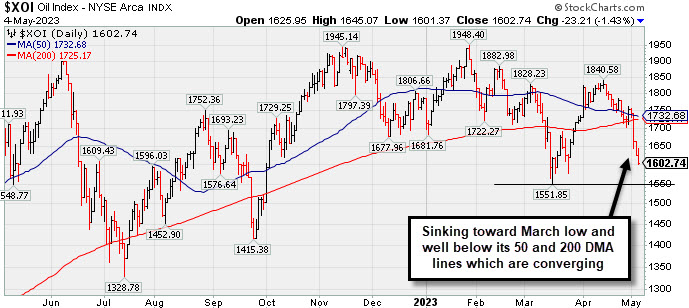
The Bank Index ($BKX -3.82%) and Broker/Dealer Index ($XBD -2.36%) both sank further, continuing to create a drag on the major averages. The Retail Index ($RLX -0.63%) edged lower. Tech shares were mixed as the Biotech Index ($BTK +0.55%) edged higher while the Semiconductor Index ($SOX -0.53%) and Networking Index ($NWX -0.65%) lost ground. Commodity-linked groups were also mixed as the Gold & Silver Index ($XAU +2.37%) rose, meanwhile the Oil Services Index ($OSX -0.33%) and Integrated Oil Index ($XOI -1.43%) both fell.
PICTURED: The Broker/Dealer Index ($XBD -2.21%) recently slumped back below its 200 DMA line after meeting resistance near its 50 DMA line. It suffered a 3rd consecutive loss on Wednesday as it violated the March low raising greater concerns.
| Oil Services |
$OSX |
72.78 |
-0.24 |
-0.33% |
-13.21% |
| Integrated Oil |
$XOI |
1,602.74 |
-23.21 |
-1.43% |
-10.32% |
| Semiconductor |
$SOX |
2,941.63 |
-15.74 |
-0.53% |
+16.17% |
| Networking |
$NWX |
733.59 |
-4.79 |
-0.65% |
-6.35% |
| Broker/Dealer |
$XBD |
417.38 |
-10.09 |
-2.36% |
-7.07% |
| Retail |
$RLX |
2,991.48 |
-19.09 |
-0.63% |
+8.62% |
| Gold & Silver |
$XAU |
141.11 |
+3.27 |
+2.37% |
+16.76% |
| Bank |
$BKX |
71.96 |
-2.86 |
-3.82% |
-28.65% |
| Biotech |
$BTK |
5,241.63 |
+28.60 |
+0.55% |
-0.75% |
|
|
|
 |
COKE is Showing Real Strength
Kenneth J. Gruneisen - Passed the CAN SLIM® Master's Exam
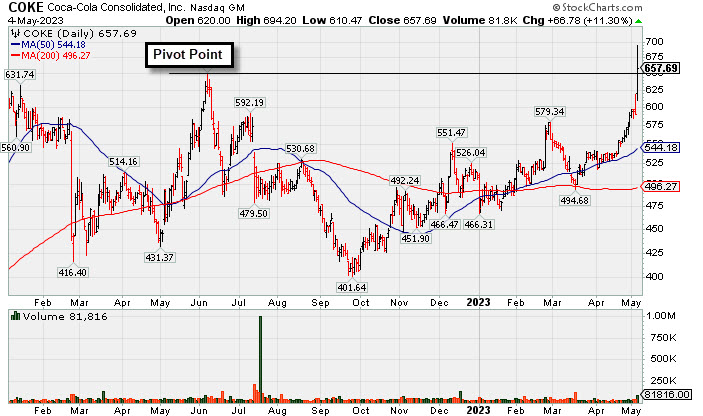
Coca-Cola Consolidated (COKE +$66.78 or +11.30% to $657.69) posted a solid gain backed by +128% above average volume and closed above the new pivot point cited based on its 6/07/22 high plus 10 cents, triggering a technical buy signal. Bullish action came after it reported Mar '23 quarterly earnings +93% on +12% sales revenues versus the year-ago period, continuing its strong earnings track record.
COKE has a 99 Earnings Per Share Rating, well above the 80+ minimum for buy candidates. The 5 latest quarterly comparisons were well above the +25% minimum earnings guideline (C criteria). Annual earnings (A criteria) growth has been very strong after a slight downturn in FY '18. Fundamentals remained strong while COKE went through a deep consolidation since dropped from the Featured Stocks list when noted on 6/16/22. It abruptly stalled and encountered distributional pressure after hitting a new high.
The number of top-rated funds owning its shares rose from 379 in Jun '21 to 476 in Mar '23, a reassuring sign concerning the I criteria. Its current Up/Down Volume Ratio of 0.7 is an unbiased indication its shares have been under distributional pressure over the past 50 days. It has a Timeliness Rating of A and a Sponsorship Rating of C. There are only 5.8 million shares in the public float which can contribute to greater price volatility due to any buying or selling by the institutional crowd. |
|
|
Color Codes Explained :
Y - Better candidates highlighted by our
staff of experts.
G - Previously featured
in past reports as yellow but may no longer be buyable under the
guidelines.
***Last / Change / Volume data in this table is the closing quote data***
Symbol/Exchange
Company Name
Industry Group |
PRICE |
CHANGE
(%Change) |
Day High |
Volume
(% DAV)
(% 50 day avg vol) |
52 Wk Hi
% From Hi |
Featured
Date |
Price
Featured |
Pivot Featured |
|
Max Buy |
 GPK
-
NYSE
GPK
-
NYSE
Graphic Packaging
CONSUMER NON-DURABLES - Packaging and Containers
|
$25.20
|
+0.10
0.40% |
$25.47
|
3,679,378
119.93% of 50 DAV
50 DAV is 3,068,000
|
$26.11
-3.49%
|
10/25/2022
|
$22.75
|
PP = $24.17
|
|
MB = $25.38
|
Most Recent Note - 5/2/2023 12:35:36 PM
Y - Gapped up today then reversed into the red. Reported Mar '23 quarterly earnings +60% versus the year-ago period. Volume and volatility often increase near earnings news. Rebounded above its 50 DMA line ($24.41) last week helping its outlook improve. It is perched just -4.8% below its all-time high. Recent gains lacked great volume conviction. See the latest FSU analysis for more details and a new annotated graph.
>>> FEATURED STOCK ARTICLE : Packaging Firm Due to Report Earnings News - 5/1/2023 |
View all notes |
Set NEW NOTE alert |
Company Profile |
SEC
News |
Chart |
Request a new note
C
A
S
I |
STRL
-
NASDAQ
Sterling Infrastructure
MATERIALS and; CONSTRUCTION - Heavy Construction
|
$40.63
|
-1.37
-3.26% |
$42.16
|
319,915
125.46% of 50 DAV
50 DAV is 255,000
|
$43.05
-5.62%
|
12/14/2022
|
$32.41
|
PP = $33.72
|
|
MB = $35.41
|
 Most Recent Note - 5/4/2023 6:11:46 PM
G - Pulled back today after hitting a new all-time high with 5 consecutive gains backed by ever-increasing volume. Rebound above the 50 DMA line ($38) this week helped its technical stance improve. Reported Mar '23 quarterly earnings +0% on +10% sales revenues versus the year-ago period, below the +25% minimum earnings guideline (C criteria) raising fundamental concerns. Volume and volatility often increase near earnings news.
>>> FEATURED STOCK ARTICLE : 50-Day Moving Average Line Acted as Recent Resistance - 4/28/2023 |
View all notes |
Set NEW NOTE alert |
Company Profile |
SEC
News |
Chart |
Request a new note
C
A
S
I |
PERI
-
NASDAQ
Perion Network
Comml Svcs-Advertising
|
$32.19
|
-1.74
-5.13% |
$33.49
|
1,296,131
176.34% of 50 DAV
50 DAV is 735,000
|
$42.75
-24.70%
|
1/25/2023
|
$31.79
|
PP = $33.19
|
|
MB = $34.85
|
Most Recent Note - 5/4/2023 6:06:45 PM
Suffered yet another damaging loss today with above-average volume raising greater concerns. Reported Mar '23 quarterly earnings +36% versus the year-ago period. On the prior session, it gapped up but there was a "negative reversal" and loss with heavy volume as it quickly slumped back below its 50 DMA line ($36.82). A convincing rebound and close above the 50 DMA line is needed to help its outlook improve. It will be dropped from the Featured Stocks list tonight.
>>> FEATURED STOCK ARTICLE : Perion Pulls Back Toward 50-Day Moving Average Line - 4/20/2023 |
View all notes |
Set NEW NOTE alert |
Company Profile |
SEC
News |
Chart |
Request a new note
C
A
S
I |
FIX
-
NYSE
Comfort Systems USA
MATERIALS and CONSTRUCTION - General Contractors
|
$147.99
|
-1.71
-1.14% |
$148.89
|
338,959
108.99% of 50 DAV
50 DAV is 311,000
|
$153.90
-3.84%
|
4/27/2023
|
$148.85
|
PP = $152.23
|
|
MB = $159.84
|
Most Recent Note - 5/2/2023 6:26:14 PM
Y - Posted a gain today with near-average volume. Bullish action came after it reported Mar '23 quarterly earnings +66% on +33% sales revenues versus the year-ago period. Powered above its 50 DMA line ($139.34) with a considerable gain backed by twice its average volume. Its color code was changed to yellow with pivot point cited based on its 3/03/23 high plus 10 cents. Very little resistance remains due to overhead supply up to the $152 level. A gain and new high backed by at least +40% above average volume may trigger a technical buy signal.
>>> FEATURED STOCK ARTICLE : Consolidating Near 50-Day Moving Average and -10.5% off High - 4/21/2023 |
View all notes |
Set NEW NOTE alert |
Company Profile |
SEC
News |
Chart |
Request a new note
C
A
S
I |
KOF
-
NYSE
Coca-Cola Femsa ADR
FOOD and BEVERAGE - Beverages - Soft Drinks
|
$86.97
|
+1.06
1.23% |
$87.00
|
186,691
98.26% of 50 DAV
50 DAV is 190,000
|
$86.74
0.27%
|
3/7/2023
|
$76.63
|
PP = $77.11
|
|
MB = $80.97
|
Most Recent Note - 5/2/2023 6:32:12 PM
G - Rebounded near its all-time high with today's gain backed by near-average volume. Reported Mar '23 quarterly earnings +53% on +24% sales revenues versus the year-ago period. On pullbacks, prior highs in the $79-$77 area define initial support to watch along with its 50 DMA line ($78.88). See the latest FSU analysis for more details and a new annotated graph.
>>> FEATURED STOCK ARTICLE : Posted Gain Afrer Reporting Strong Mar '23 Quarterly Results - 5/2/2023 |
View all notes |
Set NEW NOTE alert |
Company Profile |
SEC
News |
Chart |
Request a new note
C
A
S
I |
Symbol/Exchange
Company Name
Industry Group |
PRICE |
CHANGE
(%Change) |
Day High |
Volume
(% DAV)
(% 50 day avg vol) |
52 Wk Hi
% From Hi |
Featured
Date |
Price
Featured |
Pivot Featured |
|
Max Buy |
CLH
-
NYSE
Clean Harbors
Pollution Control
|
$136.54
|
-0.97
-0.71% |
$138.35
|
473,869
103.46% of 50 DAV
50 DAV is 458,000
|
$147.76
-7.59%
|
3/10/2023
|
$136.89
|
PP = $136.74
|
|
MB = $143.58
|
Most Recent Note - 5/3/2023 12:20:17 PM
G - Reported Mar '23 quarterly earnings +64% versus the year-ago period. Volume and volatility often increase near earnings news. Recovered a lot after early weakness today violated its 50 DMA line ($137.67) with a big loss triggering a technical sell signal. Recently wedged up above its "max buy" level with gains backed by lackluster volume, not action considered indicative of fresh institutional buying demand. Fundamentals remain strong.
>>> FEATURED STOCK ARTICLE : Wedged to a New High Close Above "Max Buy" Level - 4/19/2023 |
View all notes |
Set NEW NOTE alert |
Company Profile |
SEC
News |
Chart |
Request a new note
C
A
S
I |
MTRN
-
NYSE
Materion
METALS and MINING - Industrial Metals and Minerals
|
$106.37
|
-11.74
-9.94% |
$117.05
|
143,197
132.59% of 50 DAV
50 DAV is 108,000
|
$121.29
-12.30%
|
4/18/2023
|
$114.52
|
PP = $118.30
|
|
MB = $124.22
|
Most Recent Note - 5/4/2023 6:02:02 PM
G - Abruptly retreated today for damaging loss with above average volume as it again violated its 50 DMA line ($111) raising concerns, and its color code is changed to green. Disciplined investors may note that on the prior session it did not quite produce a gain and a strong close above the pivot point backed by at least +40% above average volume to trigger a proper technical buy signal. Reported Mar '23 quarterly earnings +13% versus the year-ago period, below the +25% minimum guideline (C criteria) raising fundamental concerns. Volume and volatility often increase near earnings news.
>>> FEATURED STOCK ARTICLE : Encountered Distributional Pressure When Poised for Breakout - 4/18/2023 |
View all notes |
Set NEW NOTE alert |
Company Profile |
SEC
News |
Chart |
Request a new note
C
A
S
I |
SPSC
-
NASDAQ
SPS Commerce
COMPUTER SOFTWARE and SERVICES - Application Software
|
$149.00
|
-3.49
-2.29% |
$152.27
|
122,159
79.32% of 50 DAV
50 DAV is 154,000
|
$157.46
-5.37%
|
4/24/2023
|
$150.01
|
PP = $157.56
|
|
MB = $165.44
|
Most Recent Note - 5/4/2023 6:10:28 PM
Y - Although it pulled back today with lighter volume, its color code is changed to yellow after rebounding above its 50 DMA line ($148.35) which had acted as resistance. Subsequent gains above the pivot point backed by at least +40% above average volume may trigger a technical buy signal. Reported Mar '23 quarterly earnings +22% on +20% versus the year-ago period, below the +25% minimum earnings guideline (C criteria) raising some fundamental concerns. Volume and volatility often increase near earnings news.
>>> FEATURED STOCK ARTICLE : Sputtered While Perched in Striking Distance of 52-Week HIgh - 4/24/2023 |
View all notes |
Set NEW NOTE alert |
Company Profile |
SEC
News |
Chart |
Request a new note
C
A
S
I |
HUBB
-
NYSE
Hubbell
Electrical-Power/Equipmt
|
$269.51
|
-3.76
-1.38% |
$272.09
|
334,508
81.79% of 50 DAV
50 DAV is 409,000
|
$282.19
-4.49%
|
4/25/2023
|
$262.85
|
PP = $257.51
|
|
MB = $270.39
|
Most Recent Note - 5/2/2023 6:29:36 PM
G - Posted a 7th consecutive gain today hitting a new high above its "max buy" level with volume +73% above average and its color code is changed to green. Bullish action came after its strong Mar '23 quarterly results. Prior highs in the $263 area define initial support to watch on pullbacks.
>>> FEATURED STOCK ARTICLE : Gap Up Following Earnings Triggered Technical Buy Signal - 4/25/2023 |
View all notes |
Set NEW NOTE alert |
Company Profile |
SEC
News |
Chart |
Request a new note
C
A
S
I |
NVR
-
NYSE
NVR Inc
MATERIALS and CONSTRUCTION - Residential Construction
|
$5,801.35
|
-93.47
-1.59% |
$5,852.66
|
16,095
69.98% of 50 DAV
50 DAV is 23,000
|
$5,986.96
-3.10%
|
4/25/2023
|
$5,882.18
|
PP = $5,978.25
|
|
MB = $6,277.16
|
Most Recent Note - 5/3/2023 10:08:59 AM
G - Still perched near its all-time high with today's 5th consecutive gain. Reported Mar '23 quarterly earnings -14% on -3% sales revenues versus the year-ago period, below the +25% minimum earnings guideline (C criteria) raising fundamental concerns, and its color code was changed to green. Confirming gains and a close above the pivot point backed by at least +40% above average volume may clinch a proper technical buy signal. Prior quarterly comparisons were well above the +25% minimum earnings guideline (C criteria). Annual earnings (A criteria) growth has been very strong.
>>> FEATURED STOCK ARTICLE : Fell From High and Raised Concern With Subpar Mar '23 Report - 4/27/2023 |
View all notes |
Set NEW NOTE alert |
Company Profile |
SEC
News |
Chart |
Request a new note
C
A
S
I |
Symbol/Exchange
Company Name
Industry Group |
PRICE |
CHANGE
(%Change) |
Day High |
Volume
(% DAV)
(% 50 day avg vol) |
52 Wk Hi
% From Hi |
Featured
Date |
Price
Featured |
Pivot Featured |
|
Max Buy |
PHM
-
NYSE
PulteGroup
MATERIALS and CONSTRUCTION - Residential Construction
|
$66.37
|
-0.12
-0.18% |
$67.00
|
3,393,770
114.54% of 50 DAV
50 DAV is 2,963,000
|
$67.40
-1.53%
|
4/25/2023
|
$65.17
|
PP = $64.01
|
|
MB = $67.21
|
Most Recent Note - 5/3/2023 10:07:19 AM
Y - Churning above-average volume for the past week yet it remains perched near its all-time high and "max buy" level. Highlighted in yellow with pivot point cited based on its May 2021 high in the 4/25/23 mid-day report. Bullish action came after it reported earnings +28% for the Mar '23 quarter versus the year-ago period. Prior highs in the $64-60 area define initial support to watch above its 50 DMA line ($58.26).
>>> FEATURED STOCK ARTICLE : Recently Rallying to New All-Time Highs - 4/26/2023 |
View all notes |
Set NEW NOTE alert |
Company Profile |
SEC
News |
Chart |
Request a new note
C
A
S
I |
COKE
-
NASDAQ
Coca-Cola Consolidated
FOOD and BEVERAGE - Beverages - Soft Drinks
|
$657.69
|
+66.78
11.30% |
$694.20
|
81,824
233.78% of 50 DAV
50 DAV is 35,000
|
$656.11
0.24%
|
5/4/2023
|
$646.66
|
PP = $656.21
|
|
MB = $689.02
|
Most Recent Note - 5/4/2023 5:54:08 PM
Y - Posted a solid gain backed by +128% above average volume and closed above the new pivot point cited based on its 6/07/22 high plus 10 cents, triggering a technical buy signal. Bullish action came after it reported Mar '23 quarterly earnings +93% on +12% sales revenues versus the year-ago period, continuing its strong earnings track record. Went through a deep consolidation since dropped from the Featured Stocks list when noted on 6/16/22. Abruptly stalled and encountered distributional pressure after hitting a new high. See the latest FSU analysis for more details and a new annotated graph.
>>> FEATURED STOCK ARTICLE : COKE is Showing Real Strength - 5/4/2023 |
View all notes |
Set NEW NOTE alert |
Company Profile |
SEC
News |
Chart |
Request a new note
C
A
S
I |
|
|
|
THESE ARE NOT BUY RECOMMENDATIONS!
Comments contained in the body of this report are technical
opinions only. The material herein has been obtained
from sources believed to be reliable and accurate, however,
its accuracy and completeness cannot be guaranteed.
This site is not an investment advisor, hence it does
not endorse or recommend any securities or other investments.
Any recommendation contained in this report may not
be suitable for all investors and it is not to be deemed
an offer or solicitation on our part with respect to
the purchase or sale of any securities. All trademarks,
service marks and trade names appearing in this report
are the property of their respective owners, and are
likewise used for identification purposes only.
This report is a service available
only to active Paid Premium Members.
You may opt-out of receiving report notifications
at any time. Questions or comments may be submitted
by writing to Premium Membership Services 665 S.E. 10 Street, Suite 201 Deerfield Beach, FL 33441-5634 or by calling 1-800-965-8307
or 954-785-1121.
|
|
|