You are not logged in.
This means you
CAN ONLY VIEW reports that were published prior to Thursday, March 20, 2025.
You
MUST UPGRADE YOUR MEMBERSHIP if you want to see any current reports.
AFTER MARKET UPDATE - THURSDAY, JUNE 1ST, 2023
Previous After Market Report Next After Market Report >>>
|
|
|
|
DOW |
+153.30 |
33,061.57 |
+0.47% |
|
Volume |
1,002,570,795 |
-54% |
|
Volume |
4,630,093,000 |
-24% |
|
NASDAQ |
+165.70 |
13,100.98 |
+1.28% |
|
Advancers |
2,096 |
72% |
|
Advancers |
2,950 |
67% |
|
S&P 500 |
+41.19 |
4,221.02 |
+0.99% |
|
Decliners |
812 |
28% |
|
Decliners |
1,470 |
33% |
|
Russell 2000 |
+18.29 |
1,767.94 |
+1.05% |
|
52 Wk Highs |
24 |
|
|
52 Wk Highs |
83 |
|
|
S&P 600 |
+9.64 |
1,135.58 |
+0.86% |
|
52 Wk Lows |
71 |
|
|
52 Wk Lows |
122 |
|
|
 |
Major Indices Rose With Lighter Volume Totals
Kenneth J. Gruneisen - Passed the CAN SLIM® Master's Exam
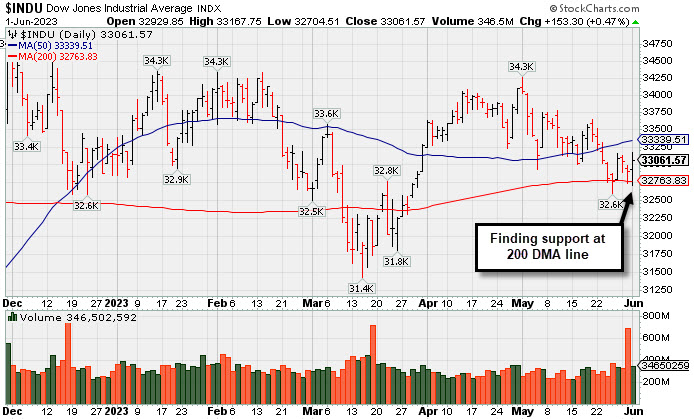
The Dow increased 153 points (0.5%) and S&P 500 increased 1.0% while the Nasdaq Composite climbed 1.3%. Volume totals reported were lighter on the NYSE and on the Nasdaq exchange versus the prior session. Advancers led decliners by more than a 2-1 margin on the NYSE and on the Nasdaq exchange. There were 16 high-ranked companies from the Leaders List that hit a new 52-week high and were listed on the BreakOuts Page versus 15 on the prior session. New 52-week lows totals contracted but still outnumbered new 52-week highs on the NYSE and on the Nasdaq exchange. The major indices are in a confirmed uptrend (M criteria). Appropriate new buying efforts may be considered under the fact-based investment system.
PICTURED: The Dow Jones Industrial Average has been finding support at its 200-day moving average (DMA) line.
Nine of 11 sectors finished in positive territory as U.S. equities rose on Thursday, led by strength of technology companies and optimism on a debt ceiling suspension. Bond yields fell ahead of Friday’s job reports and a Federal Reserve (Fed) speaker indicating a possibility to pause interest rate hikes in the upcoming June meeting. On the data front, initial jobless claims and continuing claims both rose less than expected. The May Institute for Supply Management (ISM) Manufacturing data came in weaker than expected as well showing signs of the economy slowing.
Treasury yields moved lower. The yield on the benchmark 10-year note dropped by four basis points (0.04%) to 3.60%, while the 30-year bond yield declined two basis points (0.02%) to 3.82%. The yield on the two-year note, which is more sensitive to changes in Fed policy, dropped by six basis points (0.06%) to 4.34%. In commodities, West Texas Intermediate (WTI) crude rose 2.9% to $70.05/barrel following optimistic news that the debt ceiling may be suspended and the cautious expectation that the upcoming Organization of Petroleum Exporting Countries and their allies (OPEC+) meeting this weekend may not lead to further supply cuts.
|
 Kenneth J. Gruneisen started out as a licensed stockbroker in August 1987, a couple of months prior to the historic stock market crash that took the Dow Jones Industrial Average down -22.6% in a single day. He has published daily fact-based fundamental and technical analysis on high-ranked stocks online for two decades. Through FACTBASEDINVESTING.COM, Kenneth provides educational articles, news, market commentary, and other information regarding proven investment systems that work in good times and bad.
Comments contained in the body of this report are technical opinions only and are not necessarily those of Gruneisen Growth Corp. The material herein has been obtained from sources believed to be reliable and accurate, however, its accuracy and completeness cannot be guaranteed. Our firm, employees, and customers may effect transactions, including transactions contrary to any recommendation herein, or have positions in the securities mentioned herein or options with respect thereto. Any recommendation contained in this report may not be suitable for all investors and it is not to be deemed an offer or solicitation on our part with respect to the purchase or sale of any securities. |
|
 |
Retail, Financial, Tech, and Commodity-Linked Groups Rose
Kenneth J. Gruneisen - Passed the CAN SLIM® Master's Exam
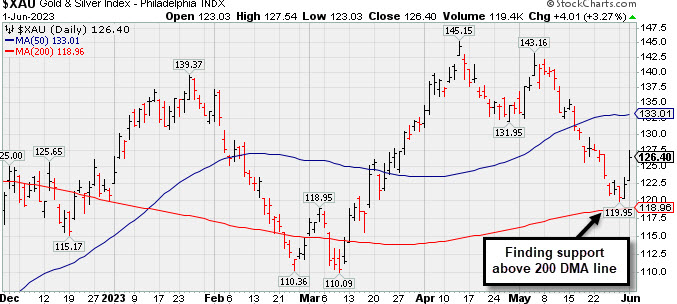
The Retail ($RLX +1.28%), Bank ($BKX +1.61%) and Broker/Dealer ($XBD +0.39%) each posted gains. The tch sector had a positive bias as the Semiconductor ($SOX +1.55%) and Biotech ($BTK +0.91%) both outpaced the Networking($NWX +0.30%). Commodity-linked groups also had a positive bias as the Gold & Silver ($XAU +3.27%) and Oil Services ($OSX +4.00%) both outpaced the Integrated Oil ($XOI +1.17%).
PICTURED: The Gold & Silver Index ($XAU +3.27%) rose for a 2nd consecutive session, finding support above its 200-day moving average (DMA) line.
| Oil Services |
$OSX |
72.07 |
+2.77 |
+4.00% |
-14.06% |
| Integrated Oil |
$XOI |
1,595.15 |
+18.47 |
+1.17% |
-10.75% |
| Semiconductor |
$SOX |
3,506.74 |
+53.56 |
+1.55% |
+38.49% |
| Networking |
$NWX |
793.20 |
+2.39 |
+0.30% |
+1.26% |
| Broker/Dealer |
$XBD |
440.24 |
+1.72 |
+0.39% |
-1.98% |
| Retail |
$RLX |
3,236.87 |
+40.76 |
+1.28% |
+17.53% |
| Gold & Silver |
$XAU |
126.40 |
+4.01 |
+3.27% |
+4.58% |
| Bank |
$BKX |
77.38 |
+1.22 |
+1.61% |
-23.27% |
| Biotech |
$BTK |
5,284.44 |
+47.69 |
+0.91% |
+0.06% |
|
|
|
 |
Extended From Prior Base and Perched Near High
Kenneth J. Gruneisen - Passed the CAN SLIM® Master's Exam
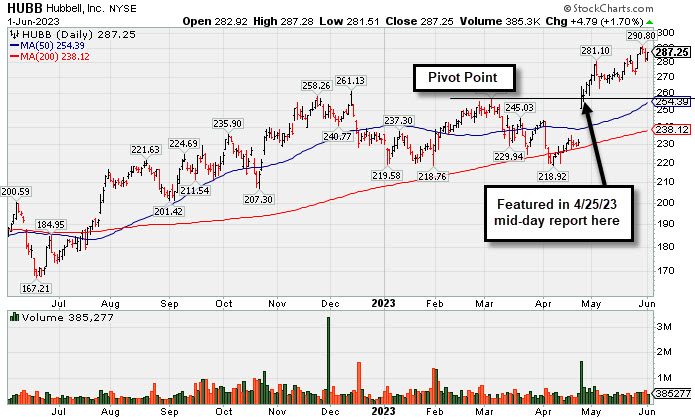
Hubbell (HUBB +$4.79 or +1.70% to $287.25) remains perched near its all-time high, extended from any sound base. Prior highs in the $263 area define initial support to watch on pullbacks.
HUBB was highlighted yellow in the 4/25/23 mid-day report (read here) with pivot point cited based on its 3/06/23 high after a 4-month double bottom base. It was shown in greater detail that evening with an annotated graph under the headline "Gap Up Following Earnings Triggered Technical Buy Signal". Strong action came after it reported strong Mar '23 quarterly earnings +70% on +11% sales revenues over the year-ago period. Its Mar, Jun, Sep, and Dec '22 quarterly earnings increases were above the +25% minimum (C criteria). Annual earnings history (A criteria) had a downturn in FY '20 like many companies during the pandemic. It has a 94 Earnings Per Share Rating, well above the 80+ minimum for buy candidates..The high-ranked Electrical-Power/Equipmt firm has 53.6 million shares outstanding (S criteria) which can contribute to greater price volatility in the event of institutional buying or selling. The number of top-rated funds owning its shares rose from 805 in Jun '22 to 1,335 in Mar '23, a reassuring sign concerning the I criteria. The current Up/Down Volume Ratio of 1.9 is an unbiased indication it has been under accumulation over the past 50 days. It has an A Timeliness Rating and a B Sponsorship Rating.
Symbol/Exchange
Company Name
Industry Group | PRICE | CHANGE
(%Change) | Day High | Volume
(% DAV)
(% 50 day avg vol) | 52 Wk Hi
% From Hi | Featured
Date | Price
Featured | Pivot Featured | | Max Buy |  GPK - NYSE GPK - NYSE
Graphic Packaging Hldg
CONSUMER NON-DURABLES - Packaging and Containers | $24.16 | +0.26
1.09% | $24.31 | 2,868,461
104.53% of 50 DAV
50 DAV is 2,744,200 | $26.16
-7.65%
| 10/25/2022 | $22.75 | PP = $24.17 | | MB = $25.38 | Most Recent Note - 5/31/2023 2:57:11 PM
G - Tested its 4/27/23 low today which defines near term support to watch above its 200 DMA line ($23.14). Volume totals have been below average but it slumped below its 50 DMA line ($25) triggering a technical sell signal during a 7-session losing streak. A rebound above the 50 DMA line is needed for its outlook to improve. Reported Mar '23 quarterly earnings +60% on +9% sales revenues versus the year-ago period.
>>> FEATURED STOCK ARTICLE : Packaging Firm Due to Report Earnings News - 5/1/2023 | View all notes | Set NEW NOTE alert | Company Profile | SEC News | Chart | Request a new note C A S I | STRL - NASDAQ
Sterling Infrastructure
MATERIALS and; CONSTRUCTION - Heavy Construction | $46.44 | +0.37
0.80% | $46.81 | 264,258
111.03% of 50 DAV
50 DAV is 238,000 | $48.44
-4.13%
| 12/14/2022 | $32.41 | PP = $33.72 | | MB = $35.41 | Most Recent Note - 5/31/2023 2:48:36 PM
G - Retreating from its all-time high with above average volume behind today's loss following 9 consecutive gains. Reported Mar '23 quarterly earnings +0% on +10% sales revenues versus the year-ago period, below the +25% minimum earnings guideline (C criteria) raising fundamental concerns.
>>> FEATURED STOCK ARTICLE : 50-Day Moving Average Line Acted as Recent Resistance - 4/28/2023 | View all notes | Set NEW NOTE alert | Company Profile | SEC News | Chart | Request a new note C A S I | FIX - NYSE
Comfort Systems USA
MATERIALS and CONSTRUCTION - General Contractors | $148.38 | +0.40
0.27% | $148.79 | 217,863
78.94% of 50 DAV
50 DAV is 276,000 | $156.19
-5.00%
| 4/27/2023 | $148.85 | PP = $152.23 | | MB = $159.84 | Most Recent Note - 5/30/2023 9:31:21 PM
Y - Still perched near its all-time high. No resistance remains due to overhead supply, however, it has made little headway in recent weeks. Subsequent gains and new highs backed by at least +40% above average volume may help reconfirm a technical buy signal.
>>> FEATURED STOCK ARTICLE : Churning Action While Recently Hovering Near All-Time High - 5/12/2023 | View all notes | Set NEW NOTE alert | Company Profile | SEC News | Chart | Request a new note C A S I | KOF - NYSE
Coca-Cola Femsa ADR
FOOD and BEVERAGE - Beverages - Soft Drinks | $83.45 | +0.63
0.76% | $84.18 | 142,716
71.72% of 50 DAV
50 DAV is 199,000 | $91.23
-8.53%
| 3/7/2023 | $76.63 | PP = $77.11 | | MB = $80.97 | Most Recent Note - 5/30/2023 9:40:04 PM
G - Testing support near its 50 DMA line ($83.94) with higher volume behind today's 6th consecutive loss. More damaging losses would trigger a technical sell signal. Reported Mar '23 quarterly earnings +53% on +24% sales revenues versus the year-ago period. Prior highs in the $79-$77 area define the next support to watch below its 50 DMA line.
>>> FEATURED STOCK ARTICLE : Posted Gain Afrer Reporting Strong Mar '23 Quarterly Results - 5/2/2023 | View all notes | Set NEW NOTE alert | Company Profile | SEC News | Chart | Request a new note C A S I | CLH - NYSE
Clean Harbors
Pollution Control | $143.49 | +3.09
2.20% | $143.55 | 295,102
77.66% of 50 DAV
50 DAV is 380,000 | $147.76
-2.89%
| 3/10/2023 | $136.89 | PP = $136.74 | | MB = $143.58 |  Most Recent Note - 6/1/2023 5:13:37 PM Most Recent Note - 6/1/2023 5:13:37 PM
G - Found support near its 50 DMA line ($140.23) today following a volume-driven loss on the prior session. More damaging losses would raise greater concerns. Reported Mar '23 quarterly earnings +64% on +12% sales revenues versus the year-ago period. Fundamentals remain strong.
>>> FEATURED STOCK ARTICLE : Showed Resilience Near 50-Day Moving Average Following Sell-Off - 5/10/2023 | View all notes | Set NEW NOTE alert | Company Profile | SEC News | Chart | Request a new note C A S I | Symbol/Exchange
Company Name
Industry Group | PRICE | CHANGE
(%Change) | Day High | Volume
(% DAV)
(% 50 day avg vol) | 52 Wk Hi
% From Hi | Featured
Date | Price
Featured | Pivot Featured | | Max Buy | SPSC - NASDAQ
SPS Commerce
COMPUTER SOFTWARE and SERVICES - Application Software | $158.47 | +2.67
1.71% | $159.42 | 157,332
113.19% of 50 DAV
50 DAV is 139,000 | $164.69
-3.78%
| 4/24/2023 | $150.01 | PP = $157.56 | | MB = $165.44 | Most Recent Note - 5/31/2023 2:53:37 PM
Y - Pulling back testing its 50 DMA line ($151.91) today after a "negative reversal" on the prior session when wedging to a new 52-week high. Recent gains above the pivot point were not backed by the +40% above average volume needed to trigger a proper technical buy signal. Reported Mar '23 quarterly earnings +22% on +20% versus the year-ago period, below the +25% minimum earnings guideline (C criteria) raising some fundamental concerns.
>>> FEATURED STOCK ARTICLE : Pulled Back After Quietly Wedging to New Highs - 5/31/2023 | View all notes | Set NEW NOTE alert | Company Profile | SEC News | Chart | Request a new note C A S I | HUBB - NYSE
Hubbell
Electrical-Power/Equipmt | $287.25 | +4.79
1.70% | $287.28 | 385,277
96.32% of 50 DAV
50 DAV is 400,000 | $291.91
-1.60%
| 4/25/2023 | $262.85 | PP = $257.51 | | MB = $270.39 | Most Recent Note - 6/1/2023 5:11:46 PM
G - Perched near its all-time high, extended from the prior base. Prior highs in the $263 area define initial support to watch on pullbacks. Fundamentals remain strong. See the latest FSU analysis for more details and a new annotated graph.
>>> FEATURED STOCK ARTICLE : Extended From Prior Base and Perched Near High - 6/1/2023 | View all notes | Set NEW NOTE alert | Company Profile | SEC News | Chart | Request a new note C A S I | NVR - NYSE
NVR
MATERIALS and CONSTRUCTION - Residential Construction | $5,570.61 | +16.39
0.30% | $5,588.65 | 25,398
110.43% of 50 DAV
50 DAV is 23,000 | $5,986.96
-6.95%
| 4/25/2023 | $5,882.18 | PP = $5,978.25 | | MB = $6,277.16 | Most Recent Note - 5/30/2023 9:44:46 PM
G - Slumped below its 50 DMA line last week raising technical concerns. Reported Mar '23 quarterly earnings -14% on -3% sales revenues versus the year-ago period, below the +25% minimum earnings guideline (C criteria) raising fundamental concerns, and its color code was changed to green. Prior quarterly comparisons were well above the +25% minimum earnings guideline (C criteria). Annual earnings (A criteria) growth has been very strong.
>>> FEATURED STOCK ARTICLE : Fell From High and Raised Concern With Subpar Mar '23 Report - 4/27/2023 | View all notes | Set NEW NOTE alert | Company Profile | SEC News | Chart | Request a new note C A S I | PHM - NYSE
PulteGroup
MATERIALS and CONSTRUCTION - Residential Construction | $67.30 | +1.22
1.85% | $67.38 | 2,132,777
73.77% of 50 DAV
50 DAV is 2,891,000 | $70.54
-4.59%
| 4/25/2023 | $65.17 | PP = $64.01 | | MB = $67.21 | Most Recent Note - 6/1/2023 5:18:43 PM
G - Color code is changed to green after rising back above its "max buy" level. Reported earnings +28% for the Mar '23 quarter versus the year-ago period. Important support to watch is its 50 DMA line ($63.47).
>>> FEATURED STOCK ARTICLE : Recently Rallying to New All-Time Highs - 4/26/2023 | View all notes | Set NEW NOTE alert | Company Profile | SEC News | Chart | Request a new note C A S I | COKE - NASDAQ
Coca-Cola Consolidated
FOOD and BEVERAGE - Beverages - Soft Drinks | $680.24 | +18.50
2.80% | $684.73 | 31,358
95.02% of 50 DAV
50 DAV is 33,000 | $694.20
-2.01%
| 5/4/2023 | $646.66 | PP = $656.21 | | MB = $689.02 | Most Recent Note - 6/1/2023 5:14:58 PM
Y - Posted a gain with average volume today approaching its "max buy" level. Bullish action came after it reported Mar '23 quarterly earnings +93% on +12% sales revenues versus the year-ago period, continuing its strong earnings track record.
>>> FEATURED STOCK ARTICLE : COKE is Showing Real Strength - 5/4/2023 | View all notes | Set NEW NOTE alert | Company Profile | SEC News | Chart | Request a new note C A S I | Symbol/Exchange
Company Name
Industry Group | PRICE | CHANGE
(%Change) | Day High | Volume
(% DAV)
(% 50 day avg vol) | 52 Wk Hi
% From Hi | Featured
Date | Price
Featured | Pivot Featured | | Max Buy | AMPH - NASDAQ
Amphastar Pharm
Medical-Biomed/Biotech | $45.14 | +0.77
1.74% | $45.49 | 480,480
125.45% of 50 DAV
50 DAV is 383,000 | $45.50
-0.79%
| 5/15/2023 | $43.56 | PP = $44.15 | | MB = $46.36 | Most Recent Note - 5/30/2023 9:16:32 PM
Y - Volume totals have been cooling while hovering near its all-time high. Subsequent gains and a strong close above the pivot point backed by at least +40% above average volume may clinch a technical buy signal. Three of the 4 latest quarterly comparisons through Mar '23 versus the year-ago periods have been strong and well above the +25% minimum earnings guideline (C criteria). Annual earnings history (A criteria) has been strong.
>>> FEATURED STOCK ARTICLE : Weak Finish After Early Gain When Perched Near All-Time High - 5/15/2023 | View all notes | Set NEW NOTE alert | Company Profile | SEC News | Chart | Request a new note C A S I | ANET - NYSE
Arista Networks
Computer-Networking | $166.68 | +0.34
0.20% | $167.77 | 3,619,860
112.10% of 50 DAV
50 DAV is 3,229,000 | $178.36
-6.55%
| 5/30/2023 | $176.35 | PP = $171.54 | | MB = $180.12 | Most Recent Note - 5/31/2023 2:50:54 PM
Y - Pulling back today following 4 consecutive volume-driven gains hitting a new high triggering a technical buy signal. Color code was changed to yellow with new pivot point cited based on its 3/23/23 high plus 10 cents in the 5/30/23 mid-day report. Reported Mar '23 quarterly earnings +70% on +54% sales revenues versus the year-ago period and fundamentals remain strong. Found support at its 200 DMA line in recent weeks since dropped from the Featured Stocks list on 5/03/23.
>>> FEATURED STOCK ARTICLE : Technical Sell Signal Triggered by Damaging Volume-Driven Loss - 5/3/2023 | View all notes | Set NEW NOTE alert | Company Profile | SEC News | Chart | Request a new note C A S I |
|
|
|
Color Codes Explained :
Y - Better candidates highlighted by our
staff of experts.
G - Previously featured
in past reports as yellow but may no longer be buyable under the
guidelines.
***Last / Change / Volume data in this table is the closing quote data***
|
|
|
THESE ARE NOT BUY RECOMMENDATIONS!
Comments contained in the body of this report are technical
opinions only. The material herein has been obtained
from sources believed to be reliable and accurate, however,
its accuracy and completeness cannot be guaranteed.
This site is not an investment advisor, hence it does
not endorse or recommend any securities or other investments.
Any recommendation contained in this report may not
be suitable for all investors and it is not to be deemed
an offer or solicitation on our part with respect to
the purchase or sale of any securities. All trademarks,
service marks and trade names appearing in this report
are the property of their respective owners, and are
likewise used for identification purposes only.
This report is a service available
only to active Paid Premium Members.
You may opt-out of receiving report notifications
at any time. Questions or comments may be submitted
by writing to Premium Membership Services 665 S.E. 10 Street, Suite 201 Deerfield Beach, FL 33441-5634 or by calling 1-800-965-8307
or 954-785-1121.
|
|
|