You are not logged in.
This means you
CAN ONLY VIEW reports that were published prior to Thursday, April 17, 2025.
You
MUST UPGRADE YOUR MEMBERSHIP if you want to see any current reports.
AFTER MARKET UPDATE - MONDAY, MARCH 20TH, 2023
Previous After Market Report Next After Market Report >>>
|
|
|
|
DOW |
+382.60 |
32,244.58 |
+1.20% |
|
Volume |
1,228,615,065 |
-69% |
|
Volume |
4,930,889,300 |
-37% |
|
NASDAQ |
+45.02 |
11,675.54 |
+0.39% |
|
Advancers |
1,719 |
59% |
|
Advancers |
2,217 |
49% |
|
S&P 500 |
+34.93 |
3,951.57 |
+0.89% |
|
Decliners |
1,185 |
41% |
|
Decliners |
2,306 |
51% |
|
Russell 2000 |
+19.10 |
1,744.99 |
+1.11% |
|
52 Wk Highs |
21 |
|
|
52 Wk Highs |
39 |
|
|
S&P 600 |
+15.11 |
1,148.99 |
+1.33% |
|
52 Wk Lows |
134 |
|
|
52 Wk Lows |
314 |
|
|
Recent commentaries have noted an ongoing "market correction". No new buying efforts are to be made based on the (M criteria) of the fact-based investment system. Disciplined investors know to reduce market exposure by selling any weakening stocks on a case-by-case basis.
|
 |
Major Averages Posted Gains With Lighter Volume Totals
Kenneth J. Gruneisen - Passed the CAN SLIM® Master's Exam
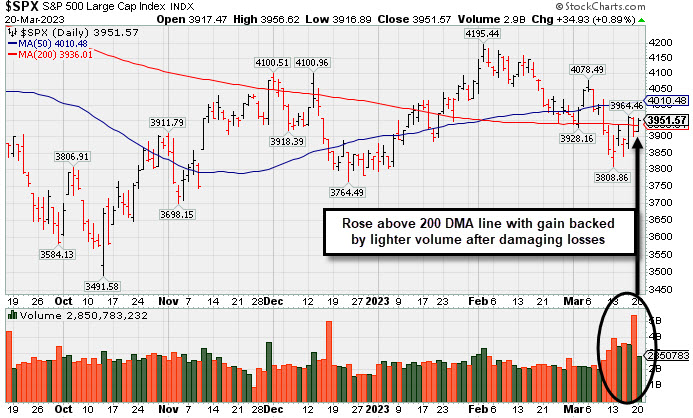
The Dow added 382 points (1.2%), while the technology heavy Nasdaq Composite gained 0.4%. The S&P 500 rose 0.9%. Volume totals were lighter than the prior session on the NYSE and on the Nasdaq exchange, as Friday's totals were inflated by options expirations. Advancers led decliners by almost a 3-2 margin on the NYSE, but decliners slightly outnumbered advancers on the Nasdaq exchange. There were 7 high-ranked companies from the Leaders List that hit a new 52-week high and were listed on the BreakOuts Page, matching the total of 7 on the prior session. New 52-week lows totals contracted yet still soldly outnumbered new 52-week highs totals on the NYSE and on the Nasdaq exchange. The major indices are in a market correction (M criteria). Disciplined investors know that in a market correction it is best to avoid new buying efforts and raise safe cash.
PICTURED: The S&P 500 Index had lighter volume behind a gain as it rose back above its 200-day moving average (DMA) line. Prior lows defines the next important chart support levels to watch as the market correction continues. Disciplined investors are watching for a solid follow-through day to confirm a new uptrend.
All eleven sectors finished in positive territory as U.S. equities closed higher Monday. Market participants grew hopeful that the banking crisis may be easing ahead of the Federal Reserve’s next rate decision on Wednesday. News broke early Monday morning after UBS Group AG (UBS +3.30%) finalized the purchase of Credit Suisse (CS -52.99%) for $3.2 billion, creating the largest deal amongst global banks since the financial crisis. The agreed purchase comes after Credit Suisse’s largest investor, Saudi National Bank, declined to provide further funding. Swiss regulators hope the deal will end the fears of contagion affecting the global banking sector. Elsewhere, the Federal Deposit Insurance Corporation (FDIC) announced an agreement to sell Signature Bank’s deposits to Flagstar, a subsidiary of New York Community Bancorp (NYCB +31.65%).
Treasuries weakened with the yield on the benchmark 10-year note increasing seven basis points (0.07%) to 3.49% while the 30-year bond yield added six basis points (0.06%) to 3.67%. The yield on the two-year, which is more sensitive to changes in monetary policy, note gained ten basis points (0.10%) to 3.95%. In commodities, West Texas Intermediate (WTI) crude increased 1.2% to $67.57/barrel amid market fears. Multiple analysts announced they have trimmed their crude price forecasts for 2023 to an average of $80/barrel during peak summer months and $90/barrel for 2024. In the metals complex, gold increased 0.6% after being boosted from the recent bank crisis, notching the highest level seen during intraday trading since the start of the Russian Ukrainian war.
|
 Kenneth J. Gruneisen started out as a licensed stockbroker in August 1987, a couple of months prior to the historic stock market crash that took the Dow Jones Industrial Average down -22.6% in a single day. He has published daily fact-based fundamental and technical analysis on high-ranked stocks online for two decades. Through FACTBASEDINVESTING.COM, Kenneth provides educational articles, news, market commentary, and other information regarding proven investment systems that work in good times and bad.
Comments contained in the body of this report are technical opinions only and are not necessarily those of Gruneisen Growth Corp. The material herein has been obtained from sources believed to be reliable and accurate, however, its accuracy and completeness cannot be guaranteed. Our firm, employees, and customers may effect transactions, including transactions contrary to any recommendation herein, or have positions in the securities mentioned herein or options with respect thereto. Any recommendation contained in this report may not be suitable for all investors and it is not to be deemed an offer or solicitation on our part with respect to the purchase or sale of any securities. |
|
 |
Financial, Tech, and Commodity-Linked Groups Rose
Kenneth J. Gruneisen - Passed the CAN SLIM® Master's Exam
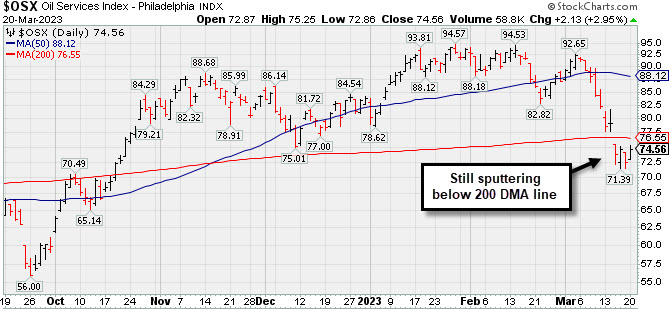
The Bank Index ($BKX +0.78%) and Broker/Dealer Index ($XBD +0.88%) each posted a small gain, meanwhile the Retail Index ($RLX -0.34%) edged lower. The Semiconductor Index ($SOX +1.01%), Networking Index ($NWX +1.11%), and Biotech Index ($BTK +1.16%) each posted gains. Commodity-linked groups also had a positive bias as the Oil Services Index ($OSX +2.95%) and Integrated Oil Index ($XOI +2.04%) both outpaced the Gold & Silver Index ($XAU +1.46%).
PICTURED: The Oil Services Index ($OSX +2.95%) posted a solid gain but remains below its 200-day moving average (DMA) line after an abrupt 2-week slump..
| Oil Services |
$OSX |
74.56 |
+2.13 |
+2.95% |
-11.09% |
| Integrated Oil |
$XOI |
1,625.36 |
+32.48 |
+2.04% |
-9.06% |
| Semiconductor |
$SOX |
3,114.71 |
+31.19 |
+1.01% |
+23.01% |
| Networking |
$NWX |
825.09 |
+9.04 |
+1.11% |
+5.33% |
| Broker/Dealer |
$XBD |
447.16 |
+3.89 |
+0.88% |
-0.44% |
| Retail |
$RLX |
2,868.97 |
-9.75 |
-0.34% |
+4.17% |
| Gold & Silver |
$XAU |
125.67 |
+1.80 |
+1.46% |
+3.98% |
| Bank |
$BKX |
79.42 |
+0.61 |
+0.78% |
-21.25% |
| Biotech |
$BTK |
5,164.50 |
+59.03 |
+1.16% |
-2.21% |
|
|
|
 |
Posting Quiet Gains Just Above 50-Day Moving Average Line
Kenneth J. Gruneisen - Passed the CAN SLIM® Master's Exam
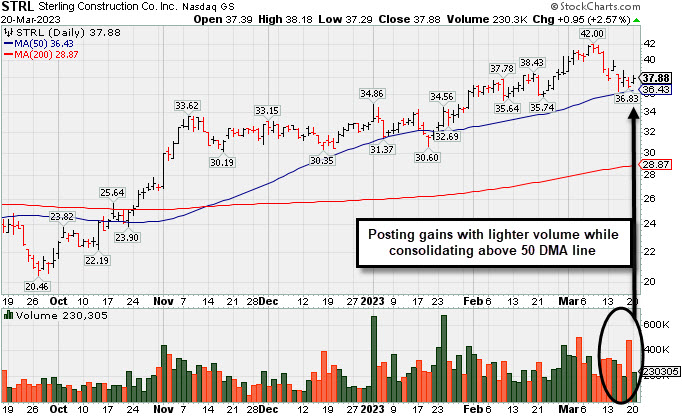
Sterling Infrastructure (STRL+$0.95 or +2.57% to $37.88) posted a gain today with below average volume. It abruptly slumped from its all-time high with recent volume-driven losses. Its 50-day moving average (DMA) line ($36.43) defines initial support above and prior highs in the $34-33 area.
STRL hails from the Building - Heavy Construction industry group which is currently ranked 67th on the 197 Industry Groups list (L criteria). It has a 99 Earnings Per Share Rating. It reported Dec '22 quarterly earnings +74%, its 6th quarterly comparison at or above the +25% minimum earnings guideline (C criteria). Annual earnings (A criteria) growth has been strong and steady since FY '17.
The company has a small supply of only 30.6 million shares outstanding. That can lead to greater price volatility in the event of institutional buying or selling. The number of top rated funds owning its shares rose from 337 in Dec '21 to 354 in Dec '22. Its current Up/Down Volume Ratio of 1.4 is an unbiased indication its shares have been under accumulation over the past 50 days.
|
|
|
Color Codes Explained :
Y - Better candidates highlighted by our
staff of experts.
G - Previously featured
in past reports as yellow but may no longer be buyable under the
guidelines.
***Last / Change / Volume data in this table is the closing quote data***
Symbol/Exchange
Company Name
Industry Group |
PRICE |
CHANGE
(%Change) |
Day High |
Volume
(% DAV)
(% 50 day avg vol) |
52 Wk Hi
% From Hi |
Featured
Date |
Price
Featured |
Pivot Featured |
|
Max Buy |
 GPK
-
NYSE
GPK
-
NYSE
Graphic Packaging
CONSUMER NON-DURABLES - Packaging and Containers
|
$23.61
|
+0.30
1.29% |
$23.76
|
5,581,171
171.57% of 50 DAV
50 DAV is 3,253,000
|
$25.17
-6.20%
|
10/25/2022
|
$22.75
|
PP = $24.17
|
|
MB = $25.38
|
 Most Recent Note - 3/20/2023 12:24:45 PM
Y - Recently sputtering below the noted pivot point and testing support at its 50 DMA line ($23.38). More damaging losses would raise greater concerns and trigger a technical sell signal. Broader market weakness (M criteria) has been noted as a "correction" that has raised concerns.
>>> FEATURED STOCK ARTICLE : Quietly Lingering Near High With Strong Fundamentals - 2/27/2023 |
View all notes |
Set NEW NOTE alert |
Company Profile |
SEC
News |
Chart |
Request a new note
C
A
S
I |
STRL
-
NASDAQ
Sterling Infrastructure
MATERIALS and; CONSTRUCTION - Heavy Construction
|
$37.88
|
+0.95
2.57% |
$38.18
|
230,304
79.42% of 50 DAV
50 DAV is 290,000
|
$42.00
-9.81%
|
12/14/2022
|
$32.41
|
PP = $33.72
|
|
MB = $35.41
|
Most Recent Note - 3/20/2023 5:29:17 PM
G - Posted a gain today with below-average volume. Abruptly slumped last week from near its all-time high toward its 50 DMA line ($36.43) which defines important near-term support to watch. See the latest FSU analysis for more details and a new annotated graph.
>>> FEATURED STOCK ARTICLE : Posting Quiet Gains Just Above 50-Day Moving Average Line - 3/20/2023 |
View all notes |
Set NEW NOTE alert |
Company Profile |
SEC
News |
Chart |
Request a new note
C
A
S
I |
PERI
-
NASDAQ
Perion Network
Comml Svcs-Advertising
|
$35.19
|
-0.31
-0.87% |
$35.71
|
1,125,856
149.12% of 50 DAV
50 DAV is 755,000
|
$37.18
-5.35%
|
1/25/2023
|
$31.79
|
PP = $33.19
|
|
MB = $34.85
|
Most Recent Note - 3/20/2023
G - Volume totals have been cooling while hovering near the new all-time high and its color code is changed to green after wedging back above its "max buy" level. Consolidating above its 50 DMA line ($32.82) and the prior high ($33) which define important near-term support.
>>> FEATURED STOCK ARTICLE : Consolidating in an Orderly Manner Above Old High and 50 DMA Line - 3/15/2023 |
View all notes |
Set NEW NOTE alert |
Company Profile |
SEC
News |
Chart |
Request a new note
C
A
S
I |
ALGM
-
NASDAQ
Allegro MicroSystems
Elec-Semiconductor Mfg
|
$46.56
|
+1.46
3.24% |
$46.79
|
1,626,403
99.84% of 50 DAV
50 DAV is 1,629,000
|
$47.67
-2.33%
|
1/31/2023
|
$37.80
|
PP = $38.38
|
|
MB = $40.30
|
Most Recent Note - 3/20/2023 5:30:42 PM
G - Posted a solid gain today with average volume for a best-ever close. It is extended from the previously noted base. Its 50 DMA line ($40.31) and prior high in the $38 area define important support to watch on pullbacks.
>>> FEATURED STOCK ARTICLE : Holding its Ground After Rallying From Previously Noted Base - 3/1/2023 |
View all notes |
Set NEW NOTE alert |
Company Profile |
SEC
News |
Chart |
Request a new note
C
A
S
I |
FIX
-
NYSE
Comfort Systems USA
MATERIALS and CONSTRUCTION - General Contractors
|
$139.15
|
+4.72
3.51% |
$139.95
|
289,569
115.37% of 50 DAV
50 DAV is 251,000
|
$152.13
-8.53%
|
2/23/2023
|
$136.52
|
PP = $128.78
|
|
MB = $135.22
|
Most Recent Note - 3/20/2023 5:34:21 PM
G - Posted a solid gain today. The prior high in the $128 area and its 50 DMA line ($128.59) coincide defining important support to watch. Fundamentals remain strong.
>>> FEATURED STOCK ARTICLE : Consolidating Above Support at Prior High and 50-Day Moving Average - 3/16/2023 |
View all notes |
Set NEW NOTE alert |
Company Profile |
SEC
News |
Chart |
Request a new note
C
A
S
I |
Symbol/Exchange
Company Name
Industry Group |
PRICE |
CHANGE
(%Change) |
Day High |
Volume
(% DAV)
(% 50 day avg vol) |
52 Wk Hi
% From Hi |
Featured
Date |
Price
Featured |
Pivot Featured |
|
Max Buy |
KOF
-
NYSE
Coca-Cola Femsa ADR
FOOD and BEVERAGE - Beverages - Soft Drinks
|
$75.72
|
+1.10
1.47% |
$76.13
|
66,592
39.17% of 50 DAV
50 DAV is 170,000
|
$79.16
-4.35%
|
3/7/2023
|
$76.63
|
PP = $77.11
|
|
MB = $80.97
|
Most Recent Note - 3/20/2023 5:36:02 PM
Y - Posted another gain today with very light volume. Highlighted in yellow with pivot point cited based on its 1/24/23 high plus 10 cents in the 3/07/23 mid-day report. Gains above the pivot point must be backed by at least +40% above average volume to trigger a proper technical buy signal.
>>> FEATURED STOCK ARTICLE : Mexican Coke Bottler Hits New Multi-Year High - 3/7/2023 |
View all notes |
Set NEW NOTE alert |
Company Profile |
SEC
News |
Chart |
Request a new note
C
A
S
I |
ANET
-
NYSE
Arista Networks
Computer-Networking
|
$164.20
|
+0.94
0.58% |
$165.25
|
2,743,596
109.70% of 50 DAV
50 DAV is 2,501,000
|
$164.26
-0.04%
|
3/8/2023
|
$147.59
|
PP = $148.67
|
|
MB = $156.10
|
Most Recent Note - 3/20/2023 5:38:28 PM
G - Color code is changed to green after rising further above its "max buy" level and hitting another new all-time high with today's additional volume-driven gain. Broader market weakness (M criteria) has been noted as a "correction" that has raised concerns.
>>> FEATURED STOCK ARTICLE : Arista Challenging All-Time High - 3/8/2023 |
View all notes |
Set NEW NOTE alert |
Company Profile |
SEC
News |
Chart |
Request a new note
C
A
S
I |
CLH
-
NYSE
Clean Harbors
Pollution Control
|
$135.02
|
+0.70
0.52% |
$136.59
|
313,600
79.80% of 50 DAV
50 DAV is 393,000
|
$140.69
-4.03%
|
3/10/2023
|
$136.89
|
PP = $136.74
|
|
MB = $143.58
|
Most Recent Note - 3/20/2023 5:32:28 PM
Y - Posted a small gain today with light volume after a noted spurt of volume-driven losses. Fundamentals remain strong. Its 50 DMA line ($130.37) defines important near-term support to watch.
>>> FEATURED STOCK ARTICLE : Pullback to Support Marked Secondary Buy Point; Market Concerns Rose - 3/10/2023 |
View all notes |
Set NEW NOTE alert |
Company Profile |
SEC
News |
Chart |
Request a new note
C
A
S
I |
|
|
|
THESE ARE NOT BUY RECOMMENDATIONS!
Comments contained in the body of this report are technical
opinions only. The material herein has been obtained
from sources believed to be reliable and accurate, however,
its accuracy and completeness cannot be guaranteed.
This site is not an investment advisor, hence it does
not endorse or recommend any securities or other investments.
Any recommendation contained in this report may not
be suitable for all investors and it is not to be deemed
an offer or solicitation on our part with respect to
the purchase or sale of any securities. All trademarks,
service marks and trade names appearing in this report
are the property of their respective owners, and are
likewise used for identification purposes only.
This report is a service available
only to active Paid Premium Members.
You may opt-out of receiving report notifications
at any time. Questions or comments may be submitted
by writing to Premium Membership Services 665 S.E. 10 Street, Suite 201 Deerfield Beach, FL 33441-5634 or by calling 1-800-965-8307
or 954-785-1121.
|
|
|


 X
X