You are not logged in.
This means you
CAN ONLY VIEW reports that were published prior to Thursday, March 20, 2025.
You
MUST UPGRADE YOUR MEMBERSHIP if you want to see any current reports.
AFTER MARKET UPDATE - WEDNESDAY, MAY 3RD, 2023
Previous After Market Report Next After Market Report >>>
|
|
|
|
DOW |
-270.29 |
33,414.24 |
-0.80% |
|
Volume |
1,003,412,600 |
+3% |
|
Volume |
5,732,170,800 |
+3% |
|
NASDAQ |
-55.18 |
12,025.33 |
-0.46% |
|
Advancers |
1,041 |
36% |
|
Advancers |
2,148 |
49% |
|
S&P 500 |
-28.83 |
4,090.75 |
-0.70% |
|
Decliners |
1,829 |
64% |
|
Decliners |
2,245 |
51% |
|
Russell 2000 |
+7.17 |
1,739.28 |
+0.41% |
|
52 Wk Highs |
75 |
|
|
52 Wk Highs |
78 |
|
|
S&P 600 |
+0.27 |
1,126.02 |
+0.02% |
|
52 Wk Lows |
100 |
|
|
52 Wk Lows |
278 |
|
|
 |
Major Averages Fell Again With Higher Volume Totals
Kenneth J. Gruneisen - Passed the CAN SLIM® Master's Exam
The Dow lost 270 points (0.8%), while the Nasdaq Composite shed 0.5% and the S&P 500 declined 0.7%. Volume totals reported were higher than the prior session on the NYSE and on the Nasdaq exchange, indicative of increasing institutional selling pressure. Decliners led advancers by a 9-5 margin on the NYSE and by a narrow margin on the Nasdaq exchange. There were 53 high-ranked companies from the Leaders List that hit a new 52-week high and were listed on the BreakOuts Page, versus the total of 18 on the prior session. New 52-week lows outnumbered improving new highs totals on the NYSE and on the Nasdaq exchange.The major indices are in an uptrend under pressure (M criteria). Appropriate new buying efforts may be considered under the fact-based investment system.
PICTURED: The S&P 500 Index pulled back for a 3rd consecutive loss after challenging its February high.
All 11 sectors ended in negative territory as U.S. equities finished lower Wednesday. The Federal Reserve (Fed) announced another widely expected quarter point (0.25%) rate hike, bringing them to a 16-year high amid a strong labor market. The committee softened its language about future rate increases by dropping its March statement that said, "the Committee anticipates that some additional policy firming may be appropriate". Fed Chair Jerome Powell stated June’s decision will be driven primarily by incoming data and the effects from cumulative monetary tightening.
On the data front, the Mortgage Bankers Association mortgage applications for the week ended April 28 saw a 1.2% decline, reversing from the prior week’s surge of 3.7%, despite the 30-year mortgage rate falling for the first time in three weeks. Meanwhile, April’s finalized S&P Global U.S. Composite Purchasing Managers’ Index (PMI) ticked higher to 53.4, up from March’s 52.3 reading to its highest level since May 2022 and its fourth consecutive month of expansion. April’s Institute of Supply Management (ISM) Services Index came in slightly higher than estimated at 51.9 potentially signaling modest demand for services continues to grow. Treasuries strengthened, with the yield on the benchmark 10-year note falling eight basis points (0.08%) to 3.35%, while the yield on the 30-year bond shed four basis points (0.04%) to 3.67%. The yield on the two-year note declined 12 basis points (0.12%) to 3.86%. In commodities, West Texas Intermediate (WTI) crude dropped 4.8% to $68.20/barrel extending Tuesday’s loss. |
 Kenneth J. Gruneisen started out as a licensed stockbroker in August 1987, a couple of months prior to the historic stock market crash that took the Dow Jones Industrial Average down -22.6% in a single day. He has published daily fact-based fundamental and technical analysis on high-ranked stocks online for two decades. Through FACTBASEDINVESTING.COM, Kenneth provides educational articles, news, market commentary, and other information regarding proven investment systems that work in good times and bad.
Comments contained in the body of this report are technical opinions only and are not necessarily those of Gruneisen Growth Corp. The material herein has been obtained from sources believed to be reliable and accurate, however, its accuracy and completeness cannot be guaranteed. Our firm, employees, and customers may effect transactions, including transactions contrary to any recommendation herein, or have positions in the securities mentioned herein or options with respect thereto. Any recommendation contained in this report may not be suitable for all investors and it is not to be deemed an offer or solicitation on our part with respect to the purchase or sale of any securities. |
|
 |
Semiconductor, Financial, and Energy-Linked Groups Fell
Kenneth J. Gruneisen - Passed the CAN SLIM® Master's Exam
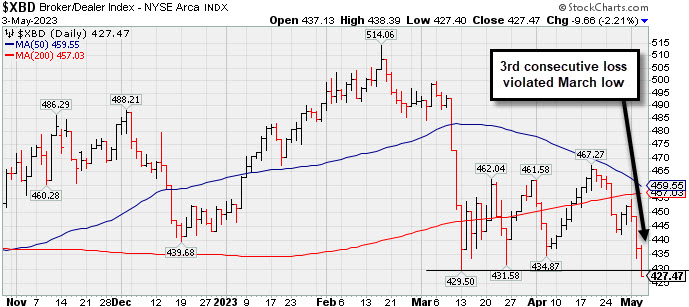
Financials continued to create a drag on the major averages as the Broker/Dealer Index ($XBD -2.21%) and Bank Index ($BKX -1.89%) both lost ground. The Semiconductor Index ($SOX -1.32%) led the tech sector lower while the Networking Index ($NWX -0.54%) posted a smaller loss and the Biotech Index ($BTK -0.05%) finished flat. The Retail Index ($RLX -0.19%) edged lower. The Oil Services Index ($OSX -1.25%) and Integrated Oil Index ($XOI -2.23%) both lost ground while the Gold & Silver Index ($XAU +0.19%) eked out a small gain.
PICTURED: The Broker/Dealer Index ($XBD -2.21%) recently slumped back below its 200 DMA line after meeting resistance near its 50 DMA line. It suffered a 3rd consecutive loss on Wednesday as it violated the March low raising greater concerns.
| Oil Services |
$OSX |
73.02 |
-0.92 |
-1.25% |
-12.93% |
| Integrated Oil |
$XOI |
1,625.95 |
-37.02 |
-2.23% |
-9.03% |
| Semiconductor |
$SOX |
2,957.37 |
-39.48 |
-1.32% |
+16.79% |
| Networking |
$NWX |
738.38 |
-4.02 |
-0.54% |
-5.74% |
| Broker/Dealer |
$XBD |
427.47 |
-9.66 |
-2.21% |
-4.82% |
| Retail |
$RLX |
3,010.57 |
-5.76 |
-0.19% |
+9.32% |
| Gold & Silver |
$XAU |
137.84 |
+0.27 |
+0.19% |
+14.05% |
| Bank |
$BKX |
74.82 |
-1.44 |
-1.89% |
-25.81% |
| Biotech |
$BTK |
5,213.03 |
-2.62 |
-0.05% |
-1.29% |
|
|
|
 |
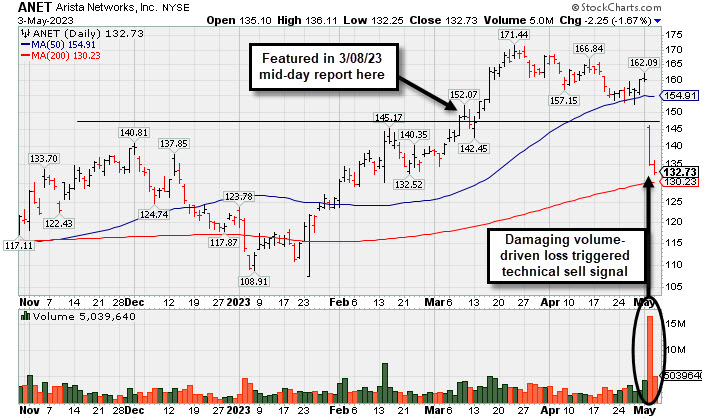
Technical Sell Signal Triggered by Damaging Volume-Driven Loss
Kenneth J. Gruneisen - Passed the CAN SLIM® Master's Exam
Arista Networks Inc (ANET -$2.25 or -1.67% to $132.73) slumped further today, closing -22.6% off its 52-week high, and it will be dropped from the Featured Stocks list tonight. It gapped down on the prior session violating its 50-day moving average (DMA) line ($154.91) with a damaging volume-driven loss triggering a noted technical sell signal and its color code was changed to green. Weak action came after it reported Mar '23 quarterly earnings +70% on +54% sales revenues versus the year-ago period but gave conservative guidance going forward.
ANET currently has a 98 Earnings Per Share Rating. It has shown 6 consecutive quarterly comparisons with strong and steady above the +25% minimum earnings guideline (C criteria). Annual earnings (A criteria) had a downturn in FY '20 like many companies during the pandemic.
The number of top-rated funds owning its shares rose from 1,758 in Dec '21 to 2,151 in Mar '23, a reassuring sign concerning the I criteria. Its current Up/Down Volume Ratio of 1.0 is an unbiased indication its shares have been neutral concerning accumulation/distribution over the past 50 days. The high-ranked Computer - Networking firm has a Timeliness Rating of A and a Sponsorship Rating of C. Its small supply of 245.1 million shares (S criteria) in the public float may contribute to greater volatility in the event of institutional buying or selling.
|
|
|
Color Codes Explained :
Y - Better candidates highlighted by our
staff of experts.
G - Previously featured
in past reports as yellow but may no longer be buyable under the
guidelines.
***Last / Change / Volume data in this table is the closing quote data***
Symbol/Exchange
Company Name
Industry Group |
PRICE |
CHANGE
(%Change) |
Day High |
Volume
(% DAV)
(% 50 day avg vol) |
52 Wk Hi
% From Hi |
Featured
Date |
Price
Featured |
Pivot Featured |
|
Max Buy |
 GPK
-
NYSE
GPK
-
NYSE
Graphic Packaging
CONSUMER NON-DURABLES - Packaging and Containers
|
$25.10
|
-0.31
-1.22% |
$26.11
|
4,361,495
143.28% of 50 DAV
50 DAV is 3,044,000
|
$25.62
-2.03%
|
10/25/2022
|
$22.75
|
PP = $24.17
|
|
MB = $25.38
|
Most Recent Note - 5/2/2023 12:35:36 PM
Y - Gapped up today then reversed into the red. Reported Mar '23 quarterly earnings +60% versus the year-ago period. Volume and volatility often increase near earnings news. Rebounded above its 50 DMA line ($24.41) last week helping its outlook improve. It is perched just -4.8% below its all-time high. Recent gains lacked great volume conviction. See the latest FSU analysis for more details and a new annotated graph.
>>> FEATURED STOCK ARTICLE : Packaging Firm Due to Report Earnings News - 5/1/2023 |
View all notes |
Set NEW NOTE alert |
Company Profile |
SEC
News |
Chart |
Request a new note
C
A
S
I |
STRL
-
NASDAQ
Sterling Infrastructure
MATERIALS and; CONSTRUCTION - Heavy Construction
|
$42.00
|
+1.74
4.32% |
$43.05
|
524,336
208.90% of 50 DAV
50 DAV is 251,000
|
$42.00
0.00%
|
12/14/2022
|
$32.41
|
PP = $33.72
|
|
MB = $35.41
|
 Most Recent Note - 5/3/2023 12:39:58 PM
G - Hitting a new all-time high with today's 5th consecutive gain backed by ever-increasing volume. Rebound above the 50 DMA line ($37.91) on the prior session helped its technical stance improve. Reported Mar '23 quarterly earnings +0% on +10% sales revenues versus the year-ago period, below the +25% minimum earnings guideline (C criteria) raising fundamental concerns. Volume and volatility often increase near earnings news.
>>> FEATURED STOCK ARTICLE : 50-Day Moving Average Line Acted as Recent Resistance - 4/28/2023 |
View all notes |
Set NEW NOTE alert |
Company Profile |
SEC
News |
Chart |
Request a new note
C
A
S
I |
PERI
-
NASDAQ
Perion Network
Comml Svcs-Advertising
|
$33.93
|
-1.07
-3.06% |
$38.02
|
1,565,264
218.92% of 50 DAV
50 DAV is 715,000
|
$42.75
-20.63%
|
1/25/2023
|
$31.79
|
PP = $33.19
|
|
MB = $34.85
|
Most Recent Note - 5/3/2023 10:04:15 AM
G - Reported Mar '23 quarterly earnings +36% versus the year-ago period. Gapped up today but quickly slumped back below its 50 DMA line ($36.88). A convincing rebound and close above the 50 DMA line is needed to help its outlook improve.
>>> FEATURED STOCK ARTICLE : Perion Pulls Back Toward 50-Day Moving Average Line - 4/20/2023 |
View all notes |
Set NEW NOTE alert |
Company Profile |
SEC
News |
Chart |
Request a new note
C
A
S
I |
FIX
-
NYSE
Comfort Systems USA
MATERIALS and CONSTRUCTION - General Contractors
|
$149.70
|
-0.60
-0.40% |
$153.90
|
380,141
122.63% of 50 DAV
50 DAV is 310,000
|
$152.49
-1.83%
|
4/27/2023
|
$148.85
|
PP = $152.23
|
|
MB = $159.84
|
Most Recent Note - 5/2/2023 6:26:14 PM
Y - Posted a gain today with near-average volume. Bullish action came after it reported Mar '23 quarterly earnings +66% on +33% sales revenues versus the year-ago period. Powered above its 50 DMA line ($139.34) with a considerable gain backed by twice its average volume. Its color code was changed to yellow with pivot point cited based on its 3/03/23 high plus 10 cents. Very little resistance remains due to overhead supply up to the $152 level. A gain and new high backed by at least +40% above average volume may trigger a technical buy signal.
>>> FEATURED STOCK ARTICLE : Consolidating Near 50-Day Moving Average and -10.5% off High - 4/21/2023 |
View all notes |
Set NEW NOTE alert |
Company Profile |
SEC
News |
Chart |
Request a new note
C
A
S
I |
KOF
-
NYSE
Coca-Cola Femsa ADR
FOOD and BEVERAGE - Beverages - Soft Drinks
|
$85.91
|
+1.32
1.56% |
$86.74
|
205,580
108.77% of 50 DAV
50 DAV is 189,000
|
$85.61
0.35%
|
3/7/2023
|
$76.63
|
PP = $77.11
|
|
MB = $80.97
|
Most Recent Note - 5/2/2023 6:32:12 PM
G - Rebounded near its all-time high with today's gain backed by near-average volume. Reported Mar '23 quarterly earnings +53% on +24% sales revenues versus the year-ago period. On pullbacks, prior highs in the $79-$77 area define initial support to watch along with its 50 DMA line ($78.88). See the latest FSU analysis for more details and a new annotated graph.
>>> FEATURED STOCK ARTICLE : Posted Gain Afrer Reporting Strong Mar '23 Quarterly Results - 5/2/2023 |
View all notes |
Set NEW NOTE alert |
Company Profile |
SEC
News |
Chart |
Request a new note
C
A
S
I |
Symbol/Exchange
Company Name
Industry Group |
PRICE |
CHANGE
(%Change) |
Day High |
Volume
(% DAV)
(% 50 day avg vol) |
52 Wk Hi
% From Hi |
Featured
Date |
Price
Featured |
Pivot Featured |
|
Max Buy |
ANET
-
NYSE
Arista Networks
Computer-Networking
|
$132.73
|
-2.25
-1.67% |
$136.11
|
5,041,696
180.06% of 50 DAV
50 DAV is 2,800,000
|
$171.44
-22.58%
|
4/24/2023
|
$156.56
|
PP = $171.54
|
|
MB = $180.12
|
Most Recent Note - 5/3/2023 6:07:32 PM
It will be dropped from the Featured Stocks list tonight after slumping further today. Gapped down on the prior session violating its 50 DMA line ($155) with a damaging volume-driven loss triggering a technical sell signal and its color code was changed to green. Weak action came after it reported Mar '23 quarterly earnings +70% on +54% sales revenues versus the year-ago period but gave conservative guidance going forward.
>>> FEATURED STOCK ARTICLE : Technical Sell Signal Triggered by Damaging Volume-Driven Loss - 5/3/2023 |
View all notes |
Set NEW NOTE alert |
Company Profile |
SEC
News |
Chart |
Request a new note
C
A
S
I |
CLH
-
NYSE
Clean Harbors
Pollution Control
|
$137.51
|
-8.55
-5.85% |
$144.69
|
1,519,837
352.63% of 50 DAV
50 DAV is 431,000
|
$147.76
-6.94%
|
3/10/2023
|
$136.89
|
PP = $136.74
|
|
MB = $143.58
|
Most Recent Note - 5/3/2023 12:20:17 PM
G - Reported Mar '23 quarterly earnings +64% versus the year-ago period. Volume and volatility often increase near earnings news. Recovered a lot after early weakness today violated its 50 DMA line ($137.67) with a big loss triggering a technical sell signal. Recently wedged up above its "max buy" level with gains backed by lackluster volume, not action considered indicative of fresh institutional buying demand. Fundamentals remain strong.
>>> FEATURED STOCK ARTICLE : Wedged to a New High Close Above "Max Buy" Level - 4/19/2023 |
View all notes |
Set NEW NOTE alert |
Company Profile |
SEC
News |
Chart |
Request a new note
C
A
S
I |
MTRN
-
NYSE
Materion
METALS and MINING - Industrial Metals and Minerals
|
$118.11
|
+11.30
10.58% |
$121.29
|
178,075
163.37% of 50 DAV
50 DAV is 109,000
|
$119.75
-1.37%
|
4/18/2023
|
$114.52
|
PP = $118.30
|
|
MB = $124.22
|
Most Recent Note - 5/3/2023 10:02:02 AM
Y - Gapped up today rebounding above its 50 DMA line ($111) and its color code is changed to yellow while quickly reaching a new all-time high with a considerable volume-driven gain. A gain and a strong close above the pivot point backed by at least +40% above average volume may trigger a proper technical buy signal. Reported Mar '23 quarterly earnings +13% versus the year-ago period, below the +25% minimum guideline (C criteria). Volume and volatility often increase near earnings news.
>>> FEATURED STOCK ARTICLE : Encountered Distributional Pressure When Poised for Breakout - 4/18/2023 |
View all notes |
Set NEW NOTE alert |
Company Profile |
SEC
News |
Chart |
Request a new note
C
A
S
I |
SPSC
-
NASDAQ
SPS Commerce
COMPUTER SOFTWARE and SERVICES - Application Software
|
$152.49
|
+0.78
0.51% |
$156.09
|
222,491
146.38% of 50 DAV
50 DAV is 152,000
|
$157.46
-3.16%
|
4/24/2023
|
$150.01
|
PP = $157.56
|
|
MB = $165.44
|
Most Recent Note - 5/2/2023 11:32:03 AM
G - Rebounded near its 50 DMA line ($148.15) which has acted as resistance. Highlighted in yellow with new pivot point cited based on its 2/15/23 high plus 10 cents in the 4/24/23 mid-day report. Subsequent gains above the pivot point backed by at least +40% above average volume may trigger a technical buy signal. Reported Mar '23 quarterly earnings +22% on +20% versus the year-ago period raising some fundamental concerns. Volume and volatility often increase near earnings news.
>>> FEATURED STOCK ARTICLE : Sputtered While Perched in Striking Distance of 52-Week HIgh - 4/24/2023 |
View all notes |
Set NEW NOTE alert |
Company Profile |
SEC
News |
Chart |
Request a new note
C
A
S
I |
HUBB
-
NYSE
Hubbell
Electrical-Power/Equipmt
|
$273.27
|
-6.51
-2.33% |
$282.19
|
538,838
131.75% of 50 DAV
50 DAV is 409,000
|
$280.22
-2.48%
|
4/25/2023
|
$262.85
|
PP = $257.51
|
|
MB = $270.39
|
Most Recent Note - 5/2/2023 6:29:36 PM
G - Posted a 7th consecutive gain today hitting a new high above its "max buy" level with volume +73% above average and its color code is changed to green. Bullish action came after its strong Mar '23 quarterly results. Prior highs in the $263 area define initial support to watch on pullbacks.
>>> FEATURED STOCK ARTICLE : Gap Up Following Earnings Triggered Technical Buy Signal - 4/25/2023 |
View all notes |
Set NEW NOTE alert |
Company Profile |
SEC
News |
Chart |
Request a new note
C
A
S
I |
Symbol/Exchange
Company Name
Industry Group |
PRICE |
CHANGE
(%Change) |
Day High |
Volume
(% DAV)
(% 50 day avg vol) |
52 Wk Hi
% From Hi |
Featured
Date |
Price
Featured |
Pivot Featured |
|
Max Buy |
NVR
-
NYSE
NVR Inc
MATERIALS and CONSTRUCTION - Residential Construction
|
$5,894.82
|
+8.26
0.14% |
$5,985.48
|
30,757
133.73% of 50 DAV
50 DAV is 23,000
|
$5,986.96
-1.54%
|
4/25/2023
|
$5,882.18
|
PP = $5,978.25
|
|
MB = $6,277.16
|
Most Recent Note - 5/3/2023 10:08:59 AM
G - Still perched near its all-time high with today's 5th consecutive gain. Reported Mar '23 quarterly earnings -14% on -3% sales revenues versus the year-ago period, below the +25% minimum earnings guideline (C criteria) raising fundamental concerns, and its color code was changed to green. Confirming gains and a close above the pivot point backed by at least +40% above average volume may clinch a proper technical buy signal. Prior quarterly comparisons were well above the +25% minimum earnings guideline (C criteria). Annual earnings (A criteria) growth has been very strong.
>>> FEATURED STOCK ARTICLE : Fell From High and Raised Concern With Subpar Mar '23 Report - 4/27/2023 |
View all notes |
Set NEW NOTE alert |
Company Profile |
SEC
News |
Chart |
Request a new note
C
A
S
I |
PHM
-
NYSE
PulteGroup
MATERIALS and CONSTRUCTION - Residential Construction
|
$66.49
|
+0.72
1.09% |
$67.21
|
4,046,415
137.91% of 50 DAV
50 DAV is 2,934,000
|
$67.40
-1.35%
|
4/25/2023
|
$65.17
|
PP = $64.01
|
|
MB = $67.21
|
Most Recent Note - 5/3/2023 10:07:19 AM
Y - Churning above-average volume for the past week yet it remains perched near its all-time high and "max buy" level. Highlighted in yellow with pivot point cited based on its May 2021 high in the 4/25/23 mid-day report. Bullish action came after it reported earnings +28% for the Mar '23 quarter versus the year-ago period. Prior highs in the $64-60 area define initial support to watch above its 50 DMA line ($58.26).
>>> FEATURED STOCK ARTICLE : Recently Rallying to New All-Time Highs - 4/26/2023 |
View all notes |
Set NEW NOTE alert |
Company Profile |
SEC
News |
Chart |
Request a new note
C
A
S
I |
|
|
|
THESE ARE NOT BUY RECOMMENDATIONS!
Comments contained in the body of this report are technical
opinions only. The material herein has been obtained
from sources believed to be reliable and accurate, however,
its accuracy and completeness cannot be guaranteed.
This site is not an investment advisor, hence it does
not endorse or recommend any securities or other investments.
Any recommendation contained in this report may not
be suitable for all investors and it is not to be deemed
an offer or solicitation on our part with respect to
the purchase or sale of any securities. All trademarks,
service marks and trade names appearing in this report
are the property of their respective owners, and are
likewise used for identification purposes only.
This report is a service available
only to active Paid Premium Members.
You may opt-out of receiving report notifications
at any time. Questions or comments may be submitted
by writing to Premium Membership Services 665 S.E. 10 Street, Suite 201 Deerfield Beach, FL 33441-5634 or by calling 1-800-965-8307
or 954-785-1121.
|
|
|