You are not logged in.
This means you
CAN ONLY VIEW reports that were published prior to Monday, March 31, 2025.
You
MUST UPGRADE YOUR MEMBERSHIP if you want to see any current reports.
AFTER MARKET UPDATE - THURSDAY, JANUARY 26TH, 2023
Previous After Market Report Next After Market Report >>>
|
|
|
|
DOW |
+205.57 |
33,949.41 |
+0.61% |
|
Volume |
780,915,330 |
+1% |
|
Volume |
5,708,215,200 |
+4% |
|
NASDAQ |
+199.06 |
11,512.41 |
+1.76% |
|
Advancers |
2,061 |
69% |
|
Advancers |
2,685 |
59% |
|
S&P 500 |
+44.21 |
4,060.43 |
+1.10% |
|
Decliners |
912 |
31% |
|
Decliners |
1,834 |
41% |
|
Russell 2000 |
+12.75 |
1,903.06 |
+0.67% |
|
52 Wk Highs |
117 |
|
|
52 Wk Highs |
122 |
|
|
S&P 600 |
+8.57 |
1,244.14 |
+0.69% |
|
52 Wk Lows |
11 |
|
|
52 Wk Lows |
42 |
|
|
 |
Leadership Expands as Indices Rise With Higher Volume Totals
Kenneth J. Gruneisen - Passed the CAN SLIM® Master's Exam
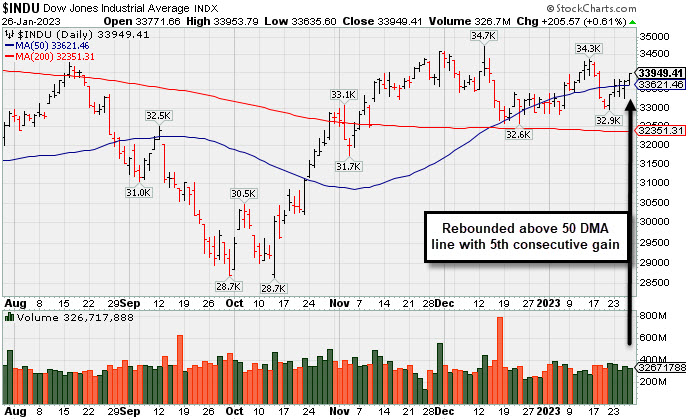
The Dow added 205 points, while the Nasdaq Composite climbed 1.8%. The S&P 500 advanced 1.1% with 10 of 11 sectors finishing in positive territory. Volume totals were higher than the prior session on the NYSE and on the Nasdaq exchange, indicative of an increase in institutional buying demand. Breadth was solidly positive as advancers led decliners by a 2-1 margin on the NYSE and a 3-2 margin on the Nasdaq exchange. Leadership improved as there were 39 high-ranked companies from the Leaders List that hit new 52-week highs and were listed on the BreakOuts Page versus the total of 18 on the prior session. New 52-week highs totals expanded and solidly outnumbered new 52-week lows on both the NYSE and the Nasdaq exchange. The major indices are in a confirmed uptrend (M criteria). Disciplined investors have a green light for making new buys only in stocks matching all key criteria of the fact-based investment system.
PICTURED: The Dow Jones Industrial Average rose back above its 50-day moving average line with a 5th consecutive gain. The Blue Chip index is now perched only -8.13% off its record high hit on 1/06/22.
U.S. equities finished higher Thursday as investors weighed a rally in mega-cap technology shares against a mixed Gross Domestic Product (GDP) report. The U.S. preliminary fourth-quarter GDP reading showed the economy grew at a faster-than-forecasted 2.9% pace, demonstrating continued resilience in the economy. However, the personal consumption component of the report painted a more downbeat picture, coming in at 2.1%, a slower pace than expected. The core Personal Consumption Expenditures (PCE) price index, the Federal Reserve’s (Fed) preferred proxy for inflation, eased in the fourth quarter to 3.9% from 4.7%.
Elsewhere on the data front, initial jobless claims for the week ended January 21 unexpectedly fell, signaling a still-tight labor market. Wholesale inventories missed expectations, climbing just 0.1% month-over-month in December, while retail inventories notched a 0.5% monthly gain. Durable goods orders climbed 5.6% in December after falling 1.7% in the prior month, and capital goods orders fell 0.2%. New home sales unexpectedly climbed 2.3% month-over-month in December, and while the Chicago Fed’s and Kansas City Fed’s gauges of economic activity showed slight improvement, they remained in contractionary territory. Treasuries weakened, with the yield on the 10-year note up four basis points (0.04%) to 3.49%, while the 30-year bond yield climbed three basis points (0.03%) to 3.63%. The yield on the two-year note advanced six basis points (0.06%) to 4.19%. In commodities, West Texas Intermediate (WTI) crude added 1.1% to $81.02/barrel amid renewed optimism over a boost in global oil demand.
|
 Kenneth J. Gruneisen started out as a licensed stockbroker in August 1987, a couple of months prior to the historic stock market crash that took the Dow Jones Industrial Average down -22.6% in a single day. He has published daily fact-based fundamental and technical analysis on high-ranked stocks online for two decades. Through FACTBASEDINVESTING.COM, Kenneth provides educational articles, news, market commentary, and other information regarding proven investment systems that work in good times and bad.
Comments contained in the body of this report are technical opinions only and are not necessarily those of Gruneisen Growth Corp. The material herein has been obtained from sources believed to be reliable and accurate, however, its accuracy and completeness cannot be guaranteed. Our firm, employees, and customers may effect transactions, including transactions contrary to any recommendation herein, or have positions in the securities mentioned herein or options with respect thereto. Any recommendation contained in this report may not be suitable for all investors and it is not to be deemed an offer or solicitation on our part with respect to the purchase or sale of any securities. |
|
 |
Energy-Linked Groups Outpaced Retail, Financial, and Tech Gains
Kenneth J. Gruneisen - Passed the CAN SLIM® Master's Exam
The Retail Index ($RLX +0.83%) Bank Index ($BKX +0.98%) both posted small gains while the Broker/Dealer Index ($XBD +0.18%) also inched higher. The tech sector had a positive bias as Semiconductor Index ($SOX +1.63%), Networking Index ($NWX +0.87%), and Biotech Index ($BTK +0.61%) finished unanimouslyu higher. Commodity-linked groups were mixed as the Oil Services Index ($OSX +1.45%) and Integrated Oil Index ($XOI +3.12%) posted gains while the Gold & Silver Index ($XAU -1.63%) fell.
PICTURED: The Networking Index ($NWX +0.87%) is consolidating above its 50-day and 200-day moving average (DMA) lines.
| Oil Services |
$OSX |
93.94 |
+1.34 |
+1.45% |
+12.02% |
| Integrated Oil |
$XOI |
1,941.31 |
+58.78 |
+3.12% |
+8.62% |
| Semiconductor |
$SOX |
2,966.60 |
+47.61 |
+1.63% |
+17.16% |
| Networking |
$NWX |
816.68 |
+7.05 |
+0.87% |
+4.26% |
| Broker/Dealer |
$XBD |
487.76 |
+0.88 |
+0.18% |
+8.60% |
| Retail |
$RLX |
2,999.99 |
+24.84 |
+0.83% |
+8.93% |
| Gold & Silver |
$XAU |
136.89 |
-2.27 |
-1.63% |
+13.26% |
| Bank |
$BKX |
111.46 |
+1.09 |
+0.98% |
+10.52% |
| Biotech |
$BTK |
5,590.50 |
+33.78 |
+0.61% |
+5.86% |
|
|
|
 |
Gain With Average Volume While Perched Near Recent Highs
Kenneth J. Gruneisen - Passed the CAN SLIM® Master's Exam
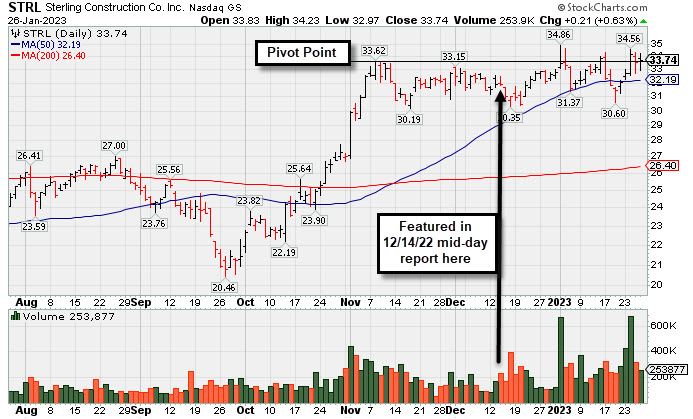
Sterling Infrastructure (STRL +$0.21 or +0.63% to $33.74) posted a gain today with +14% above average volume and finished 2 cents above the previously cited pivot point. The 50-day moving average (DMA) line ($32.19) and recent low ($30.60 on 1/19/23) define near-term support levels to watch following its recently noted failed breakout attempt.
STRL was highlighted in yellow with pivot point cited based on its 11/08/22 high plus 10 cents in the 12/14/22 mid-day report (read here). Confirming volume-driven gains for a new high would be a reassuring sign of fresh institutional buying demand. STRL was last covered in detail on 1/09/23 with an annotated graph under the headline, "Finding Support Near 50-Day Moving Average After Failed Breakout Attempt".
STRL hails from the Building - Heavy Construction industry group which is currently ranked 36th on the 197 Industry Groups list (L criteria). It has a 96 Earnings Per Share Rating. It reported Sep '22 quarterly earnings +35% on +20% sales revenues versus the year ago period, its 5th quarterly comparison at or above the +25% minimum earnings guideline (C criteria). Annual earnings (A criteria) growth has been strong and steady since FY '17.
The company has a small supply of only 30.3 million shares outstanding. That can lead to greater price volatility in the event of institutional buying or selling. The number of top rated funds owning its shares rose from 337 in Dec '21 to 343 in Dec '22. Its current Up/Down Volume Ratio of 1.1 is an unbiased indication its shares have been under slight accumulation over the past 50 days.
|
|
|
Color Codes Explained :
Y - Better candidates highlighted by our
staff of experts.
G - Previously featured
in past reports as yellow but may no longer be buyable under the
guidelines.
***Last / Change / Volume data in this table is the closing quote data***
Symbol/Exchange
Company Name
Industry Group |
PRICE |
CHANGE
(%Change) |
Day High |
Volume
(% DAV)
(% 50 day avg vol) |
52 Wk Hi
% From Hi |
Featured
Date |
Price
Featured |
Pivot Featured |
|
Max Buy |
 CMC
-
NYSE
CMC
-
NYSE
Commercial Metals Co
METALS and MINING - Steel and Iron
|
$55.34
|
+2.13
4.00% |
$55.38
|
953,701
91.44% of 50 DAV
50 DAV is 1,043,000
|
$56.88
-2.71%
|
10/14/2022
|
$41.61
|
PP = $44.45
|
|
MB = $46.67
|
 Most Recent Note - 1/26/2023 5:41:25 PM
G - Posted a 2nd consecutive big gain today and finished near the session high but with lighter volume. Its 50 DMA line ($49.81) defines important near-term support to watch on pullbacks. Fundamentals remain strong.
>>> FEATURED STOCK ARTICLE : Pulling Back After Rallying From 50-Day Moving Average Line - 1/18/2023 |
View all notes |
Set NEW NOTE alert |
Company Profile |
SEC
News |
Chart |
Request a new note
C
A
S
I |
GPK
-
NYSE
Graphic Packaging Hldg
CONSUMER NON-DURABLES - Packaging and Containers
|
$23.78
|
+0.36
1.54% |
$23.90
|
3,492,717
118.45% of 50 DAV
50 DAV is 2,948,600
|
$24.07
-1.20%
|
10/25/2022
|
$22.75
|
PP = $24.17
|
|
MB = $25.38
|
Most Recent Note - 1/26/2023 5:46:27 PM
Y - Posted a 5th consecutive gain today approaching prior highs. Faces very little resistance due to overhead supply up to the $24 level. Subsequent gains above the pivot point backed by at least +40% above average volume may trigger a technical buy signal.
>>> FEATURED STOCK ARTICLE : Found Support at 200-Day Moving Average and Still Faces Resistance - 1/10/2023 |
View all notes |
Set NEW NOTE alert |
Company Profile |
SEC
News |
Chart |
Request a new note
C
A
S
I |
GFF
-
NYSE
Griffon Corporation
MATERIALS and CONSTRUCTION - General Building Materials
|
$39.81
|
+0.28
0.71% |
$40.18
|
279,444
57.50% of 50 DAV
50 DAV is 486,000
|
$40.74
-2.28%
|
11/10/2022
|
$34.13
|
PP = $35.02
|
|
MB = $36.77
|
Most Recent Note - 1/26/2023 5:44:19 PM
G - Perched near its 52-week high following today's 4th consecutive small gain with below average volume. Its 50 DMA line ($36.25) defines near-term support above recent lows in the $33.82 area. Reported Sep '22 quarterly earnings +230% on +24% sales revenues versus the year ago period.
>>> FEATURED STOCK ARTICLE : Showed Resilience Following Negative Reversal at 52-Week High - 1/19/2023 |
View all notes |
Set NEW NOTE alert |
Company Profile |
SEC
News |
Chart |
Request a new note
C
A
S
I |
CPRX
-
NASDAQ
Catalyst Pharma Inc
Medical-Biomed/Biotech
|
$15.99
|
-0.74
-4.42% |
$16.98
|
2,882,300
100.92% of 50 DAV
50 DAV is 2,856,000
|
$22.11
-27.68%
|
11/22/2022
|
$17.38
|
PP = $16.66
|
|
MB = $17.49
|
Most Recent Note - 1/26/2023 5:42:28 PM
G - Pulled back today with average volume. A prompt rebound above the 50 DMA line ($17.70) is needed for its outlook to improve.
>>> FEATURED STOCK ARTICLE : Decisive Sell Signal Triggered by Considerable Loss on Heavy Volume - 1/23/2023 |
View all notes |
Set NEW NOTE alert |
Company Profile |
SEC
News |
Chart |
Request a new note
C
A
S
I |
TITN
-
NASDAQ
Titan Machinery Inc
SPECIALTY RETAIL
|
$42.59
|
+0.92
2.21% |
$42.75
|
209,239
87.18% of 50 DAV
50 DAV is 240,000
|
$44.35
-3.97%
|
1/13/2023
|
$40.10
|
PP = $44.45
|
|
MB = $46.67
|
Most Recent Note - 1/26/2023 5:48:33 PM
Y - Posted a 5th consecutive gain today with near average volume. The prior high in the $38 area defines important support to watch along with its 50 DMA line ($39.24)..A new pivot point was recently cited based on its 12/01/22 high plus 10 cents.
>>> FEATURED STOCK ARTICLE : Forming New Base for Past 7 Weeks - 1/13/2023 |
View all notes |
Set NEW NOTE alert |
Company Profile |
SEC
News |
Chart |
Request a new note
C
A
S
I |
Symbol/Exchange
Company Name
Industry Group |
PRICE |
CHANGE
(%Change) |
Day High |
Volume
(% DAV)
(% 50 day avg vol) |
52 Wk Hi
% From Hi |
Featured
Date |
Price
Featured |
Pivot Featured |
|
Max Buy |
MYE
-
NYSE
Myers Industries Inc
Containers/Packaging
|
$23.99
|
+0.58
2.48% |
$24.02
|
74,468
44.86% of 50 DAV
50 DAV is 166,000
|
$25.55
-6.11%
|
12/8/2022
|
$23.94
|
PP = $25.65
|
|
MB = $26.93
|
Most Recent Note - 1/26/2023 5:47:32 PM
Y - Found support on the prior session while testing support at its 50 DMA line ($23.02). Faces little resistance due to overhead supply up to the $25.50 level.
>>> FEATURED STOCK ARTICLE : Myers Quietly Consolidating Within Striking Distance of Prior High - 1/20/2023 |
View all notes |
Set NEW NOTE alert |
Company Profile |
SEC
News |
Chart |
Request a new note
C
A
S
I |
BOX
-
NYSE
Box Inc Cl A
Computer Sftwr-Database
|
$31.95
|
+0.45
1.43% |
$31.96
|
689,172
52.21% of 50 DAV
50 DAV is 1,320,000
|
$33.04
-3.30%
|
12/12/2022
|
$29.83
|
PP = $29.57
|
|
MB = $31.05
|
Most Recent Note - 1/26/2023 5:49:56 PM
Y - Posted another gain today with light volume while challenging prior highs in the $31-32 area. Its 50 DMA line ($29.81) defines important near-term support to watch. Faces very little resistance due to overhead supply up to the $32 level. Quarterly and annual earnings increases have been strong and steady.
>>> FEATURED STOCK ARTICLE : Perched Above "Max Buy" Level Near Recent Highs - 1/24/2023 |
View all notes |
Set NEW NOTE alert |
Company Profile |
SEC
News |
Chart |
Request a new note
C
A
S
I |
STRL
-
NASDAQ
Sterling Infrastructure
MATERIALS and; CONSTRUCTION - Heavy Construction
|
$33.74
|
+0.21
0.63% |
$34.23
|
253,877
114.88% of 50 DAV
50 DAV is 221,000
|
$34.86
-3.21%
|
12/14/2022
|
$32.41
|
PP = $33.72
|
|
MB = $35.41
|
Most Recent Note - 1/26/2023 5:34:04 PM
Y - Posted a gain today with +14% above average volume and closed 2 cents above the previously cited pivot point. The 50 DMA line ($32.19) and recent low ($30.60 on 1/19/23) define near-term support levels to watch following its recently noted failed breakout attempt. Highlighted in yellow with pivot point cited based on its 11/08/22 high plus 10 cents in the 12/14/22 mid-day report. Confirming volume-driven gains for a new high would be a reassuring sign of fresh institutional buying demand. See the latest FSU analysis for more details and a new annotated graph.
>>> FEATURED STOCK ARTICLE : Gain With Average Volume While Perched Near Recent Highs - 1/26/2023 |
View all notes |
Set NEW NOTE alert |
Company Profile |
SEC
News |
Chart |
Request a new note
C
A
S
I |
PERI
-
NASDAQ
Perion Networks Ltd
Comml Svcs-Advertising
|
$32.21
|
-0.29
-0.89% |
$32.77
|
533,211
121.46% of 50 DAV
50 DAV is 439,000
|
$32.78
-1.74%
|
1/25/2023
|
$31.79
|
PP = $33.19
|
|
MB = $34.85
|
Most Recent Note - 1/26/2023 5:51:45 PM
Y - Paused today after 4 consecutive gains marked by above average volume challenging the Nov '21 high in the $33 area. Its pivot point cited was based upon its 11/15/21 high plus 10 cents. Subsequent gains above the pivot point backed by at least +40% above average volume may trigger a technical buy signal. Found support near its 50 DMA line since noted in the 12/06/22 mid-day report. Reported Sep '22 quarterly earnings +53% on +31% sales revenues versus the year ago period. Prior quarterly earnings history (C criteria) has been above the +25% minimum. Annual earnings (A criteria) history has been improving steadily after a downturn from FY '15-18. See the latest FSU analysis for more details and an annotated graph.
>>> FEATURED STOCK ARTICLE : Spurt of Volume-Driven Gains Challenging Prior High - 1/25/2023 |
View all notes |
Set NEW NOTE alert |
Company Profile |
SEC
News |
Chart |
Request a new note
C
A
S
I |
|
|
|
THESE ARE NOT BUY RECOMMENDATIONS!
Comments contained in the body of this report are technical
opinions only. The material herein has been obtained
from sources believed to be reliable and accurate, however,
its accuracy and completeness cannot be guaranteed.
This site is not an investment advisor, hence it does
not endorse or recommend any securities or other investments.
Any recommendation contained in this report may not
be suitable for all investors and it is not to be deemed
an offer or solicitation on our part with respect to
the purchase or sale of any securities. All trademarks,
service marks and trade names appearing in this report
are the property of their respective owners, and are
likewise used for identification purposes only.
This report is a service available
only to active Paid Premium Members.
You may opt-out of receiving report notifications
at any time. Questions or comments may be submitted
by writing to Premium Membership Services 665 S.E. 10 Street, Suite 201 Deerfield Beach, FL 33441-5634 or by calling 1-800-965-8307
or 954-785-1121.
|
|
|