You are not logged in.
This means you
CAN ONLY VIEW reports that were published prior to Sunday, February 2, 2025.
You
MUST UPGRADE YOUR MEMBERSHIP if you want to see any current reports.
AFTER MARKET UPDATE - FRIDAY, APRIL 28TH, 2023
Previous After Market Report Next After Market Report >>>
|
|
|
|
DOW |
+272.00 |
34,098.16 |
+0.80% |
|
Volume |
1,060,467,328 |
+29% |
|
Volume |
5,370,815,000 |
+2% |
|
NASDAQ |
+84.35 |
12,226.58 |
+0.69% |
|
Advancers |
2,133 |
73% |
|
Advancers |
2,799 |
63% |
|
S&P 500 |
+34.13 |
4,169.48 |
+0.83% |
|
Decliners |
781 |
27% |
|
Decliners |
1,610 |
37% |
|
Russell 2000 |
+17.76 |
1,768.99 |
+1.01% |
|
52 Wk Highs |
64 |
|
|
52 Wk Highs |
71 |
|
|
S&P 600 |
+11.39 |
1,148.17 |
+1.00% |
|
52 Wk Lows |
34 |
|
|
52 Wk Lows |
155 |
|
|
 |
Leadership Improved and Breadth Positive as Indices Rose
Kenneth J. Gruneisen - Passed the CAN SLIM® Master's Exam
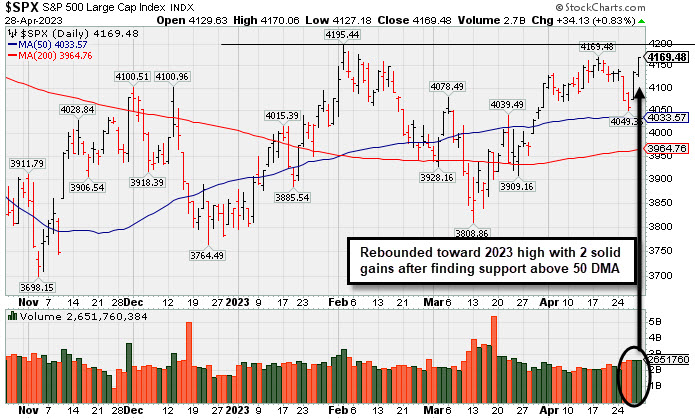
The Dow added 272 points (0.8%), while the Nasdaq Composite climbed 0.7% and the S&P 500 advanced 0.8%. For the week, the major averages finished in positive territory. For April, the Dow and S&P 500 notched monthly gains while the Nasdaq Composite finished just above the flat line. Volume totals reported on Friday were higher than the prior session on the NYSE and on the Nasdaq exchange, indicative of an increase in institutional buying demand. Breadth was positive as advancers led decliners by almost a 3-1 margin on the NYSE and by a 7-4 margin on the Nasdaq exchange. Leadership improved as there were 36 high-ranked companies from the Leaders List that hit a new 52-week high and were listed on the BreakOuts Page, versus the total of 20 on the prior session. New 52-week lows totals contracted but still outnumbered new 52-week highs totals on the NYSE and on the Nasdaq exchange.The major indices are in an uptrend under pressure (M criteria). Appropriate new buying efforts may be considered under the fact-based investment system.
PICTURED: The S&P 500 Index rebounded toward its 2023 high with 2 solid gains after finding support above its 50-day moving average (DMA) line.
Nine of 11 sectors finished in positive territory as U.S. equities rose on Friday. Investors digested a slew of corporate earnings and looked ahead to next week’s Federal Reserve (Fed) meeting. The Personal Consumption Expenditures (PCE) Deflator, which is the Fed’s preferred proxy for inflation, eased from February’s print to come in at 4.2% year-over-year in March. On a monthly basis, the PCE Deflator eased from 0.3% month-over-month to 0.1%. Meanwhile, the core PCE Deflator (which excludes the more volatile food and energy prices) came in at 4.6% year-over-year and 0.3% month-over-month. The real personal spending portion of the report was flat, suggesting consumers are being more cautious and are cutting back on purchases. The Employment Cost Index, the Fed’s preferred measure of wage inflation, accelerated in the first quarter.
The latest inflation data has added support to the expectation the Fed will raise interest rates at their meeting next week. Treasuries strengthened, with the yield on the benchmark 10-year note down eight basis points (0.08%) to 3.44%, while the 30-year bond yield shed eight basis points (0.08%) to 3.67%. The yield on the two-year note, which is more sensitive to changes in Fed policy, fell three basis points (0.03%) to 4.04%. In commodities, West Texas Intermediate (WTI) crude climbed 2.6% to $76.67/barrel amid signs of rising domestic demand.
|
 Kenneth J. Gruneisen started out as a licensed stockbroker in August 1987, a couple of months prior to the historic stock market crash that took the Dow Jones Industrial Average down -22.6% in a single day. He has published daily fact-based fundamental and technical analysis on high-ranked stocks online for two decades. Through FACTBASEDINVESTING.COM, Kenneth provides educational articles, news, market commentary, and other information regarding proven investment systems that work in good times and bad.
Comments contained in the body of this report are technical opinions only and are not necessarily those of Gruneisen Growth Corp. The material herein has been obtained from sources believed to be reliable and accurate, however, its accuracy and completeness cannot be guaranteed. Our firm, employees, and customers may effect transactions, including transactions contrary to any recommendation herein, or have positions in the securities mentioned herein or options with respect thereto. Any recommendation contained in this report may not be suitable for all investors and it is not to be deemed an offer or solicitation on our part with respect to the purchase or sale of any securities. |
|
 |
Financial, Tech, and Energy-Linked Groups Rose
Kenneth J. Gruneisen - Passed the CAN SLIM® Master's Exam
Financial stocks had a positive bias as the Bank Index ($BKX +1.49%) outpaced the Broker/Dealer Index ($XBD +0.62%), meanwhile, the Retail Index ($RLX -1.56%) pulled back and created a drag on the major averages. The tech sector had a positive bias as the Semiconductor Index ($SOX +1.81%), Networking Index ($NWX +1.65%), and Biotech Index ($BTK +1.43%) posted unanimous gains. Commodity-linked groups were mixed as the Oil Services Index ($OSX +1.54%) and Integrated Oil Index ($XOI +1.76%) both posted solid gains while the Gold & Silver Index ($XAU -0.46%) edged lower.
PICTURED: The Retail Index ($RLX -1.56%) is consolidating above its 200-day moving average (DMA) line.
| Oil Services |
$OSX |
78.41 |
+1.19 |
+1.54% |
-6.50% |
| Integrated Oil |
$XOI |
1,754.39 |
+30.26 |
+1.76% |
-1.84% |
| Semiconductor |
$SOX |
2,994.97 |
+53.38 |
+1.81% |
+18.28% |
| Networking |
$NWX |
768.95 |
+12.49 |
+1.65% |
-1.83% |
| Broker/Dealer |
$XBD |
452.17 |
+2.78 |
+0.62% |
+0.68% |
| Retail |
$RLX |
3,058.83 |
-48.34 |
-1.56% |
+11.07% |
| Gold & Silver |
$XAU |
133.98 |
-0.62 |
-0.46% |
+10.86% |
| Bank |
$BKX |
81.28 |
+1.19 |
+1.49% |
-19.41% |
| Biotech |
$BTK |
5,259.60 |
+74.06 |
+1.43% |
-0.41% |
|
|
|
 |
50-Day Moving Average Line Acted as Recent Resistance
Kenneth J. Gruneisen - Passed the CAN SLIM® Master's Exam
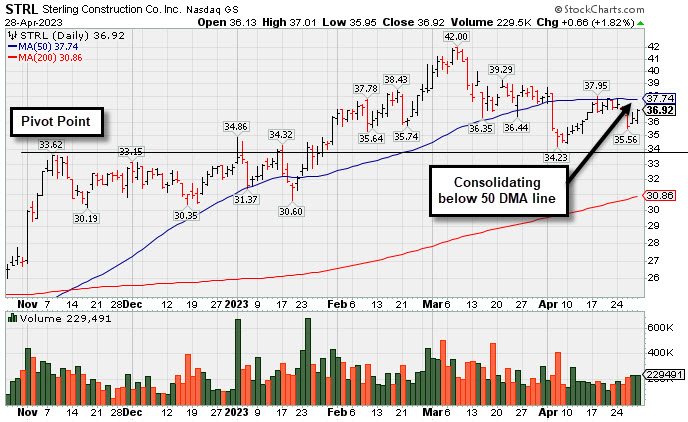
Sterling Infrastructure (STRL +$0.66 or +1.82% to $36.92) slumped again after recently meeting resistance at its 50-day moving average (DMA) line ($37.74). A rebound above the 50 DMA line is needed for its outlook to improve. Keep in mind it is due to report Mar '23 quarterly results on 5/01/23. Volume and volatility often increase near earnings news.
STRL hails from the Building - Heavy Construction industry group which is currently ranked 88th on the 197 Industry Groups list (L criteria). It has a 99 Earnings Per Share Rating. It reported Dec '22 quarterly earnings +74% on 26% sales revenues versus the year ago period, its 6th quarterly comparison at or above the +25% minimum earnings guideline (C criteria). Annual earnings (A criteria) growth has been strong and steady since FY '17.
The company has a small supply of only 30.6 million shares outstanding. That can lead to greater price volatility in the event of institutional buying or selling. The number of top rated funds owning its shares rose from 337 in Dec '21 to 377 in Mar '23. Its current Up/Down Volume Ratio of 1.2 is an unbiased indication its shares have been under accumulation over the past 50 days.
|
|
|
Color Codes Explained :
Y - Better candidates highlighted by our
staff of experts.
G - Previously featured
in past reports as yellow but may no longer be buyable under the
guidelines.
***Last / Change / Volume data in this table is the closing quote data***
Symbol/Exchange
Company Name
Industry Group |
PRICE |
CHANGE
(%Change) |
Day High |
Volume
(% DAV)
(% 50 day avg vol) |
52 Wk Hi
% From Hi |
Featured
Date |
Price
Featured |
Pivot Featured |
|
Max Buy |
 GPK
-
NYSE
GPK
-
NYSE
Graphic Packaging
CONSUMER NON-DURABLES - Packaging and Containers
|
$24.66
|
+0.40
1.65% |
$24.73
|
2,303,872
80.98% of 50 DAV
50 DAV is 2,845,000
|
$25.62
-3.75%
|
10/25/2022
|
$22.75
|
PP = $24.17
|
|
MB = $25.38
|
 Most Recent Note - 4/28/2023 3:09:11 PM
Y - Color code is changed to yellow after rebounding above its 50 DMA line ($24.37) helping its outlook improve. It is perched just -3.7% below its all-time high. Recent gains lacked great volume conviction.
>>> FEATURED STOCK ARTICLE : Quietly Consolidating Just Below "Max Buy" Level - 4/10/2023 |
View all notes |
Set NEW NOTE alert |
Company Profile |
SEC
News |
Chart |
Request a new note
C
A
S
I |
STRL
-
NASDAQ
Sterling Infrastructure
MATERIALS and; CONSTRUCTION - Heavy Construction
|
$36.92
|
+0.66
1.82% |
$37.01
|
229,491
94.44% of 50 DAV
50 DAV is 243,000
|
$42.00
-12.10%
|
12/14/2022
|
$32.41
|
PP = $33.72
|
|
MB = $35.41
|
Most Recent Note - 4/28/2023 4:51:52 PM
G - Posted a 2nd consecutive gain today with below-average volume. Met resistance at its 50 DMA line recently, and a rebound above the 50 DMA line ($37.74) is needed for its outlook to improve. Due to report Mar '23 quarterly results on 5/01/23. Volume and volatility often increase near earnings news. See the latest FSU analysis for more details and a new annotated graph.
>>> FEATURED STOCK ARTICLE : 50-Day Moving Average Line Acted as Recent Resistance - 4/28/2023 |
View all notes |
Set NEW NOTE alert |
Company Profile |
SEC
News |
Chart |
Request a new note
C
A
S
I |
PERI
-
NASDAQ
Perion Network
Comml Svcs-Advertising
|
$35.03
|
-0.27
-0.76% |
$35.59
|
530,533
73.48% of 50 DAV
50 DAV is 722,000
|
$42.75
-18.06%
|
1/25/2023
|
$31.79
|
PP = $33.19
|
|
MB = $34.85
|
Most Recent Note - 4/28/2023 3:12:43 PM
G - Volume totals have been cooling while remaining below its 50 DMA line ($36.75) after damaging volume-driven losses triggered a technical sell signal. A rebound above the 50 DMA line is needed to help its outlook improve.
>>> FEATURED STOCK ARTICLE : Perion Pulls Back Toward 50-Day Moving Average Line - 4/20/2023 |
View all notes |
Set NEW NOTE alert |
Company Profile |
SEC
News |
Chart |
Request a new note
C
A
S
I |
FIX
-
NYSE
Comfort Systems USA
MATERIALS and CONSTRUCTION - General Contractors
|
$149.49
|
+0.64
0.43% |
$150.94
|
333,837
108.74% of 50 DAV
50 DAV is 307,000
|
$152.13
-1.74%
|
4/27/2023
|
$148.85
|
PP = $152.23
|
|
MB = $159.84
|
Most Recent Note - 4/27/2023 5:25:35 PM
Y - Bullish action came today after it reported Mar '23 quarterly earnings +66% on +33% sales revenues versus the year-ago period. Powered above its 50 DMA liner ($138) with a considerable gain backed by twice its average volume. Its color code is changed to yellow with pivot point cited based on its 3/03/23 high plus 10 cents. Very little resistance remains due to overhead supply up to the $152 level. A gain and new high backed by at least +40% above average volume may trigger a technical buy signal.
>>> FEATURED STOCK ARTICLE : Consolidating Near 50-Day Moving Average and -10.5% off High - 4/21/2023 |
View all notes |
Set NEW NOTE alert |
Company Profile |
SEC
News |
Chart |
Request a new note
C
A
S
I |
KOF
-
NYSE
Coca-Cola Femsa ADR
FOOD and BEVERAGE - Beverages - Soft Drinks
|
$84.42
|
+2.16
2.63% |
$84.66
|
158,618
83.92% of 50 DAV
50 DAV is 189,000
|
$85.61
-1.39%
|
3/7/2023
|
$76.63
|
PP = $77.11
|
|
MB = $80.97
|
Most Recent Note - 4/28/2023 3:10:59 PM
G - Rebounding near its all-time high with today's quiet gain. It is extended from the prior base. On pullbacks, prior highs in the $79-$77 area define initial support to watch along with its 50 DMA line ($78.34).
>>> FEATURED STOCK ARTICLE : Streak of 11 Straight Gains into New High Territory - 4/12/2023 |
View all notes |
Set NEW NOTE alert |
Company Profile |
SEC
News |
Chart |
Request a new note
C
A
S
I |
Symbol/Exchange
Company Name
Industry Group |
PRICE |
CHANGE
(%Change) |
Day High |
Volume
(% DAV)
(% 50 day avg vol) |
52 Wk Hi
% From Hi |
Featured
Date |
Price
Featured |
Pivot Featured |
|
Max Buy |
ANET
-
NYSE
Arista Networks
Computer-Networking
|
$160.16
|
+3.40
2.17% |
$160.28
|
2,384,882
96.20% of 50 DAV
50 DAV is 2,479,000
|
$171.44
-6.58%
|
4/24/2023
|
$156.56
|
PP = $171.54
|
|
MB = $180.12
|
Most Recent Note - 4/26/2023 12:08:25 PM
Y - Finding support above its 50 DMA line ($154) with today's gain. Color code was changed to yellow with new pivot point cited based on its 3/23/23 high plus 10 cents. Subsequent gains above the pivot point backed by at least +40% above average volume may trigger a new (or add-on) technical buy signal. The 50 DMA line defines important support to watch above prior highs in the $148-145 area.
>>> FEATURED STOCK ARTICLE : Near High With Volume Cooling Following Volume-Driven Gains - 4/17/2023 |
View all notes |
Set NEW NOTE alert |
Company Profile |
SEC
News |
Chart |
Request a new note
C
A
S
I |
CLH
-
NYSE
Clean Harbors
Pollution Control
|
$145.16
|
+0.90
0.62% |
$145.76
|
204,385
47.20% of 50 DAV
50 DAV is 433,000
|
$146.05
-0.61%
|
3/10/2023
|
$136.89
|
PP = $136.74
|
|
MB = $143.58
|
Most Recent Note - 4/28/2023 3:14:19 PM
G - Volume is light behind today's 3rd consecutive gain and it is poised for its best-ever close. Recently wedging up above its "max buy" level with gains backed by lackluster volume, not action considered indicative of fresh institutional buying demand. Found prompt support near its 50 DMA line ($137.27) during recent consolidations. Fundamentals remain strong.
>>> FEATURED STOCK ARTICLE : Wedged to a New High Close Above "Max Buy" Level - 4/19/2023 |
View all notes |
Set NEW NOTE alert |
Company Profile |
SEC
News |
Chart |
Request a new note
C
A
S
I |
MTRN
-
NYSE
Materion
METALS and MINING - Industrial Metals and Minerals
|
$108.31
|
-0.41
-0.38% |
$110.82
|
113,920
94.15% of 50 DAV
50 DAV is 121,000
|
$119.75
-9.55%
|
4/18/2023
|
$114.52
|
PP = $118.30
|
|
MB = $124.22
|
Most Recent Note - 4/28/2023 4:23:46 PM
G - Met resistance today when rebounding and remains below its 50 DMA line ($111). Encountered distributional pressure when poised to break out. A prompt rebound above the 50 DMA line is needed for its outlook to improve. Subsequent gains and a strong close above the pivot point backed by at least +40% above average volume may trigger a proper technical buy signal. Due to report Mar '23 quarterly results on 5/03/23. Volume and volatility often increase near earnings news.
>>> FEATURED STOCK ARTICLE : Encountered Distributional Pressure When Poised for Breakout - 4/18/2023 |
View all notes |
Set NEW NOTE alert |
Company Profile |
SEC
News |
Chart |
Request a new note
C
A
S
I |
SPSC
-
NASDAQ
SPS Commerce
COMPUTER SOFTWARE and SERVICES - Application Software
|
$147.30
|
-0.07
-0.05% |
$148.86
|
114,280
72.33% of 50 DAV
50 DAV is 158,000
|
$157.46
-6.45%
|
4/24/2023
|
$150.01
|
PP = $157.56
|
|
MB = $165.44
|
Most Recent Note - 4/27/2023 5:29:19 PM
G - Posted a solid gain today with below-average volume and rebounded near its 50 DMA line ($148.48) which may act as resistance. Highlighted in yellow with new pivot point cited based on its 2/15/23 high plus 10 cents in the 4/24/23 mid-day report. A prompt rebound above its 50 DMA line ($148.48) is needed for its outlook to improve. Subsequent gains above the pivot point backed by at least +40% above average volume may trigger a technical buy signal. Reported Mar '23 quarterly earnings +22% on +20% versus the year-ago period raising some fundamental concerns. Volume and volatility often increase near earnings news.
>>> FEATURED STOCK ARTICLE : Sputtered While Perched in Striking Distance of 52-Week HIgh - 4/24/2023 |
View all notes |
Set NEW NOTE alert |
Company Profile |
SEC
News |
Chart |
Request a new note
C
A
S
I |
HUBB
-
NYSE
Hubbell
Electrical-Power/Equipmt
|
$269.32
|
+2.33
0.87% |
$269.37
|
614,729
155.23% of 50 DAV
50 DAV is 396,000
|
$268.31
0.38%
|
4/25/2023
|
$262.85
|
PP = $257.51
|
|
MB = $270.39
|
Most Recent Note - 4/27/2023 5:31:51 PM
Y - Posted a 4th consecutive gain today and hit a new high with volume +19% above average. Gap up and close above the pivot point on 4/25/23 with a considerable gain backed by +367% triggered a technical buy signal. Highlighted in yellow in the 4/25/23 mid-day report with pivot point cited based on its 3/06/23 high after a 4-month double bottom base. Rebounded above its 50 DMA line ($240) and touched a new 52-week high. Reported strong Mar '23 quarterly earnings +70% on +11% sales revenues versus the year-ago period. Its Mar, Jun, Sep, and Dec '22 quarterly earnings increases were above the +25% minimum (C criteria). Annual earnings history (A criteria) had a downturn in FY '20 like many companies during the pandemic.
>>> FEATURED STOCK ARTICLE : Gap Up Following Earnings Triggered Technical Buy Signal - 4/25/2023 |
View all notes |
Set NEW NOTE alert |
Company Profile |
SEC
News |
Chart |
Request a new note
C
A
S
I |
Symbol/Exchange
Company Name
Industry Group |
PRICE |
CHANGE
(%Change) |
Day High |
Volume
(% DAV)
(% 50 day avg vol) |
52 Wk Hi
% From Hi |
Featured
Date |
Price
Featured |
Pivot Featured |
|
Max Buy |
NVR
-
NYSE
NVR Inc
MATERIALS and CONSTRUCTION - Residential Construction
|
$5,840.00
|
+40.48
0.70% |
$5,846.06
|
18,445
80.20% of 50 DAV
50 DAV is 23,000
|
$5,986.96
-2.45%
|
4/25/2023
|
$5,882.18
|
PP = $5,978.25
|
|
MB = $6,277.16
|
Most Recent Note - 4/28/2023 4:28:11 PM
G - Reported Mar '23 quarterly earnings -14% on -3% sales revenues versus the year-ago period, below the +25% minimum earnings guideline (C criteria) raising fundamental concerns, and its color code is changed to green. Posted a gain today with light volume. Highlighted in yellow in the 4/25/23 mid-day report with pivot point cited based on its 12/30/21 high plus 10 cents. Pulled back after rallying to touch a new all-time high. Confirming gains and a close above the pivot point backed by at least +40% above average volume may clinch a proper technical buy signal. . Prior quarterly comparisons were well above the +25% minimum earnings guideline (C criteria). Annual earnings (A criteria) growth has been very strong.
>>> FEATURED STOCK ARTICLE : Fell From High and Raised Concern With Subpar Mar '23 Report - 4/27/2023 |
View all notes |
Set NEW NOTE alert |
Company Profile |
SEC
News |
Chart |
Request a new note
C
A
S
I |
PHM
-
NYSE
PulteGroup
MATERIALS and CONSTRUCTION - Residential Construction
|
$67.15
|
+0.88
1.33% |
$67.20
|
3,064,516
107.08% of 50 DAV
50 DAV is 2,862,000
|
$66.27
1.33%
|
4/25/2023
|
$65.17
|
PP = $64.01
|
|
MB = $67.21
|
Most Recent Note - 4/26/2023 5:06:13 PM
Y - Pulled back today breaking a streak fo 4 consecutive volume-driven gains. Highlighted in yellow with pivot point cited based on its May 2021 high in the 4/25/23 mid-day report. Bullish action came after it reported earnings +28% for the Mar '23 quarter versus the year-ago period. This Building - Residential/Commercial firm has posted 13 strong quarterly comparisons above the +25% minimum earnings guideline (C criteria). Annual earnings (A criteria) history has been strong. See the latest FSU analysis for more details and a new annotated graph.
>>> FEATURED STOCK ARTICLE : Recently Rallying to New All-Time Highs - 4/26/2023 |
View all notes |
Set NEW NOTE alert |
Company Profile |
SEC
News |
Chart |
Request a new note
C
A
S
I |
|
|
|
THESE ARE NOT BUY RECOMMENDATIONS!
Comments contained in the body of this report are technical
opinions only. The material herein has been obtained
from sources believed to be reliable and accurate, however,
its accuracy and completeness cannot be guaranteed.
This site is not an investment advisor, hence it does
not endorse or recommend any securities or other investments.
Any recommendation contained in this report may not
be suitable for all investors and it is not to be deemed
an offer or solicitation on our part with respect to
the purchase or sale of any securities. All trademarks,
service marks and trade names appearing in this report
are the property of their respective owners, and are
likewise used for identification purposes only.
This report is a service available
only to active Paid Premium Members.
You may opt-out of receiving report notifications
at any time. Questions or comments may be submitted
by writing to Premium Membership Services 665 S.E. 10 Street, Suite 201 Deerfield Beach, FL 33441-5634 or by calling 1-800-965-8307
or 954-785-1121.
|
|
|