You are not logged in.
This means you
CAN ONLY VIEW reports that were published prior to Thursday, March 20, 2025.
You
MUST UPGRADE YOUR MEMBERSHIP if you want to see any current reports.
AFTER MARKET UPDATE - WEDNESDAY, MAY 31ST, 2023
Previous After Market Report Next After Market Report >>>
|
|
|
|
DOW |
-134.51 |
32,908.27 |
-0.41% |
|
Volume |
2,172,920,630 |
+135% |
|
Volume |
6,084,627,600 |
+23% |
|
NASDAQ |
-82.14 |
12,935.29 |
-0.63% |
|
Advancers |
1,272 |
44% |
|
Advancers |
1,784 |
40% |
|
S&P 500 |
-25.69 |
4,179.83 |
-0.61% |
|
Decliners |
1,635 |
56% |
|
Decliners |
2,680 |
60% |
|
Russell 2000 |
-17.64 |
1,749.65 |
-1.00% |
|
52 Wk Highs |
19 |
|
|
52 Wk Highs |
51 |
|
|
S&P 600 |
-14.93 |
1,125.94 |
-1.31% |
|
52 Wk Lows |
103 |
|
|
52 Wk Lows |
202 |
|
|
 |
Leadership Waned as Major Averages Pulled Back
Kenneth J. Gruneisen - Passed the CAN SLIM® Master's Exam
The Dow lost 134 points (-0.4%), while the S&P 500 Index and Nasdaq Composite both slipped by 0.6%. Volume totals reported were higher on the NYSE and on the Nasdaq exchange versus the prior session, action indicative of greater selling pressure from the institutional crowed termed "distribution". Decliners led advancers by a 4-3 margin on the NYSE and 3-2 on the Nasdaq exchange. There were 15 high-ranked companies from the Leaders List that hit a new 52-week high and were listed on the BreakOuts Page versus 76 on the prior session. New 52-week lows totals expanded and solidly outnumbered shrinking new 52-week highs on the NYSE and on the Nasdaq exchange. The major indices are in a confirmed uptrend (M criteria). Appropriate new buying efforts may be considered under the fact-based investment system.
PICTURED: The tech-heavy Nasdaq Composite Index pulled back from a new 2023 high with Wednesday's loss following 3 consecutive gains.
Four of 11 sectors finished in positive territory as U.S. equities fell on Wednesday, the final trading day in May. Investors closely monitored updates on the debt-ceiling debate from Washington. On the data front, the release of the monthly Job Openings and Labor Turnover Survey (JOLTS) report showed that U.S. job openings rose by 358,000 to 10.1 million in April, while data for March was revised higher from 9.59 million to 9.75 million jobs. The report also revealed the number of layoffs last month decreased while quits were little changed. Today’s report indicates continuing tightness in the U.S. labor market. In a separate release, the Chicago Purchasing Managers Index (PMI) fell to 40.4 in May (from 48.6 in April), a reading that appears consistent with other regional PMIs.
Treasury yields declined today on concerns over the debt ceiling legislation. The yield on the 10-year note slid four basis points (0.04%) to 3.64%, while the 30-year bond yield fell five basis points (0.05%) to 3.84%. The yield on the two-year note also declined five basis points (0.05%) to 4.40%. In commodities, West Texas Intermediate (WTI) crude fell 2.30% to $67.86/barrel on investor concerns over weak economic data from China, one of the world’s largest importers.
|
 Kenneth J. Gruneisen started out as a licensed stockbroker in August 1987, a couple of months prior to the historic stock market crash that took the Dow Jones Industrial Average down -22.6% in a single day. He has published daily fact-based fundamental and technical analysis on high-ranked stocks online for two decades. Through FACTBASEDINVESTING.COM, Kenneth provides educational articles, news, market commentary, and other information regarding proven investment systems that work in good times and bad.
Comments contained in the body of this report are technical opinions only and are not necessarily those of Gruneisen Growth Corp. The material herein has been obtained from sources believed to be reliable and accurate, however, its accuracy and completeness cannot be guaranteed. Our firm, employees, and customers may effect transactions, including transactions contrary to any recommendation herein, or have positions in the securities mentioned herein or options with respect thereto. Any recommendation contained in this report may not be suitable for all investors and it is not to be deemed an offer or solicitation on our part with respect to the purchase or sale of any securities. |
|
 |
Financial, Retail, Tech, and Energy-Linked Groups Fell
Kenneth J. Gruneisen - Passed the CAN SLIM® Master's Exam
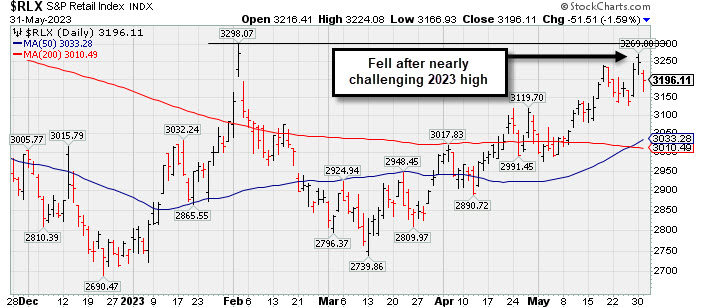
The Bank $BKX -2.47%), Broker/Dealer ($XBD -1.33%) and Retail ($RLX -1.59%) each lost ground and created a drag on the major averages. The Semiconductor ($SOX -2.71%) led the tech sector lower while the Networking ($NWX -0.90%) suffered a smaller loss and the Biotech ($BTK -0.12%) inched lower. Meanwhile, commodity-linked groups were mixed as the Oil Services ($OSX -3.22%) and Integrated Oil ($XOI -2.09%) both lost ground while the Gold & Silver ($XAU +1.55%) rose.
PICTURED: The Retail ($RLX -1.59%) fell today after rebounding near its 2023 high. Its 50-day moving average (DMA) line has risen above its 200 DMA line, a bullish technical signal termed a "golden cross".
| Oil Services |
$OSX |
69.29 |
-2.30 |
-3.22% |
-17.37% |
| Integrated Oil |
$XOI |
1,576.68 |
-33.65 |
-2.09% |
-11.78% |
| Semiconductor |
$SOX |
3,453.18 |
-96.21 |
-2.71% |
+36.38% |
| Networking |
$NWX |
790.81 |
-7.21 |
-0.90% |
+0.96% |
| Broker/Dealer |
$XBD |
438.52 |
-5.93 |
-1.33% |
-2.36% |
| Retail |
$RLX |
3,196.11 |
-51.51 |
-1.59% |
+16.05% |
| Gold & Silver |
$XAU |
122.39 |
+1.87 |
+1.55% |
+1.26% |
| Bank |
$BKX |
76.16 |
-1.93 |
-2.47% |
-24.49% |
| Biotech |
$BTK |
5,236.75 |
-6.32 |
-0.12% |
-0.84% |
|
|
|
 |
Pulled Back After Quietly Wedging to New Highs
Kenneth J. Gruneisen - Passed the CAN SLIM® Master's Exam
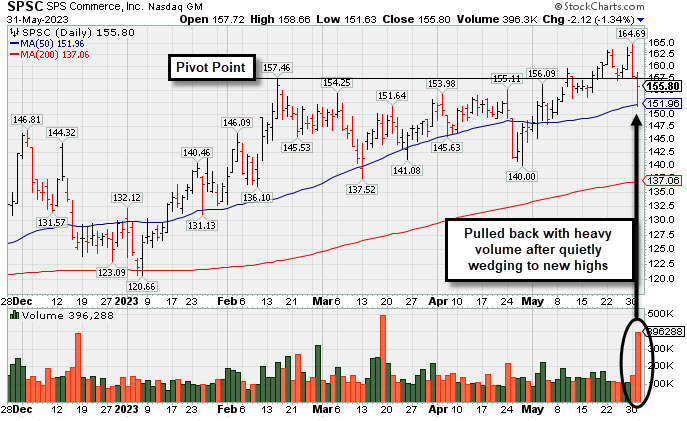
SPS Commerce (SPSC -$2.12 or -1.34% to $155.80) pulled back testing its 50-day moving average (DMA) line ($151.96) with today's loss after a "negative reversal" on the prior session when wedging to a new 52-week high. Recent gains above the pivot point were not backed by the +40% above average volume needed to trigger a proper technical buy signal.
Recently it reported Mar '23 quarterly earnings +22% on +20% versus the year-ago period, below the +25% minimum earnings guideline (C criteria) raising some fundamental concerns. Two of the 4 latest quarterly comparisons were above the +25% minimum earnings guideline (C criteria). Annual earnings (A criteria) history has been strong and it has an Earnings Per Share Rating of 98.
SPSC was highlighted in yellow in the 4/24/23 mid-day report with new pivot point cited based on its 2/15/23 high plus 10 cents. It was shown in greater detail that evening with an annotated graph under the headline, "Sputtered While Perched in Striking Distance of 52-Week HIgh". Subsequent gains above the pivot point were not backed by at least +40% above average volume to trigger a proper technical buy signal.
SPSC is -5.4% off its 52-week high. Its current Relative Strength Rating of 90 is above the 80+ minimum guideline for buy candidates. It hails from the Computer Software - Spec Enterprise group which is currently ranked 6th on the 197 Industry Groups list (L criteria).
The number of top-rated funds owning its shares rose from 562 in Sep '22 to 583 in Mar '23, a reassuring sign concerning the I criteria. Its current Up/Down Volume Ratio of 1.4 is an unbiased indication its shares have been under slight accumulation over the past 50 days. It has a Timeliness Rating of A and Sponsorship Rating of B. The small supply of 36.5 million shares outstanding (S criteria) can contribute to greater price volatility in the even of institutional buying or selling. A 2:1 split impacted share price on 8/23/19. Charts courtesy of www.stockcharts.com
 Symbol/Exchange
Company Name
Industry Group | PRICE | CHANGE
(%Change) | Day High | Volume
(% DAV)
(% 50 day avg vol) | 52 Wk Hi
% From Hi | Featured
Date | Price
Featured | Pivot Featured | | Max Buy |  GPK - NYSE GPK - NYSE
Graphic Packaging Hldg
CONSUMER NON-DURABLES - Packaging and Containers | $23.90 | -0.56
-2.29% | $24.35 | 3,136,534
112.20% of 50 DAV
50 DAV is 2,795,400 | $26.16
-8.64%
| 10/25/2022 | $22.75 | PP = $24.17 | | MB = $25.38 |  Most Recent Note - 5/31/2023 2:57:11 PM Most Recent Note - 5/31/2023 2:57:11 PM
G - Tested its 4/27/23 low today which defines near term support to watch above its 200 DMA line ($23.14). Volume totals have been below average but it slumped below its 50 DMA line ($25) triggering a technical sell signal during a 7-session losing streak. A rebound above the 50 DMA line is needed for its outlook to improve. Reported Mar '23 quarterly earnings +60% on +9% sales revenues versus the year-ago period.
>>> FEATURED STOCK ARTICLE : Packaging Firm Due to Report Earnings News - 5/1/2023 | View all notes | Set NEW NOTE alert | Company Profile | SEC News | Chart | Request a new note C A S I | STRL - NASDAQ
Sterling Infrastructure
MATERIALS and; CONSTRUCTION - Heavy Construction | $46.07 | -1.60
-3.36% | $47.89 | 728,687
319.60% of 50 DAV
50 DAV is 228,000 | $48.44
-4.89%
| 12/14/2022 | $32.41 | PP = $33.72 | | MB = $35.41 | Most Recent Note - 5/31/2023 2:48:36 PM
G - Retreating from its all-time high with above average volume behind today's loss following 9 consecutive gains. Reported Mar '23 quarterly earnings +0% on +10% sales revenues versus the year-ago period, below the +25% minimum earnings guideline (C criteria) raising fundamental concerns.
>>> FEATURED STOCK ARTICLE : 50-Day Moving Average Line Acted as Recent Resistance - 4/28/2023 | View all notes | Set NEW NOTE alert | Company Profile | SEC News | Chart | Request a new note C A S I | FIX - NYSE
Comfort Systems USA
MATERIALS and CONSTRUCTION - General Contractors | $147.98 | -3.36
-2.22% | $152.89 | 285,462
103.05% of 50 DAV
50 DAV is 277,000 | $156.19
-5.26%
| 4/27/2023 | $148.85 | PP = $152.23 | | MB = $159.84 | Most Recent Note - 5/30/2023 9:31:21 PM
Y - Still perched near its all-time high. No resistance remains due to overhead supply, however, it has made little headway in recent weeks. Subsequent gains and new highs backed by at least +40% above average volume may help reconfirm a technical buy signal.
>>> FEATURED STOCK ARTICLE : Churning Action While Recently Hovering Near All-Time High - 5/12/2023 | View all notes | Set NEW NOTE alert | Company Profile | SEC News | Chart | Request a new note C A S I | KOF - NYSE
Coca-Cola Femsa ADR
FOOD and BEVERAGE - Beverages - Soft Drinks | $82.82 | -1.45
-1.72% | $84.45 | 286,603
147.73% of 50 DAV
50 DAV is 194,000 | $91.23
-9.22%
| 3/7/2023 | $76.63 | PP = $77.11 | | MB = $80.97 | Most Recent Note - 5/30/2023 9:40:04 PM
G - Testing support near its 50 DMA line ($83.94) with higher volume behind today's 6th consecutive loss. More damaging losses would trigger a technical sell signal. Reported Mar '23 quarterly earnings +53% on +24% sales revenues versus the year-ago period. Prior highs in the $79-$77 area define the next support to watch below its 50 DMA line.
>>> FEATURED STOCK ARTICLE : Posted Gain Afrer Reporting Strong Mar '23 Quarterly Results - 5/2/2023 | View all notes | Set NEW NOTE alert | Company Profile | SEC News | Chart | Request a new note C A S I | CLH - NYSE
Clean Harbors
Pollution Control | $140.40 | -3.77
-2.61% | $144.64 | 648,704
173.92% of 50 DAV
50 DAV is 373,000 | $147.76
-4.98%
| 3/10/2023 | $136.89 | PP = $136.74 | | MB = $143.58 | Most Recent Note - 5/30/2023 9:22:19 PM
G - Color code is changed to green while hovering above its "max buy" level near its all-time high without making meaningful progress for the past week. Found support near its 50 DMA line ($140.01). More damaging losses would raise greater concerns. Reported Mar '23 quarterly earnings +64% on +12% sales revenues versus the year-ago period. Fundamentals remain strong.
>>> FEATURED STOCK ARTICLE : Showed Resilience Near 50-Day Moving Average Following Sell-Off - 5/10/2023 | View all notes | Set NEW NOTE alert | Company Profile | SEC News | Chart | Request a new note C A S I | Symbol/Exchange
Company Name
Industry Group | PRICE | CHANGE
(%Change) | Day High | Volume
(% DAV)
(% 50 day avg vol) | 52 Wk Hi
% From Hi | Featured
Date | Price
Featured | Pivot Featured | | Max Buy | SPSC - NASDAQ
SPS Commerce
COMPUTER SOFTWARE and SERVICES - Application Software | $155.80 | -2.12
-1.34% | $158.66 | 396,237
293.51% of 50 DAV
50 DAV is 135,000 | $164.69
-5.40%
| 4/24/2023 | $150.01 | PP = $157.56 | | MB = $165.44 | Most Recent Note - 5/31/2023 2:53:37 PM
Y - Pulling back testing its 50 DMA line ($151.91) today after a "negative reversal" on the prior session when wedging to a new 52-week high. Recent gains above the pivot point were not backed by the +40% above average volume needed to trigger a proper technical buy signal. Reported Mar '23 quarterly earnings +22% on +20% versus the year-ago period, below the +25% minimum earnings guideline (C criteria) raising some fundamental concerns.
>>> FEATURED STOCK ARTICLE : Pulled Back After Quietly Wedging to New Highs - 5/31/2023 | View all notes | Set NEW NOTE alert | Company Profile | SEC News | Chart | Request a new note C A S I | HUBB - NYSE
Hubbell
Electrical-Power/Equipmt | $282.46 | -6.42
-2.22% | $289.49 | 538,205
135.23% of 50 DAV
50 DAV is 398,000 | $291.91
-3.24%
| 4/25/2023 | $262.85 | PP = $257.51 | | MB = $270.39 | Most Recent Note - 5/31/2023 2:58:03 PM
G - Pulling back today for a 2nd loss after hitting new all-time highs and getting extended from any sound base. Bullish action came after its strong Mar '23 quarterly results. Prior highs in the $263 area define initial support to watch on pullbacks.
>>> FEATURED STOCK ARTICLE : Gap Up Following Earnings Triggered Technical Buy Signal - 4/25/2023 | View all notes | Set NEW NOTE alert | Company Profile | SEC News | Chart | Request a new note C A S I | NVR - NYSE
NVR
MATERIALS and CONSTRUCTION - Residential Construction | $5,554.22 | -66.99
-1.19% | $5,643.57 | 93,654
425.70% of 50 DAV
50 DAV is 22,000 | $5,986.96
-7.23%
| 4/25/2023 | $5,882.18 | PP = $5,978.25 | | MB = $6,277.16 | Most Recent Note - 5/30/2023 9:44:46 PM
G - Slumped below its 50 DMA line last week raising technical concerns. Reported Mar '23 quarterly earnings -14% on -3% sales revenues versus the year-ago period, below the +25% minimum earnings guideline (C criteria) raising fundamental concerns, and its color code was changed to green. Prior quarterly comparisons were well above the +25% minimum earnings guideline (C criteria). Annual earnings (A criteria) growth has been very strong.
>>> FEATURED STOCK ARTICLE : Fell From High and Raised Concern With Subpar Mar '23 Report - 4/27/2023 | View all notes | Set NEW NOTE alert | Company Profile | SEC News | Chart | Request a new note C A S I | PHM - NYSE
PulteGroup
MATERIALS and CONSTRUCTION - Residential Construction | $66.08 | -0.61
-0.91% | $66.74 | 6,403,059
227.30% of 50 DAV
50 DAV is 2,817,000 | $70.54
-6.32%
| 4/25/2023 | $65.17 | PP = $64.01 | | MB = $67.21 | Most Recent Note - 5/30/2023 9:46:30 PM
Y - Pulled back from its all-time high and below "max buy" level and its color code is changed to yellow. Reported earnings +28% for the Mar '23 quarter versus the year-ago period. Prior highs in the $64-60 area define initial support to watch above its 50 DMA line ($63.03).
>>> FEATURED STOCK ARTICLE : Recently Rallying to New All-Time Highs - 4/26/2023 | View all notes | Set NEW NOTE alert | Company Profile | SEC News | Chart | Request a new note C A S I | COKE - NASDAQ
Coca-Cola Consolidated
FOOD and BEVERAGE - Beverages - Soft Drinks | $661.74 | -6.08
-0.91% | $670.49 | 57,707
180.33% of 50 DAV
50 DAV is 32,000 | $694.20
-4.68%
| 5/4/2023 | $646.66 | PP = $656.21 | | MB = $689.02 | Most Recent Note - 5/30/2023 9:24:10 PM
Y - Consolidating above the pivot point and below its "max buy" level. Bullish action came after it reported Mar '23 quarterly earnings +93% on +12% sales revenues versus the year-ago period, continuing its strong earnings track record.
>>> FEATURED STOCK ARTICLE : COKE is Showing Real Strength - 5/4/2023 | View all notes | Set NEW NOTE alert | Company Profile | SEC News | Chart | Request a new note C A S I | Symbol/Exchange
Company Name
Industry Group | PRICE | CHANGE
(%Change) | Day High | Volume
(% DAV)
(% 50 day avg vol) | 52 Wk Hi
% From Hi | Featured
Date | Price
Featured | Pivot Featured | | Max Buy | AMPH - NASDAQ
Amphastar Pharm
Medical-Biomed/Biotech | $44.37 | +0.03
0.07% | $45.00 | 435,365
114.27% of 50 DAV
50 DAV is 381,000 | $45.50
-2.48%
| 5/15/2023 | $43.56 | PP = $44.15 | | MB = $46.36 | Most Recent Note - 5/30/2023 9:16:32 PM
Y - Volume totals have been cooling while hovering near its all-time high. Subsequent gains and a strong close above the pivot point backed by at least +40% above average volume may clinch a technical buy signal. Three of the 4 latest quarterly comparisons through Mar '23 versus the year-ago periods have been strong and well above the +25% minimum earnings guideline (C criteria). Annual earnings history (A criteria) has been strong.
>>> FEATURED STOCK ARTICLE : Weak Finish After Early Gain When Perched Near All-Time High - 5/15/2023 | View all notes | Set NEW NOTE alert | Company Profile | SEC News | Chart | Request a new note C A S I | ANET - NYSE
Arista Networks
Computer-Networking | $166.34 | -8.08
-4.63% | $170.60 | 6,173,812
195.25% of 50 DAV
50 DAV is 3,162,000 | $178.36
-6.74%
| 5/30/2023 | $176.35 | PP = $171.54 | | MB = $180.12 | Most Recent Note - 5/31/2023 2:50:54 PM
Y - Pulling back today following 4 consecutive volume-driven gains hitting a new high triggering a technical buy signal. Color code was changed to yellow with new pivot point cited based on its 3/23/23 high plus 10 cents in the 5/30/23 mid-day report. Reported Mar '23 quarterly earnings +70% on +54% sales revenues versus the year-ago period and fundamentals remain strong. Found support at its 200 DMA line in recent weeks since dropped from the Featured Stocks list on 5/03/23.
>>> FEATURED STOCK ARTICLE : Technical Sell Signal Triggered by Damaging Volume-Driven Loss - 5/3/2023 | View all notes | Set NEW NOTE alert | Company Profile | SEC News | Chart | Request a new note C A S I |
|
|
|
Color Codes Explained :
Y - Better candidates highlighted by our
staff of experts.
G - Previously featured
in past reports as yellow but may no longer be buyable under the
guidelines.
***Last / Change / Volume data in this table is the closing quote data***
|
|
|
THESE ARE NOT BUY RECOMMENDATIONS!
Comments contained in the body of this report are technical
opinions only. The material herein has been obtained
from sources believed to be reliable and accurate, however,
its accuracy and completeness cannot be guaranteed.
This site is not an investment advisor, hence it does
not endorse or recommend any securities or other investments.
Any recommendation contained in this report may not
be suitable for all investors and it is not to be deemed
an offer or solicitation on our part with respect to
the purchase or sale of any securities. All trademarks,
service marks and trade names appearing in this report
are the property of their respective owners, and are
likewise used for identification purposes only.
This report is a service available
only to active Paid Premium Members.
You may opt-out of receiving report notifications
at any time. Questions or comments may be submitted
by writing to Premium Membership Services 665 S.E. 10 Street, Suite 201 Deerfield Beach, FL 33441-5634 or by calling 1-800-965-8307
or 954-785-1121.
|
|
|