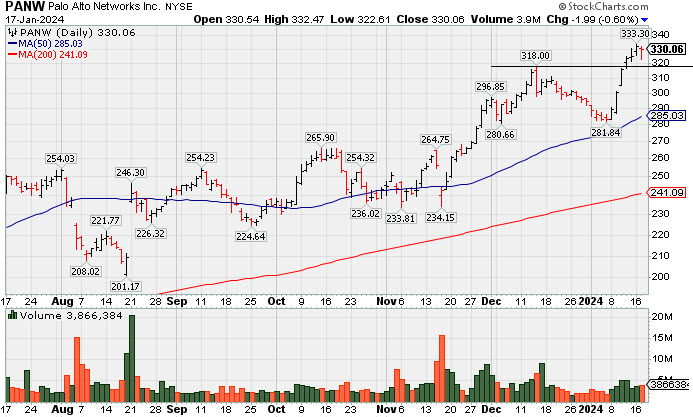
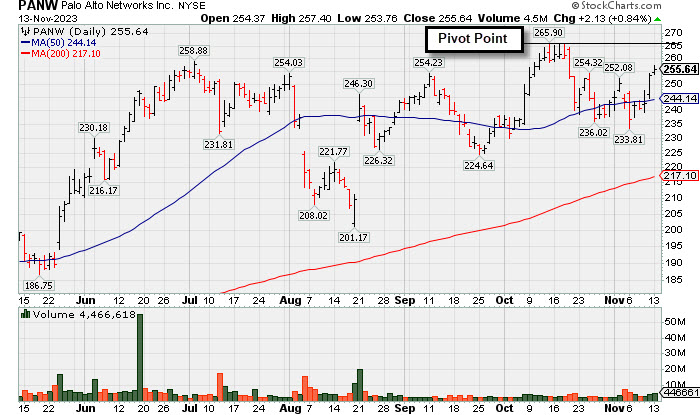
Paused After 6 Gains to a New All-Time High - Wednesday, January 17, 2024
Palo Alto Networks (PANW -$1.99 or -0.60% to $330.06) paused today following 6 consecutive gains for new all-time highs. It was recently highlighted in yellow while noting that a valid secondary buy point exists up to 5% above the prior high after finding support at its 10 WMA line since the prior breakout. Fundamentals remain strong.
PANW was highlighted in yellow in the 11/13/23 mid-day report (read here) with new pivot point cited based on its 10/13/23 high after a short flat base. It was last shown in great detail on 12/15/23 with an annotated graph under the headline, "Consolidating After Volume-Driven Gains for All-Time Highs". Fundamentals have been strong through the Oct '23 quarter with earnings +66% on +20% sales revenues versus the year-ago period. It has a 98 Earnings Per Share Rating. It had a downturn in FY '20 earnings like many companies during the pandemic but has continued posting strong annual earnings (A criteria) since. .
PANW's share price was impacted by a 3:1 split on 9/14/22 and it now has a supply (S criteria) of 315.3 million shares outstanding. The number of top-rated funds owning its shares rose from 892 in Jun '17 to 3,200 in Dec '23, a very reassuring sign concerning the I criteria. Its current Up/Down Volume Ratio of 1.7 is an unbiased indication that over the past 50 days it has been under slight accumulation. It has an A Timeliness Rating and a C Sponsorship Rating.
| Symbol/Exchange Company Name Industry Group | PRICE | CHANGE | Day High | Volume (% DAV) (% 50 day avg vol) | 52 Wk Hi | Featured Date | Price Featured | Pivot Featured |
| Max Buy | ||||||||
Arista Networks Computer-Networking | $248.99 | -4.27 -1.69% | $253.26 | 1,377,929 50 DAV is 1,701,000 | $257.21 -3.20% | 10/31/2023 | $188.84 | PP = $198.80 |
| MB = $208.74 | ||||||||
G - Pulled back today after 4 consecutive gains, retreating from its all-time high with lighter volume behind a small loss. Its 50 DMA line ($226.53) defines near-term support above the prior low in the $210 area. Fundamentals remain strong. >>> FEATURED STOCK ARTICLE : Extended From Base and Hovering at All-Time High - 12/26/2023 | View all notes | Set NEW NOTE alert | Company Profile | SEC News | Chart | Request a new note | ||||||||
Novo Nordisk ADR Medical-Ethical Drugs | $106.68 | +0.33 0.31% | $107.11 | 2,682,303 50 DAV is 4,265,000 | $108.98 -2.11% | 11/2/2023 | $100.97 | PP = $104.10 |
| MB = $109.31 | ||||||||
Y - Volume has been cooling after recently challenging its all-time high. Prior highs in the $105 area define initial support above its 50 DMA line ($101.85). >>> FEATURED STOCK ARTICLE : Gap Up Gain on Prior Session Triggered Technical Buy Signal - 1/5/2024 | View all notes | Set NEW NOTE alert | Company Profile | SEC News | Chart | Request a new note | ||||||||
Qualys Computer Sftwr-Security | $193.54 | +1.36 0.71% | $194.81 | 324,830 50 DAV is 383,000 | $206.35 -6.21% | 11/3/2023 | $167.50 | PP = $165.03 |
| MB = $173.28 | ||||||||
G - Still finding support above its 50 DMA line ($186.53). The 1/05/24 low ($180.01) defines important near-term support where more damaging losses would raise concerns. >>> FEATURED STOCK ARTICLE : Posted Light Volume Gain Finding Support at 50-Day Moving Average - 1/8/2024 | View all notes | Set NEW NOTE alert | Company Profile | SEC News | Chart | Request a new note | ||||||||
Axon Enterprise Security/Sfty | $250.51 | +1.04 0.42% | $250.68 | 265,663 50 DAV is 458,000 | $260.69 -3.91% | 11/8/2023 | $127.84 | PP = $223.30 |
| MB = $234.47 | ||||||||
| Most Recent Note - 1/12/2024 5:04:05 PM G - Posted a small gain today with average volume. Its 50-day moving average (DMA) line ($237) defines near-term support above prior highs in the $229-231 area. >>> FEATURED STOCK ARTICLE : Consolidating Well Above Near-Term Support - 1/9/2024 | View all notes | Set NEW NOTE alert | Company Profile | SEC News | Chart | Request a new note | ||||||||
TransDigm Group Aerospace/Defense | $1,031.75 | +4.43 0.43% | $1,040.67 | 148,984 50 DAV is 222,000 | $1,033.81 -0.20% | 12/12/2023 | $1,000.39 | PP = $1,013.18 |
| MB = $1,063.84 | ||||||||
Y - Hit another new all-time high with a small gain today with below-average volume. Recently wedging higher without great volume conviction. >>> FEATURED STOCK ARTICLE : Inching to New Highs With 6th Consecutive Gain - 1/11/2024 | View all notes | Set NEW NOTE alert | Company Profile | SEC News | Chart | Request a new note | ||||||||
| Symbol/Exchange Company Name Industry Group | PRICE | CHANGE | Day High | Volume (% DAV) (% 50 day avg vol) | 52 Wk Hi | Featured Date | Price Featured | Pivot Featured |
| Max Buy | ||||||||
Palo Alto Networks Computer Sftwr-Security | $330.06 | -1.99 -0.60% | $332.47 | 3,863,729 50 DAV is 4,472,000 | $333.30 -0.97% | 1/10/2024 | $313.65 | PP = $318.00 |
| MB = $333.90 | ||||||||
Y - Paused today after 6 consecutive gains with below-average volume for new all-time highs.A valid secondary buy point exists up to 5% above the prior high after finding support at its 10 WMA line since the prior breakout. Fundamentals remain strong. See the latest FSU analysis for more details and a new annotated graph. >>> FEATURED STOCK ARTICLE : Paused After 6 Gains to a New All-Time High - 1/17/2024 | View all notes | Set NEW NOTE alert | Company Profile | SEC News | Chart | Request a new note | ||||||||
United Rentals Comml Svcs-Leasing | $550.32 | -10.81 -1.93% | $561.31 | 634,417 50 DAV is 671,000 | $585.50 -6.01% | 12/1/2023 | $499.51 | PP = $488.73 |
| MB = $513.17 | ||||||||
G - Pulled back today with higher (near average) volume. Still consolidating near its all-time high. Its 50 DMA line ($512) defines near-term support to watch above prior highs. >>> FEATURED STOCK ARTICLE : Perched Near All-Time High Following Volume-Driven Gains - 12/19/2023 | View all notes | Set NEW NOTE alert | Company Profile | SEC News | Chart | Request a new note | ||||||||
Amphastar Pharm Medical-Biomed/Biotech | $56.17 | +0.67 1.21% | $56.37 | 344,797 50 DAV is 501,000 | $67.66 -16.98% | 12/4/2023 | $60.84 | PP = $58.35 |
| MB = $61.27 | ||||||||
| Most Recent Note - 1/16/2024 2:31:45 PM G - Still lingering below its 50 DMA line ($56.71) after 5 consecutive volume-driven losses. Only a prompt rebound above the 50 DMA line would help its outlook improve. Fundamentals remain strong. >>> FEATURED STOCK ARTICLE : Consolidating Above Pivot Point With Volume Cooling - 12/21/2023 | View all notes | Set NEW NOTE alert | Company Profile | SEC News | Chart | Request a new note | ||||||||
The Bancorp Banks-Northeast | $37.95 | +0.15 0.40% | $38.02 | 266,145 50 DAV is 398,000 | $42.46 -10.62% | 12/4/2023 | $39.88 | PP = $41.62 |
| MB = $43.70 | ||||||||
| Most Recent Note - 1/12/2024 5:02:05 PM G - Slumped back below its 50 DMA line ($39.08) with today''s loss following 4 gains. A prompt rebound above the 50 DMA line is needed for its outlook to improve. >>> FEATURED STOCK ARTICLE : Negative Reversals are Signs of Distributional Pressure - 12/22/2023 | View all notes | Set NEW NOTE alert | Company Profile | SEC News | Chart | Request a new note | ||||||||
lululemon athletica Retail-Apparel/Shoes/Acc | $468.46 | -2.27 -0.48% | $469.58 | 1,315,363 50 DAV is 1,497,000 | $516.39 -9.28% | 12/8/2023 | $490.61 | PP = $485.93 |
| MB = $510.23 | ||||||||
| Most Recent Note - 1/16/2024 2:39:02 PM Y - Slumping near its 50 DMA line ($464) which defines important near-term support to watch. Retreat below its 2021 high of $485 raised concerns, negating its recent breakout from a 2+ year base. >>> FEATURED STOCK ARTICLE : Perched at All-Time High With Volume Totals Cooling - 12/27/2023 | View all notes | Set NEW NOTE alert | Company Profile | SEC News | Chart | Request a new note | ||||||||
| Symbol/Exchange Company Name Industry Group | PRICE | CHANGE | Day High | Volume (% DAV) (% 50 day avg vol) | 52 Wk Hi | Featured Date | Price Featured | Pivot Featured |
| Max Buy | ||||||||
CrowdStrike Holdings Computer Sftwr-Security | $276.19 | -10.10 -3.53% | $283.23 | 4,395,894 50 DAV is 3,267,000 | $290.33 -4.87% | 1/2/2024 | $246.42 | PP = $261.91 |
| MB = $275.01 | ||||||||
G - Pulling back near its "max buy" level with today's loss. Faces no resistance due to overhead supply. Prior high in the $261 area defines initial support to watch on pullbacks. Fundamentals remain strong. >>> FEATURED STOCK ARTICLE : CrowdStrike Holdings Pulling Back After "3-Weeks Tight" Pattern - 1/3/2024 | View all notes | Set NEW NOTE alert | Company Profile | SEC News | Chart | Request a new note | ||||||||
e.l.f. Beauty Cosmetics/Personal Care | $163.10 | -0.83 -0.51% | $163.26 | 974,884 50 DAV is 1,379,000 | $164.71 -0.98% | 1/2/2024 | $138.23 | PP = $153.63 |
| MB = $161.31 | ||||||||
| Most Recent Note - 1/16/2024 2:36:31 PM G - Wedging to yet another new high and above its "max buy" level with today''s gain adding to a spurt of gains backed by below-average volume and its color code is changed to green. Fundamentals remain strong. >>> FEATURED STOCK ARTICLE : Pulled Back After Closing 3 Weeks Tight - 1/2/2024 | View all notes | Set NEW NOTE alert | Company Profile | SEC News | Chart | Request a new note | ||||||||
Coca-Cola Femsa ADR Beverages-Non-Alcoholic | $90.90 | -0.44 -0.48% | $91.28 | 118,888 50 DAV is 142,000 | $99.34 -8.50% | 1/12/2024 | $93.38 | PP = $99.34 |
| MB = $104.31 | ||||||||
| Most Recent Note - 1/12/2024 5:00:19 PM Y - Posted a solid volume-driven gaink today. Color code was changed to yellow as a valid secondary buy point was noted up to +5% above the recent high since finding support at its 10 WMA line after an earlier breakout. Found prompt support near prior highs in the $90 area and above its 50 DMA line. Its Relative Strength Rating is currently 81, just above the 80+ minimum guideline for buy candidates. See the latest FSU analysis for more details and a new annotated graph. >>> FEATURED STOCK ARTICLE : Secondary Buy Point Noted After Finding Support - 1/12/2024 | View all notes | Set NEW NOTE alert | Company Profile | SEC News | Chart | Request a new note | ||||||||
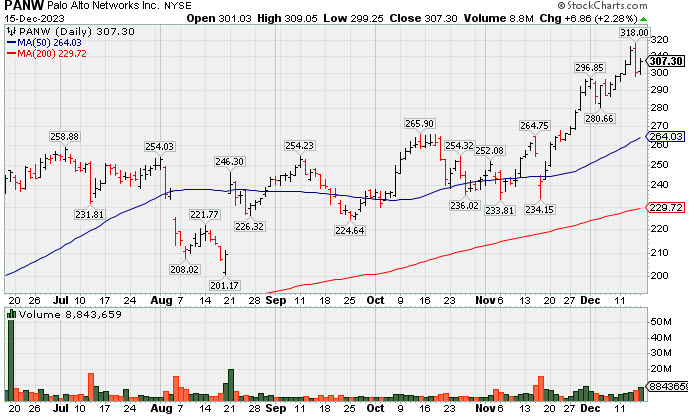
Consolidating After Volume-Driven Gains for All-Time Highs - Friday, December 15, 2023
Palo Alto Networks (PANW +$6.86 or +2.28% to $307.30) is consolidating following a noted streak of 5 consecutive gains to new all-time highs. Prior highs in the $265 area define initial support to watch above its 50-day moving average (DMA) line ($264.02).
PANW was highlighted in yellow in the 11/13/23 mid-day report (read here) with a new pivot point cited based on its 10/13/23 high after a short flat base. It was last shown in great detail on 11/13/23 with an annotated graph under the headline, "Earnings New Due While Perched Near Prior High". Subsequent gains above the pivot point backed by at least +40% above average volume triggered a proper technical buy signal. Fundamentals have been strong through the Oct '23 quarter with earnings +66% on +20% sales revenues versus the year-ago period. It has a 98 Earnings Per Share Rating. It had a downturn in FY '20 earnings like many companies during the pandemic but has continued posting strong annual earnings (A criteria) since. .
PANW's share price was impacted by a 3:1 split on 9/14/22 and it now has a supply (S criteria) of 315.3 million shares outstanding. The number of top-rated funds owning its shares rose from 892 in Jun '17 to 3,123 in Sep '23, a very reassuring sign concerning the I criteria. Its current Up/Down Volume Ratio of 1.7 is an unbiased indication that over the past 50 days it has been under slight accumulation. It has an A Timeliness Rating and a C Sponsorship Rating.
Earnings New Due While Perched Near Prior High - Monday, November 13, 2023
Palo Alto Networks (PANW +$2.12 or +0.84% to $255.63) was highlighted in yellow in the earlier mid-day report (read here) with a new pivot point cited based on its 10/13/23 high after a short flat base. It rebounded further above its 50-day moving average DMA line ($244) toward the prior high with today's 3rd consecutive gain. Subsequent gains above the pivot point backed by at least +40% above average volume are needed to trigger a proper technical buy signal.
Keep in mind it is due to report Oct '23 quarterly results on 11/15/23. Volume and volatility often increase near earnings news. Fundamentals have been strong through the Jul '23 quarter with earnings +80% on +26% sales revenues versus the year-ago period. PANW was last shown in great detail on 7/13/23 with an annotated graph under the headline, "Volume Cooling While Hovering Near High". It showed resilience since dropped from the Featured Stocks list on 8/09/23.
It has a 98 Earnings Per Share Rating. It has shown bullish action after reporting Apr '23 quarterly earnings +83% on +24% sales revenues versus the year-ago period. Prior quarterly comparisons were above the +25% minimum earnings guideline (C criteria). It had a downturn in FY '20 earnings like many companies during the pandemic but has continued posting strong annual earnings (A criteria) since.
PANW's share price was impacted by a 3:1 split on 9/14/22 and it now has a supply (S criteria) of 305.9 million shares outstanding. The number of top-rated funds owning its shares rose from 892 in Jun '17 to 3,095 in Sep '23, a very reassuring sign concerning the I criteria. Its current Up/Down Volume Ratio of 1.2 is an unbiased indication that over the past 50 days it has been under slight accumulation. It has an A Timeliness Rating and a C Sponsorship Rating.
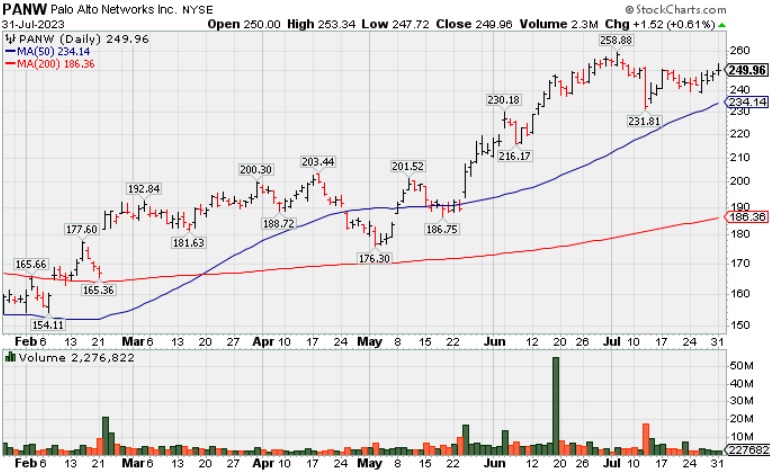
Volume Cooling While Hovering Near High - Monday, July 31, 2023
Palo Alto Networks (PANW +$1.37 or +0.55% to $249.81) posted a 4th consecutive small gain. Volume totals have been cooling while consolidating above its 50-day moving average (DMA) line ($234) which defines near-term support to watch. It has not formed a sound new base of sufficient length. Fundamentals remain strong.
PANW was highlighted in yellow with new pivot point cited based on its 4/20/22 high plus 10 cents in the 6/05/23 mid-day report (read here). It was last shown in great detail on 6/27/23 with an annotated graph under the headline, "Strength Continues for Network Security Leader".
It has a 98 Earnings Per Share Rating. It has shown bullish action after reporting Apr '23 quarterly earnings +83% on +24% sales revenues versus the year-ago period. Prior quarterly comparisons were above the +25% minimum earnings guideline (C criteria). It had a downturn in FY '20 earnings like many companies during the pandemic but has continued posting strong annual earnings (A criteria) since.
PANW's share price was impacted by a 3:1 split on 9/14/22 and it now has a supply (S criteria) of 305.9 million shares outstanding. The number of top-rated funds owning its shares rose from 892 in Jun '17 to 2,716 in Jun '23, a very reassuring sign concerning the I criteria. Its current Up/Down Volume Ratio of 2.0 is an unbiased indication that over the past 50 days it has been under accumulation. It has an A Timeliness Rating and a C Sponsorship Rating.
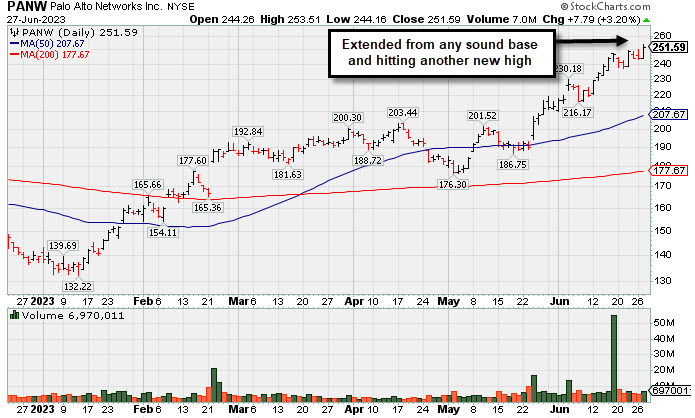
Strength Continues for Network Security Leader - Tuesday, June 27, 2023
Palo Alto Networks (PANW +$7.79 or +3.20% to $251.59) hit a new all-time high with today's gain backed by +16% above-average volume. It is very extended from the prior high ($213) which defines initial support to watch on pullbacks. Fundamentals remain strong.
PANW was highlighted in yellow with new pivot point cited based on its 4/20/22 high plus 10 cents in the 6/05/23 mid-day report (read here). It was shown in greater detail that evening with an annotataed graph under the headline, "Palo Alto Powers to New Highs Again".
It has a 98 Earnings Per Share Rating. It has shown bullish action after reporting Apr '23 quarterly earnings +83% on +24% sales revenues versus the year-ago period. Prior quarterly comparisons were above the +25% minimum earnings guideline (C criteria). It had a downturn in FY '20 earnings like many companies during the pandemic but has continued posting strong annual earnings (A criteria) since.
PANW's share price was impacted by a 3:1 split on 9/14/22 and it now has a supply (S criteria) of 305.9 million shares outstanding. The number of top-rated funds owning its shares rose from 892 in Jun '17 to 2,538 in Mar '23, a very reassuring sign concerning the I criteria. Its current Up/Down Volume Ratio of 2.1 is an unbiased indication that over the past 50 days it has been under accumulation. It has an A Timeliness Rating and a C Sponsorship Rating.
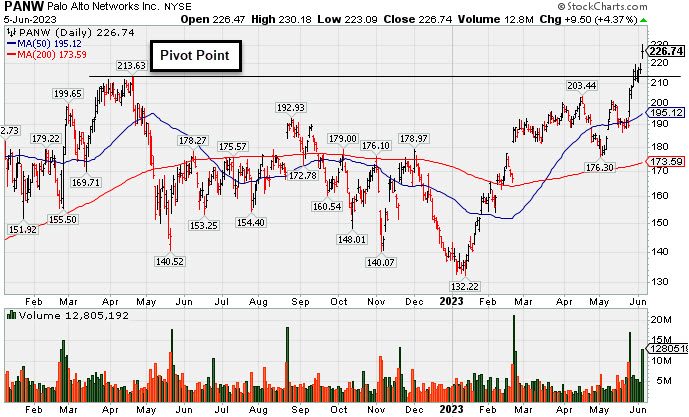
Palo Alto Powers to New Highs Again - Monday, June 5, 2023
Palo Alto Networks (PANW+$9.55 or +4.40% to $226.79) was highlighted in yellow with new pivot point cited based on its 4/20/22 high plus 10 cents in the earlier mid-day report (read here). It powered to new all-time highs with today's gap up and 8th consecutive volume-driven gain. The gain helped clinch a technical buy signal, however it is quickly getting extended from the lengthy new base.
It has an 89 Earnings Per Share Rating. It has shown bullish action after reporting Apr '23 quarterly earnings +83% on +24% sales revenues versus the year-ago period. Prior quarterly comparisons were above the +25% minimum earnings guideline (C criteria). It had a downturn in FY '20 earnings like many companies during the pandemic but has continued posting strong annual earnings (A criteria) since.
PANW's share price was impacted by a 3:1 split on 9/14/22 and it now has a supply (S criteria) of 305.9 million shares outstanding. The number of top-rated funds owning its shares rose from 892 in Jun '17 to 2,533 in Mar '23, a very reassuring sign concerning the I criteria. Its current Up/Down Volume Ratio of 1.8 is an unbiased indication that over the past 50 days it has been under accumulation. It has an A Timeliness Rating and a C Sponsorship Rating.
| Symbol/Exchange Company Name Industry Group | PRICE | CHANGE | Day High | Volume (% DAV) (% 50 day avg vol) | 52 Wk Hi | Featured Date | Price Featured | Pivot Featured |
| Max Buy | ||||||||
Graphic Packaging Hldg CONSUMER NON-DURABLES - Packaging and Containers | $25.42 | +0.42 1.66% | $25.90 | 3,559,749 50 DAV is 2,774,600 | $26.16 -2.85% | 10/25/2022 | $22.75 | PP = $24.17 |
| MB = $25.38 | ||||||||
G - Gapped up today rebounding well above its 50 DMA line ($25.08) with today's 3rd consecutive gain backed by above average volume. It has not formed a sound new base but quickly recovered after testing its 4/27/23 low last week. Reported Mar '23 quarterly earnings +60% on +9% sales revenues versus the year-ago period. >>> FEATURED STOCK ARTICLE : Packaging Firm Due to Report Earnings News - 5/1/2023 | View all notes | Set NEW NOTE alert | Company Profile | SEC News | Chart | Request a new note | ||||||||
Sterling Infrastructure Bldg-Heavy Construction | $49.92 | +0.72 1.46% | $49.97 | 273,814 50 DAV is 241,000 | $49.26 1.34% | 12/14/2022 | $32.41 | PP = $33.72 |
| MB = $35.41 | ||||||||
| Most Recent Note - 6/2/2023 3:50:25 PM G - Hitting another new all-time high with slightly above average volume behind today's big gain. Bullish action has continued although it reported Mar '23 quarterly earnings +0% on +10% sales revenues versus the year-ago period, below the +25% minimum earnings guideline (C criteria) raising fundamental concerns. >>> FEATURED STOCK ARTICLE : 50-Day Moving Average Line Acted as Recent Resistance - 4/28/2023 | View all notes | Set NEW NOTE alert | Company Profile | SEC News | Chart | Request a new note | ||||||||
Comfort Systems USA Bldg-A/C and Heating Prds | $152.28 | -2.58 -1.67% | $153.61 | 239,006 50 DAV is 274,000 | $156.19 -2.50% | 4/27/2023 | $148.85 | PP = $152.23 |
| MB = $159.84 | ||||||||
| Most Recent Note - 6/2/2023 1:26:13 PM Y - Gapped up today, still hovering near its all-time high. No resistance remains due to overhead supply, however, it has made little headway in recent weeks. Subsequent gains and new highs backed by at least +40% above average volume may help reconfirm a technical buy signal. >>> FEATURED STOCK ARTICLE : Churning Action While Recently Hovering Near All-Time High - 5/12/2023 | View all notes | Set NEW NOTE alert | Company Profile | SEC News | Chart | Request a new note | ||||||||
Coca-Cola Femsa ADR Beverages-Non-Alcoholic | $84.67 | +0.90 1.07% | $85.22 | 120,184 50 DAV is 198,000 | $91.23 -7.19% | 3/7/2023 | $76.63 | PP = $77.11 |
| MB = $80.97 | ||||||||
| Most Recent Note - 6/2/2023 1:30:12 PM G - Finding support near its 50 DMA line ($84.35) with today's 2nd gain backed by lighter volume following 7 consecutive losses marked by higher volume. More damaging losses would trigger a technical sell signal. Reported Mar '23 quarterly earnings +53% on +24% sales revenues versus the year-ago period. Prior highs in the $79-$77 area define the next support to watch below its 50 DMA line. >>> FEATURED STOCK ARTICLE : Posted Gain Afrer Reporting Strong Mar '23 Quarterly Results - 5/2/2023 | View all notes | Set NEW NOTE alert | Company Profile | SEC News | Chart | Request a new note | ||||||||
Clean Harbors Pollution Control | $148.97 | -1.94 -1.29% | $150.50 | 230,479 50 DAV is 379,000 | $151.30 -1.54% | 3/10/2023 | $136.89 | PP = $136.74 |
| MB = $143.58 | ||||||||
| Most Recent Note - 6/2/2023 3:52:11 PM G - Hitting a new all-time high with today's big gain backed by near average volume. Found support near its 50 DMA line ($140) this week. More damaging losses would raise greater concerns. Reported Mar '23 quarterly earnings +64% on +12% sales revenues versus the year-ago period. Fundamentals remain strong. >>> FEATURED STOCK ARTICLE : Showed Resilience Near 50-Day Moving Average Following Sell-Off - 5/10/2023 | View all notes | Set NEW NOTE alert | Company Profile | SEC News | Chart | Request a new note | ||||||||
| Symbol/Exchange Company Name Industry Group | PRICE | CHANGE | Day High | Volume (% DAV) (% 50 day avg vol) | 52 Wk Hi | Featured Date | Price Featured | Pivot Featured |
| Max Buy | ||||||||
SPS Commerce Comp Sftwr-Spec Enterprs | $163.94 | +1.21 0.74% | $164.40 | 135,420 50 DAV is 140,000 | $164.69 -0.46% | 4/24/2023 | $150.01 | PP = $157.56 |
| MB = $165.44 | ||||||||
| Most Recent Note - 6/2/2023 4:05:37 PM Y - Posted a 2nd solid gain today after pulling back testing its 50 DMA line ($151.91) following a "negative reversal". When wedging to a new 52-week high the recent gains above the pivot point were not backed by the +40% above average volume needed to trigger a proper technical buy signal. Reported Mar '23 quarterly earnings +22% on +20% versus the year-ago period, below the +25% minimum earnings guideline (C criteria) raising some fundamental concerns. >>> FEATURED STOCK ARTICLE : Pulled Back After Quietly Wedging to New Highs - 5/31/2023 | View all notes | Set NEW NOTE alert | Company Profile | SEC News | Chart | Request a new note | ||||||||
Hubbell Electrical-Power/Equipmt | $294.24 | -0.25 -0.08% | $294.87 | 394,322 50 DAV is 405,000 | $296.28 -0.69% | 4/25/2023 | $262.85 | PP = $257.51 |
| MB = $270.39 | ||||||||
| Most Recent Note - 6/2/2023 4:03:47 PM G - Gapped up today and posted a solid gain with lighter volume for another new all-time high, getting more extended from the prior base. Prior highs in the $263 area define initial support to watch on pullbacks. Fundamentals remain strong. See the latest FSU analysis for more details and an annotated graph. >>> FEATURED STOCK ARTICLE : Extended From Prior Base and Perched Near High - 6/1/2023 | View all notes | Set NEW NOTE alert | Company Profile | SEC News | Chart | Request a new note | ||||||||
NVR Bldg-Resident/Comml | $5,671.20 | -39.80 -0.70% | $5,806.32 | 12,055 50 DAV is 23,000 | $5,986.96 -5.27% | 4/25/2023 | $5,882.18 | PP = $5,978.25 |
| MB = $6,277.16 | ||||||||
| Most Recent Note - 6/2/2023 1:32:19 PM G - Rebounding above its 50 DMA line ($5,693) with today's big gain helping its technical stance. Reported Mar '23 quarterly earnings -14% on -3% sales revenues versus the year-ago period, below the +25% minimum earnings guideline (C criteria) raising fundamental concerns, and its color code was changed to green. Prior quarterly comparisons were well above the +25% minimum earnings guideline (C criteria). Annual earnings (A criteria) growth has been very strong. >>> FEATURED STOCK ARTICLE : Fell From High and Raised Concern With Subpar Mar '23 Report - 4/27/2023 | View all notes | Set NEW NOTE alert | Company Profile | SEC News | Chart | Request a new note | ||||||||
PulteGroup Bldg-Resident/Comml | $69.52 | +0.14 0.19% | $69.78 | 1,593,979 50 DAV is 2,861,000 | $70.54 -1.45% | 4/25/2023 | $65.17 | PP = $64.01 |
| MB = $67.21 | ||||||||
| Most Recent Note - 6/2/2023 4:21:44 PM G - Color code is changed to green after rising back above its "max buy" level. Reported earnings +28% for the Mar '23 quarter versus the year-ago period. Important support to watch is its 50 DMA line ($63.74). See the latest FSU analysis for more details and a new annotated graph. >>> FEATURED STOCK ARTICLE : Rebounded Above "Max Buy" Level Toward Recent High - 6/2/2023 | View all notes | Set NEW NOTE alert | Company Profile | SEC News | Chart | Request a new note | ||||||||
Coca-Cola Consolidated Beverages-Non-Alcoholic | $667.63 | -24.60 -3.55% | $692.36 | 44,666 50 DAV is 33,000 | $694.20 -3.83% | 5/4/2023 | $646.66 | PP = $656.21 |
| MB = $689.02 | ||||||||
Y - Color code is changed to yellow today after pulling back below its "max buy" level. Bullish action came after it reported Mar '23 quarterly earnings +93% on +12% sales revenues versus the year-ago period, continuing its strong earnings track record. >>> FEATURED STOCK ARTICLE : COKE is Showing Real Strength - 5/4/2023 | View all notes | Set NEW NOTE alert | Company Profile | SEC News | Chart | Request a new note | ||||||||
| Symbol/Exchange Company Name Industry Group | PRICE | CHANGE | Day High | Volume (% DAV) (% 50 day avg vol) | 52 Wk Hi | Featured Date | Price Featured | Pivot Featured |
| Max Buy | ||||||||
Amphastar Pharm Medical-Biomed/Biotech | $46.07 | -0.63 -1.35% | $46.70 | 300,809 50 DAV is 391,000 | $46.86 -1.69% | 5/15/2023 | $43.56 | PP = $44.15 |
| MB = $46.36 | ||||||||
| Most Recent Note - 6/2/2023 1:24:42 PM Y - Hitting a new all-time high and trading near its "max buy" level with today's 5th consecutive gain backed by ever-increasing volume but still below the +40% above average volume guideline. Subsequent gains and a strong close above the pivot point backed by at least +40% above average volume may clinch a technical buy signal. Fundamentals remain strong. >>> FEATURED STOCK ARTICLE : Weak Finish After Early Gain When Perched Near All-Time High - 5/15/2023 | View all notes | Set NEW NOTE alert | Company Profile | SEC News | Chart | Request a new note | ||||||||
Arista Networks Computer-Networking | $162.61 | +0.11 0.07% | $164.04 | 1,989,463 50 DAV is 3,237,000 | $178.36 -8.83% | 5/30/2023 | $176.35 | PP = $171.54 |
| MB = $180.12 | ||||||||
| Most Recent Note - 6/2/2023 3:58:23 PM Y - Pulling back again today. Stalled this week after a streak of 4 consecutive volume-driven gains hitting a new high triggered a technical buy signal. Color code was changed to yellow with new pivot point cited based on its 3/23/23 high plus 10 cents in the 5/30/23 mid-day report. Reported Mar '23 quarterly earnings +70% on +54% sales revenues versus the year-ago period and fundamentals remain strong. >>> FEATURED STOCK ARTICLE : Technical Sell Signal Triggered by Damaging Volume-Driven Loss - 5/3/2023 | View all notes | Set NEW NOTE alert | Company Profile | SEC News | Chart | Request a new note | ||||||||
Palo Alto Networks Computer Sftwr-Security | $226.79 | +9.55 4.40% | $230.18 | 13,471,335 50 DAV is 3,903,000 | $219.93 3.12% | 6/5/2023 | $228.35 | PP = $213.73 |
| MB = $224.42 | ||||||||
Y - Color code was changed to yellow in the earlier mid-day report with new pivot point cited based on its 4/20/22 high plus 10 cents. It powered to a new all-time high with today's gap up and 8th consecutive volume-driven gain, however, it is quickly getting extended from the lengthy new base. Share price was impacted by a 3:1 split on 9/14/22. Reported Apr '23 quarterly earnings +83% on +24% sales revenues versus the year-ago period, and prior quarterly comparisons were above the +25% minimum earnings guideline (C criteria). See the latest FSU analysis for more details and a new annotated graph. >>> FEATURED STOCK ARTICLE : Palo Alto Powers to New Highs Again - 6/5/2023 | View all notes | Set NEW NOTE alert | Company Profile | SEC News | Chart | Request a new note | ||||||||
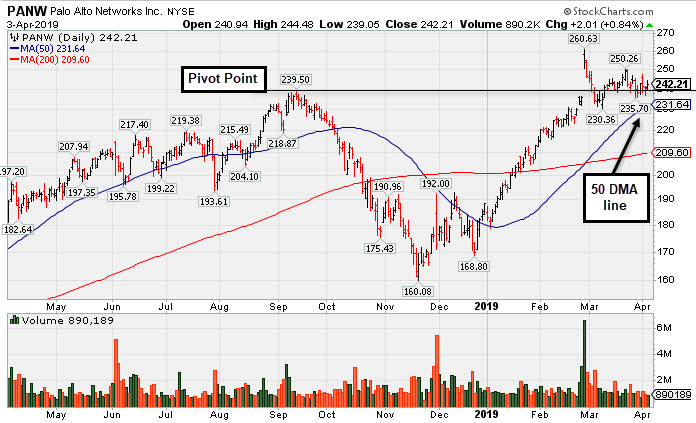
Consolidating Above Prior High and 50-Day Average - Wednesday, April 3, 2019
Palo Alto Networks (PANW +$2.01 or +0.84% to $242.21) volume totals have been cooling while consolidating above its prior low and above its 50-day moving average (DMA) line defining important support to watch in the $230 area.
PANW was highlighted in yellow with pivot point cited based on its 9/13/18 high plus 10 cents in the 2/25/19 mid-day report (read here). Its volume-driven gain left it perched within striking distance of its all-time high after a 23-week cup shaped base which included a slump well below its 200-day moving average (DMA) line.
Fundamentals remained strong as it reported +44% earnings on +30% sales revenues for the Jan '19 quarter, continuing its strong earnings track record. It has an Earnings Per Share (EPS) Rating of 99. It has a strong annual earnings (A criteria) history.
Bullish action came after PANW was last shown in this FSU section on 2/25/29 with an annotated graph under the headline, "Rebounded Near Prior High With Earnings News Due". Members were reminded that it was due to report earnings news after the close on Tuesday, February 26, 2019. Volume and volatility often increase near earnings news.
The number of top-rated funds owning its shares rose from 892 in Jun '17 to 1,146 in Dec '18, a very reassuring sign concerning the I criteria. Its small supply (S criteria) of 93.7 million shares outstanding is another favorable characteristic. Its current Up/Down Volume Ratio of 1.2 is an unbiased indication that over the past 50 days it has been under accumulation. It has an A Timeliness Rating and a B Sponsorship Rating.
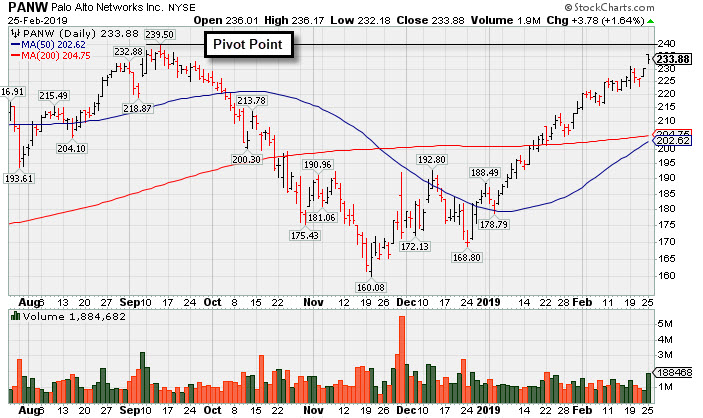
Rebounded Near Prior High With Earnings News Due - Monday, February 25, 2019
Palo Alto Networks (PANW +$3.78 or +1.64% to $233.88) was highlighted in yellow with pivot point cited based on its 9/13/18 high plus 10 cents in the earlier mid-day report (read here). Its volume-driven gain leaves it perched within striking distance of its all-time high after a 23-week cup shaped base which included a slump well below its 200-day moving average (DMA) line.
Members are reminded that it is due to report earnings news after the close on Tuesday, February 26, 2019. Volume and volatility often increase near earnings news. Fundamentals remained strong while it went through the deep consolidation since dropped from the Featured Stocks list on 10/19/18. It reported +39% earnings on +29% sales revenues for the Jul '18 quarter, continuing its strong earnings track record. It has an Earnings Per Share (EPS) Rating of 99. It has a strong annual earnings (A criteria) history.
PANW was last shown in this FSU section on 10/18/18 with an annotated graph under the headline, "Consolidating Above 200-Day Moving Average Line". The number of top-rated funds owning its shares rose from 892 in Jun '17 to 1,149 in Dec '18, a very reassuring sign concerning the I criteria. Its small supply (S criteria) of 94.9 million shares outstanding is another favorable characteristic. Its current Up/Down Volume Ratio of 1.5 is an unbiased indication that over the past 50 days it has been under accumulation. It has an A Timeliness Rating and a B Sponsorship Rating.
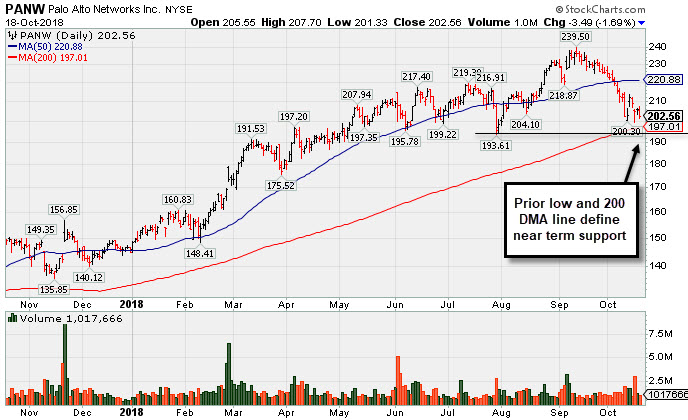
Consolidating Above 200-Day Moving Average Line - Thursday, October 18, 2018
Palo Alto Networks (PANW -$3.36 or -1.63% to $202.69) is consolidating above its 200-day moving average (DMA) line ($197) and prior low define the next important support level to watch. A rebound above the 50-day moving average (DMA) line ($220.88) is needed for its outlook to improve.
Recently it reported +39% earnings on +29% sales revenues for the Jul '18 quarter, continuing its strong earnings track record. It has an Earnings Per Share (EPS) Rating of 98. It has a strong annual earnings (A criteria) history. PANW was last shown in this FSU section on 7/31/18 with an annotated graph under the headline, "Violated 50-day Average With Volume-driven Loss". It was noted in the 6/12/18 mid-day report (read here) that a valid secondary buy point existed from the 10 WMA line up to 5% above the most recent high ($214.69) or $225.42.
The number of top-rated funds owning its shares rose from 892 in Jun '17 to 1,133 in Sep '18, a very reassuring sign concerning the I criteria. Its small supply (S criteria) of 93.8 million shares outstanding is another favorable characteristic. Its current Up/Down Volume Ratio of 0.8 is an indication that over the past 50 days it has been under distributional pressure. It has an A Timeliness Rating and a B Sponsorship Rating.
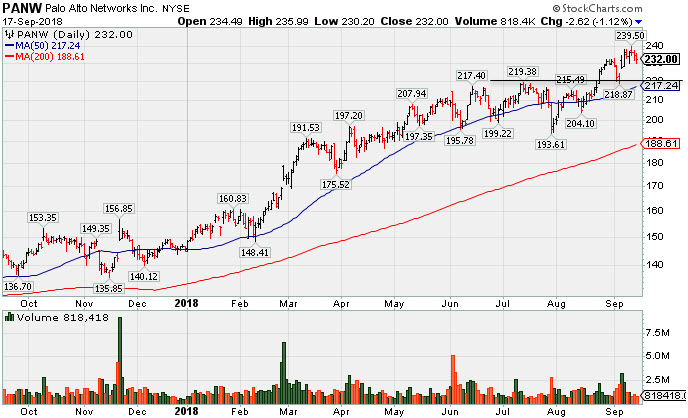
Perched Near All-Time High With Volume Totals Cooling - Monday, September 17, 2018
Palo Alto Networks (PANW -$2.62 or -1.12% to $232.00) has been stubbornly holding its ground near its all-time high with volume totals cooling following volume-driven gains. On pullbacks its 50-day moving average DMA line ($217.24) defines near-term support along with prior highs in the $219 area.
Recently it reported +39% earnings on +29% sales revenues for the Jul '18 quarter, continuing its strong earnings track record. It has an Earnings Per Share (EPS) Rating of 98. It has a strong annual earnings (A criteria) history. PANW found prompt support after last shown in this FSU section on 7/31/18 with an annotated graph under the headline, "Violated 50-day Average With Volume-driven Loss". It was noted in the 6/12/18 mid-day report (read here) that a valid secondary buy point existed from the 10 WMA line up to 5% above the most recent high ($214.69) or $225.42.
The number of top-rated funds owning its shares rose from 892 in Jun '17 to 1,078 in Jun '18, a very reassuring sign concerning the I criteria. Its small supply (S criteria) of 93.8 million shares outstanding is another favorable characteristic. Its current Up/Down Volume Ratio of 1.2 is an indication that over the past 50 days it has been under accumulation. It has an A Timeliness Rating and a B Sponsorship Rating.
Violated 50-day Average With Volume-driven Loss - Tuesday, July 31, 2018
Palo Alto Networks (PANW +$2.60 or +1.33% to $198.26) slumped well below its 50-day moving average (DMA) line ($208.87) with a damaging volume-driven loss on the prior session also undercutting the prior low ($199.22 on 6/28/18) triggering technical sell signals. Its color code was changed to green. A prompt rebound above the 50 DMA line is needed for its outlook to improve.
PANW was last shown in this FSU section on 6/13/18 with an annotated graph under the headline, "New High Close After 2 Consecutive Volume Driven Gains". It was noted in the 6/12/18 mid-day report (read here) that a valid secondary buy point exists from the 10 WMA line up to 5% above the most recent high ($214.69) or $225.42.
It has an Earnings Per Share (EPS) Rating of 99, the highest possible rating. It has a strong annual earnings (A criteria) history. Recently it reported earnings +62% on +31% sales revenues for the Apr '18 quarter, continuing its strong earnings track record.
The number of top-rated funds owning its shares rose from 892 in Jun '17 to 984 in Jun '18, a very reassuring sign concerning the I criteria. Its small supply (S criteria) of 92.9 million shares outstanding is another favorable characteristic. Its current Up/Down Volume Ratio of 0.8 is slightly bearish, while it has an A Timeliness Rating and a B Sponsorship Rating.
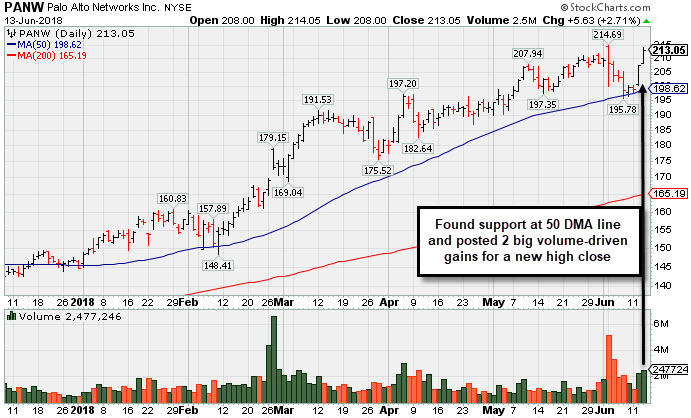
New High Close After 2 Consecutive Volume Driven Gains - Wednesday, June 13, 2018
Palo Alto Networks (PANW +$5.63 or +2.71% to $213.05) posted a 2nd consecutive volume-driven gain and finished at a best ever close today. It found support at its 10-week moving average following a "negative reversal" on 6/04/18 after an earlier breakout. It was noted in the 6/12/18 mid-day report (read here) that a valid secondary buy point exists from the 10 WMA line up to 5% above the most recent high ($214.69) or $225.42.
It has an Earnings Per Share (EPS) Rating of 99, the highest possible rating. It has a strong annual earnings (A criteria) history. Recently it reported earnings +62% on +31% sales revenues for the Apr '18 quarter, continuing its strong earnings track record. It went through a deep consolidation since dropped from the Featured Stocks list on 1/07/16. It was last shown in this FSU section with annotated graph on 12/29/15 under the headline, "Halted Slide at 50-Day Moving Average".
The number of top-rated funds owning its shares rose from 892 in Jun '17 to 969 in Mar '18, a very reassuring sign concerning the I criteria. Its small supply (S criteria) of 92.9 million shares outstanding is another favorable characteristic. Its current Up/Down Volume Ratio of 1.1 is slightly bullish, and it has an A Timeliness Rating and a B Sponsorship Rating.
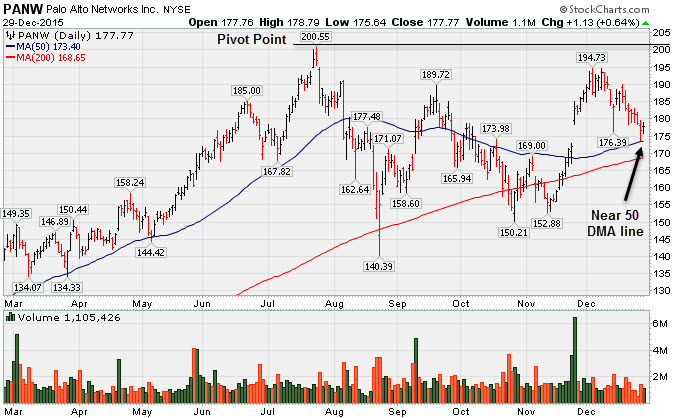
Halted Slide at 50-Day Moving Average - Tuesday, December 29, 2015
Palo Alto Networks (PANW +$+1.13 or +0.64% to $177.77) encountered distributional pressure with a streak of consecutive losses testing its 50-day moving average (DMA) line this week. Since featured in the 12/14/15 mid-day report it has not produced the volume-driven gains for new highs needed to trigger a new technical buy signal. It was last shown in this FSU section with annotated graphs on 12/14/15 under the headline, "Perched Within Striking Distance of Highs Again". It was highlighted in yellow with new pivot point cited based on its 7/24/15 high plus 10 cents in the 12/14/15 mid-day report (read here).
Members were previously reminded - "Disciplined investors will note that 3 out of 4 stocks typically move in the same direction as the major averages. For now, PANW might be added back to investors' watch lists until strength returns to the broader market, and then a new technical breakout might justify action."
The Computer Software - Security firm reported strong sales revenues +133% and earnings +55% for the Oct '15 quarter, and fundamentals remain strong. The past 6 consecutive comparisons came with strong sales revenues increases and earnings above the +25% minimum guideline satisfying the C criteria. Sequentially, it has shown mostly encouraging acceleration with earnings increases of +57%, +88%, +90%, +109%, +155% and +133% in the Jul, Oct '14, Jan, Apr, Jul, and Oct '15 quarters, respectively, versus the year ago periods. It has an Earnings Per Share (EPS) Rating of 99, the highest possible rating. It has a strong annual earnings (A criteria) history.
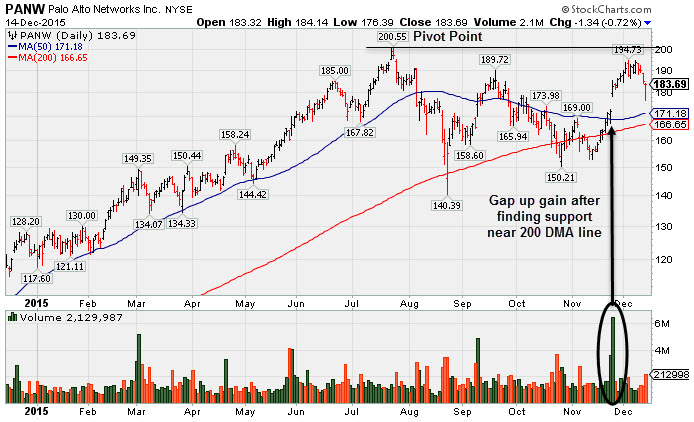
Perched Within Striking Distance of Highs Again - Monday, December 14, 2015
Palo Alto Networks (PANW -$1.34 or -0.72% to $183.69) was highlighted in yellow with new pivot point cited based on its 7/24/15 high plus 10 cents in the earlier mid-day report (read here). It is consolidating within striking distance of its 52-week high. Subsequent volume-driven gains for new highs may trigger a new technical buy signal.
Disciplined investors will note that 3 out of 4 stocks typically move in the same direction as the major averages, and recent deterioration in the major indices has raised concerns regarding the M criteria. For now, PANW might be added back to investors' watch lists until strength returns to the broader market, and then a new technical breakout might justify action.
The Computer Software - Security firm reported strong sales revenues +133% and earnings +55% for the Oct '15 quarter, and fundamentals remain strong. The past 6 consecutive comparisons came with strong sales revenues increases and earnings above the +25% minimum guideline satisfying the C criteria. Sequentially, it has shown mostly encouraging acceleration with earnings increases of +57%, +88%, +90%, +109%, +155% and +133% in the Jul, Oct '14, Jan, Apr, Jul, and Oct '15 quarters, respectively, versus the year ago periods. It has an Earnings Per Share (EPS) Rating of 99, the highest possible rating. It has a strong annual earnings (A criteria) history.
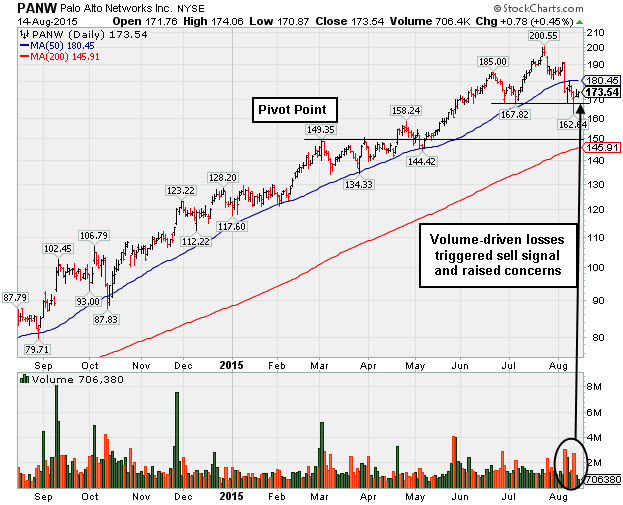
It found support near its 200-day moving average (DMA) line after dropped from the Featured Stocks list on 8/20/15 due to technical deterioration. It was last shown in this FSU section with annotated graphs on 8/14/15 under the headline, "Following Damaging Losses Gains Came With Light Volume". It had violated its 50-day moving average (DMA) line with a damaging volume-driven loss on 8/06/15 and triggered a technical sell signal. Subsequent damaging losses below the 8/12/15 low ($171.00) raised more serious concerns.
Following Damaging Losses Gains Came With Light Volume - Friday, August 14, 2015
PANW reported earnings +109% on +55% sales revenues for the Apr '15 quarter, its 4th consecutive comparison with strong sales revenues increases and earnings above the +25% minimum guideline satisfying the C criteria. Sequentially, it has shown encouraging acceleration with earnings increases of +57%, +88%, +90%, and +109% in the Jul '14, Oct '14, Jan '15 and Apr '15 quarters, respectively, versus the year ago periods. It has an Earnings Per Share (EPS) Rating of 99, the highest possible rating. It has a strong annual earnings (A criteria) history.
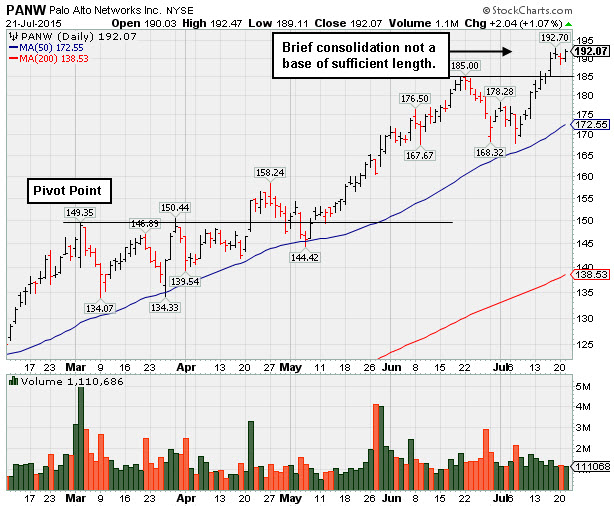
Wedging to New Highs After Brief Consolidation - Tuesday, July 21, 2015
PANW reported earnings +109% on +55% sales revenues for the Apr '15 quarter, its 4th consecutive comparison with strong sales revenues increases and earnings above the +25% minimum guideline satisfying the C criteria. Sequentially, it has shown encouraging acceleration with earnings increases of +57%, +88%, +90%, and +109% in the Jul '14, Oct '14, Jan '15 and Apr '15 quarters, respectively, versus the year ago periods. It has an Earnings Per Share (EPS) Rating of 99, the highest possible rating. It has a strong annual earnings (A criteria) history.
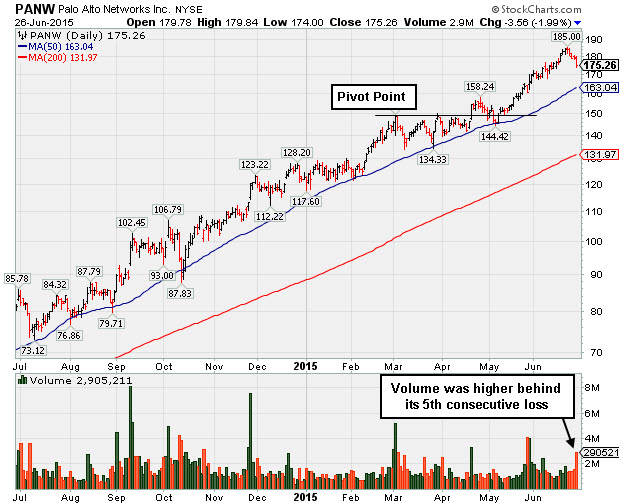
Higher Volume Loss a Sign of Distributional Pressure - Friday, June 26, 2015
Palo Alto Networks (PANW -$3.56 or -1.99% to $175.26) showed signs of distributional pressure as it pulled back today on higher volume for its 5th consecutive loss while retreating from its all-time high. It has been repeatedly noted as "extended from any sound base". It remains well above its 50-day moving average (DMA) line ($163.04) defining important near-term support where a violation would trigger a technical sell signal.
The Computer Software - Security firm was last shown in this FSU section with annotated graphs on 6/03/15 under the headline, "Holding Ground Stubbornly at All-Time Highs Following +123% Rally". Disciplined investors avoid chasing stocks more than +5% above their pivot point or prior highs. It traded up as much as +144% rise since first highlighted at $75.95 in yellow back on May 29, 2014 when breakout out of a "double bottom" base pattern.
PANW reported earnings +109% on +55% sales revenues for the Apr '15 quarter, its 4th consecutive comparison with strong sales revenues increases and earnings above the +25% minimum guideline satisfying the C criteria. Sequentially, it has shown encouraging acceleration with earnings increases of +57%, +88%, +90%, and +109% in the Jul '14, Oct '14, Jan '15 and Apr '15 quarters, respectively, versus the year ago periods. It has an Earnings Per Share (EPS) Rating of 99, the highest possible rating. It has a strong annual earnings (A criteria) history.
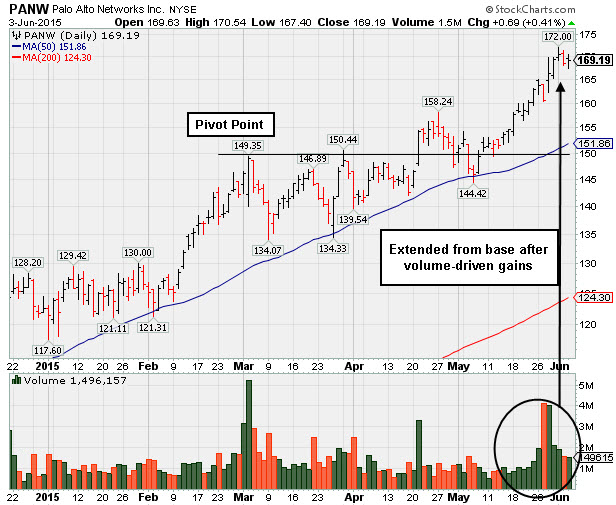
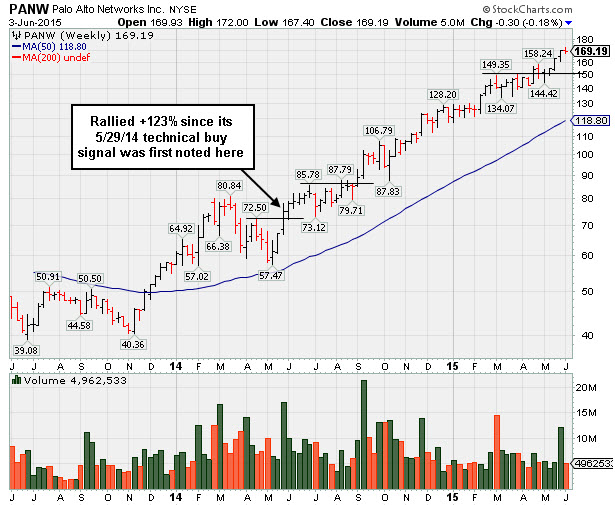
Holding Ground Stubbornly at All-Time Highs Following +123% Rally - Wednesday, June 3, 2015
Palo Alto Networks (PANW +$0.69 or +0.41% to $ 169.19) is extended from its latest base. Disciplined investors avoid chasing stocks more than +5% above their pivot point or prior highs. Prior highs in the $158 area define initial support above the 50-day moving average (DMA) line, where subsequent violations would raise concerns and may trigger a technical sell signal.The Computer Software - Security firm was last shown in this FSU section with annotated graphs on 5/11/15 under the headline, "Found Support at 50-Day Moving Average During Ongoing Ascent". That important short-term average has acted as support throughout its ongoing advance. The weekly graph, as seen on the daily graph below. The weekly graphs which follows illustrates its +123% rise since first highlighted in yellow back on May 29, 2014 when breakout out of a "double bottom" base pattern.
It reported earnings +109% on +55% sales revenues for the Apr '15 quarter, its 4th consecutive comparison with strong sales revenues increases and earnings above the +25% minimum guideline satisfying the C criteria. Sequentially, it has shown encouraging acceleration with earnings increases of +57%, +88%, +90%, and +109% in the Jul '14, Oct '14, Jan '15 and Apr '15 quarters, respectively, versus the year ago periods. It has an Earnings Per Share (EPS) Rating of 99, the highest possible rating. It has a strong annual earnings (A criteria) history.
The number of top-rated funds owning its shares rose from 246 in Jun '13 to 721 in Mar '15, a very reassuring sign concerning the I criteria. Its small supply (S criteria) of 69.4 million shares in the public float is another favorable characteristic.
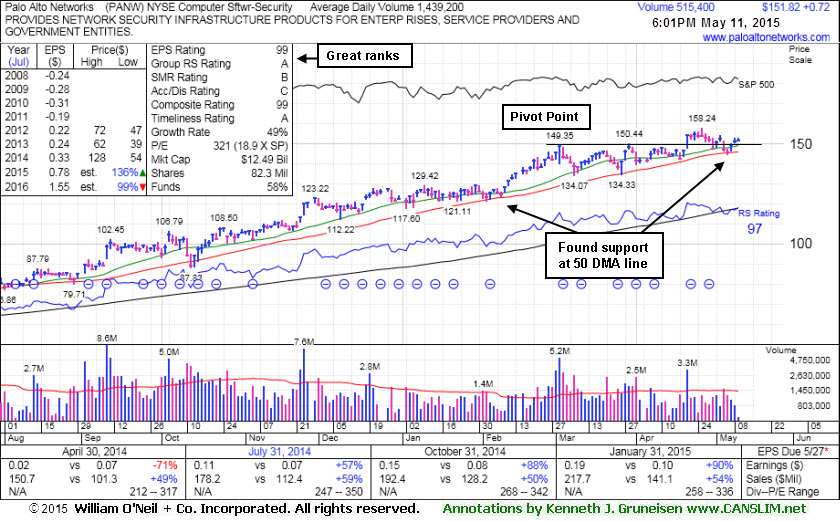
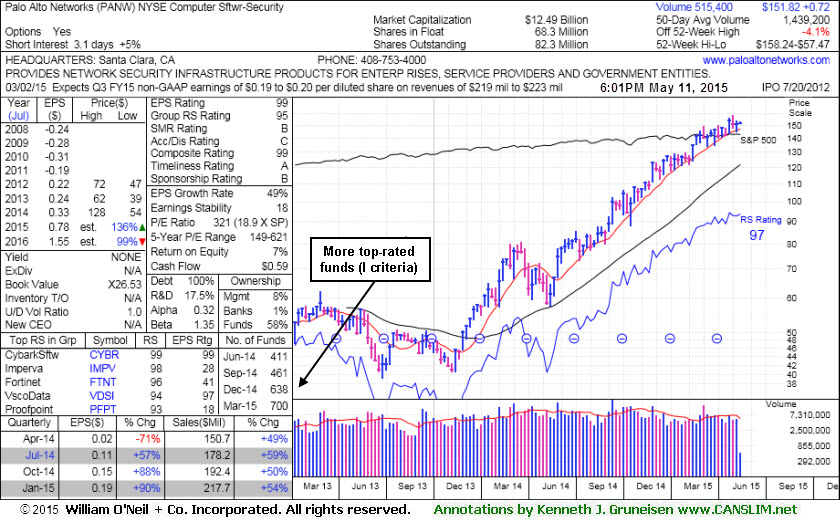
Found Support at 50-Day Moving Average During Ongoing Ascent - Monday, May 11, 2015
Palo Alto Networks (PANW +$0.72 or +0.48% to $151.82) found support at its 50-day moving average (DMA) line ($146.08) recently. That important short-term average has acted as support throughout its ongoing advance. The volume totals have been below average while consolidating, however it has made little headway since triggering a new technical buy signal with a volume-driven gain on 4/21/15. Subsequent damaging losses below the 50 DMA line may trigger a technical sell signal. Keep in mind that 3 out of 4 stocks follow the direction of the broader market averages (M criteria).
The Computer Software - Security firm was last shown in this FSU section with annotated graphs on 4/17/15 under the headline, " Consolidating Above 50-Day Moving Average Line". It reported earnings +90% on +54% sales revenues for the Jan '15 quarter, its 3rd consecutive comparison with strong sales revenues increases and earnings above the +25% minimum guideline satisfying the C criteria. It now has an Earnings Per Share (EPS) Rating of 99, the highest possible rating. It has a strong annual earnings (A criteria) history.
The number of top-rated funds owning its shares rose from 246 in Jun '13 to 700 in Mar '15, a very reassuring sign concerning the I criteria. Its small supply (S criteria) of 68.3 million shares in the public float is another favorable characteristic.
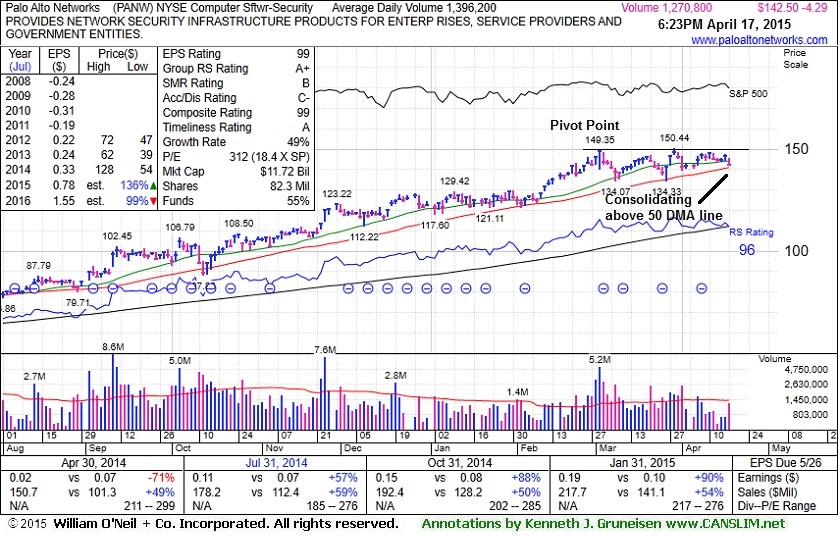
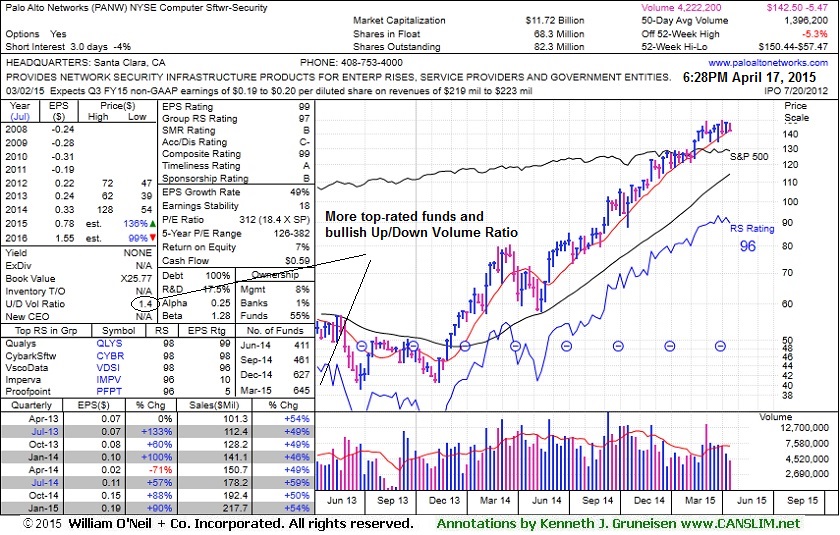
Consolidating Above 50-Day Moving Average Line - Friday, April 17, 2015
Palo Alto Networks (PANW -$4.29 or -2.92% to $142.50) volume totals have generally been cooling while hovering near its all-time high. Its 50-day moving average (DMA) line ($140.97)and recent lows near $134 define near term support. Subsequent violations would raise concerns and trigger technical sell signals. When recently wedging to a new high (N criteria) gains were backed by sub par volume and members were cautioned - "Stocks should have at least +40% above average volume while rising above the pivot point to clinch a proper new (or add-on) technical buy signal."The Computer Software - Security firm was last shown in this FSU section with annotated graphs on 3/27/15 under the headline, "Latest Consolidation is a Short New "Square Box" Base". Subsequent volume-driven gains above the new pivot point cited may trigger a new (or add-on) technical buy signal.
The Computer Software - Security firm It reported earnings +90% on +54% sales revenues for the Jan '15 quarter, its 3rd consecutive comparison with strong sales revenues increases and earnings above the +25% minimum guideline satisfying the C criteria. It now has an Earnings Per Share (EPS) Rating of 99, the highest possible rating. It has a strong annual
earnings (A criteria) history.It has a bullish Up/Down Volume Ratio of 1.4, an unbiased indication its shares have been under accumulation over the past 50 days. The number of top-rated funds owning its shares rose from 246 in Jun '13 to 645 in Mar '15, a very reassuring sign concerning the I criteria. Its small supply (S criteria) of 68.3 million shares in the public float is another favorable characteristic.
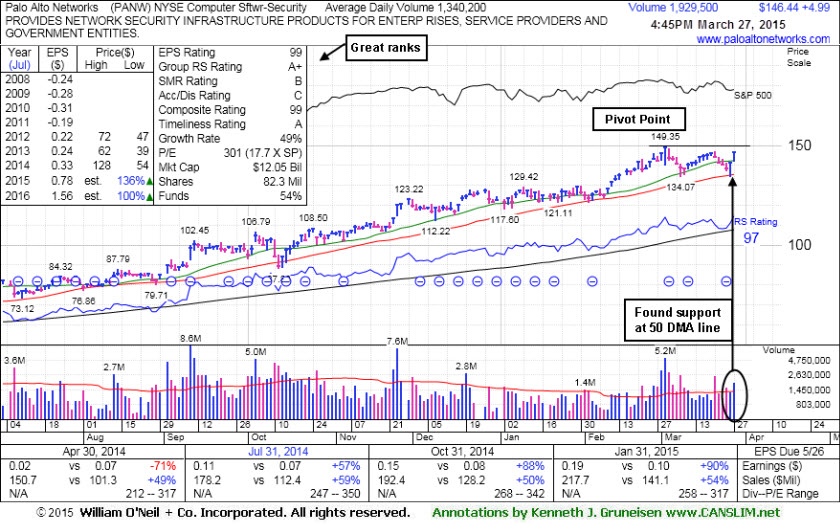
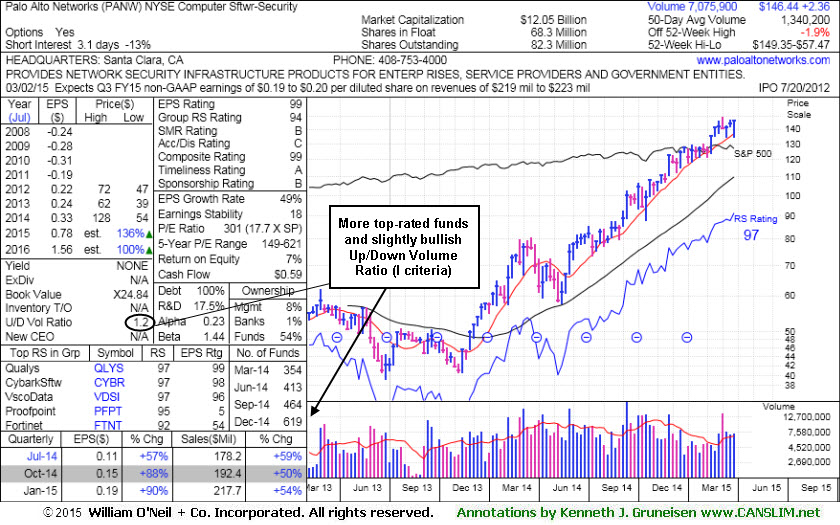
Latest Consolidation is a Short New "Square Box" Base - Friday, March 27, 2015
Palo Alto Networks (PANW +$4.99 or +3.53% to $146.44) found support at its 50-day moving average (DMA) line and near prior lows, then posted a gain today backed by above average volume. It has formed a 4-week "square box" type base pattern. Subsequent volume-driven gains above the new pivot point cited may trigger a new (or add-on) technical buy signal. Meanwhile, any weakness leading to damaging violations of the 50 DMA line and recent low may trigger worrisome technical sell signals.
The Computer Software - Security firm was last shown in this FSU section with annotated graphs on 3/12/15 under the headline, "Fundamentals Improved But No New Base Has Formed". It reported earnings +90% on +54% sales revenues for the Jan '15 quarter, its 3rd consecutive comparison with strong sales revenues increases and earnings above the +25% minimum guideline satisfying the C criteria. It now has an Earnings Per Share (EPS) Rating of 99, the highest possible rating. It has a strong annual earnings (A criteria) history.
It has a slightly bullish Up/Down Volume Ratio of 1.2, an unbiased indication its shares have been under accumulation over the past 50 days. The number of top-rated funds owning its shares rose from 246 in Jun '13 to 619 in Dec '14, a very reassuring sign concerning the I criteria. Its small supply (S criteria) of 68.3 million shares in the public float is another favorable characteristic.
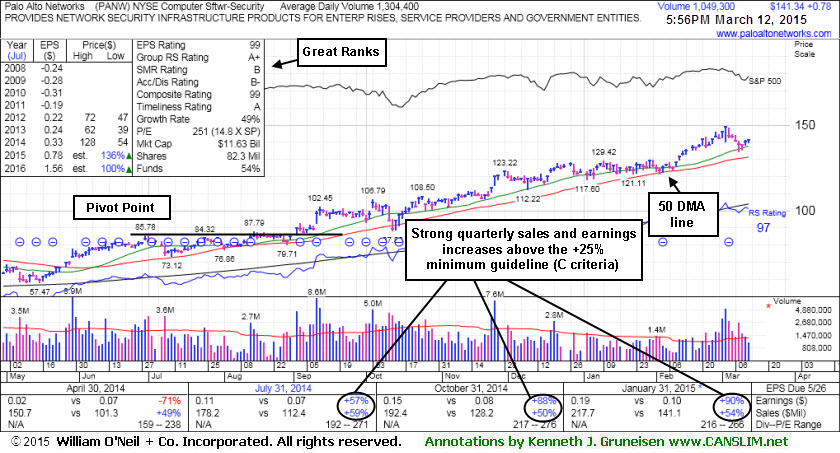
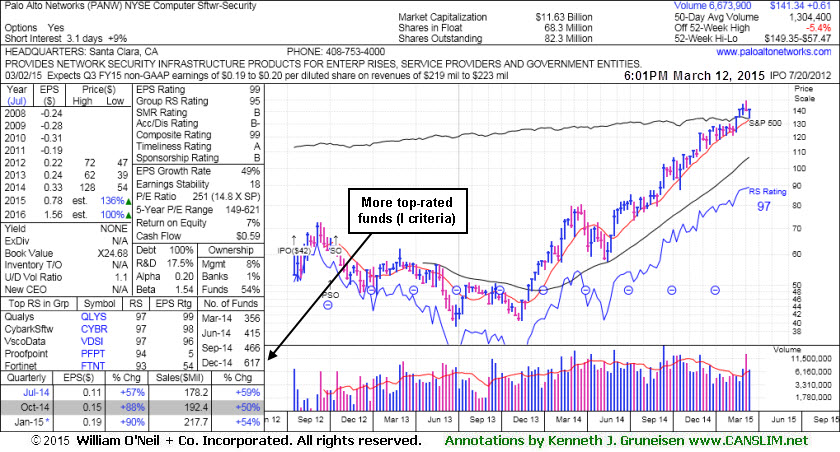
Fundamentals Improved But No New Base Has Formed - Thursday, March 12, 2015
Palo Alto Networks (PANW +$0.61 or +0.43% to $141.17) saw recent losses with above average volume while consolidating above its 50-day moving average (DMA) line. That important short-term average (now $131.38) defines near-term support to watch on pullbacks where a violation may trigger a technical sell signal. Recent losses on above average volume were indicative of distributional pressure and it is very extended from any sound base. Disciplined investors avoid chasing extended stocks more the +5% above prior highs and they always limit losses by selling any stock that falls more than -7% from their purchase price.
PANW reported earnings +90% on +54% sales revenues for the Jan '15 quarter, its 3rd consecutive comparison with strong sales revenues increases and earnings above the +25% minimum guideline satisfying the C criteria. It now has an Earnings Per Share (EPS) Rating of 99. It has a strong annual earnings (A criteria) history.
The Computer Software - Security firm was last shown in this FSU section with annotated graphs on 2/23/15 under the headline, "Reversed Into Red After Touching a New High". After breaking out 9/02/14 it has spent very little time basing, and it is very extended from any sound base, yet could produce more climactic gains.
The number of top-rated funds owning its shares rose from 246 in Jun '13 to 617 in Dec '14, a reassuring sign concerning the I criteria. Its small supply (S criteria) of 68.3 million shares in the public float is another favorable characteristic.
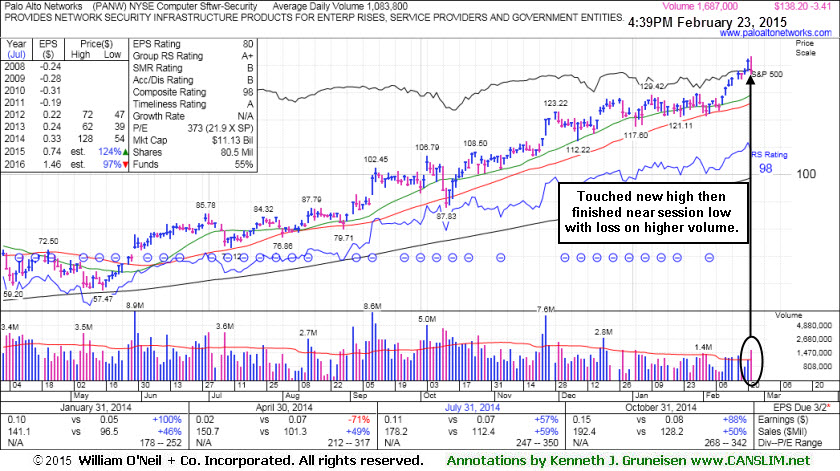
Reversed Into Red After Touching a New High - Monday, February 23, 2015
Palo Alto Networks (PANW -$3.41 or -2.41% to $138.20) reversed into the red and ended near the session low today with a loss on higher volume indicative of distributional pressure. It is very extended from any sound base. Its 50-day moving average (DMA) line defines near-term support where a violation may trigger a technical sell signal.
Disciplined investors avoid chasing extended stocks more the +5% above prior highs and they always limit losses by selling any stock that falls more than -7% from their purchase price. The Computer Software - Security firm was last shown in this FSU section with annotated graphs on 1/28/15 under the headline, "Finished With a Loss and Near Session Low After Chance at Best-Ever Close".
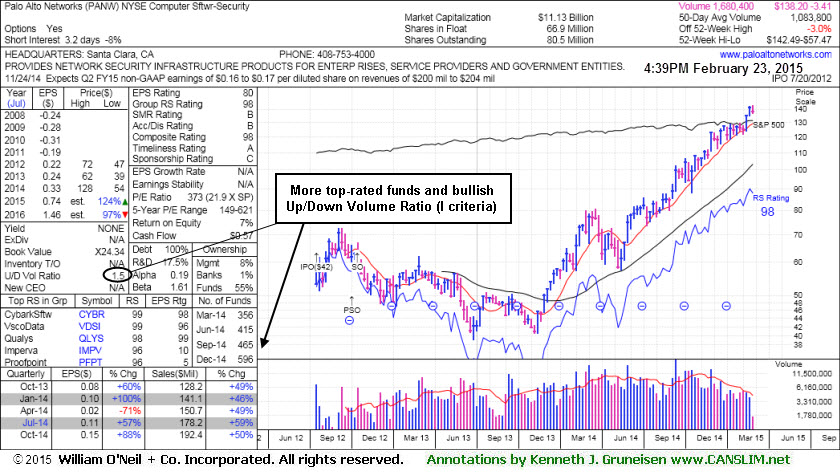
The number of top-rated funds owning its shares rose from 246 in Jun '13 to 596 in Dec '14, a reassuring sign concerning the I criteria. Its small supply (S criteria) of 66.9 million shares in the public float is another favorable characteristic. Its current Up/Down Volume Ratio of 1.5 is an unbiased indication its shares have been under accumulation over the past 50 days.
It recently reported earnings +88% on +50% sales revenues for the Oct '14 quarter. It has an Earnings Per Share (EPS) Rating of 80. Reviewing prior reports with annotated graphs carefully, it appears that the Apr '14 quarter now shows a -71% earnings comparison versus the year ago period. Previous annotated graphs published showed a more favorable comparison with strong sales revenues increases and earnings above the +25% minimum guideline satisfying the C criteria. It is unclear what prompted the apparent adjustment in the numbers as reported by the graph provider. Members are reminded that the fact-based investment system suggests waiting for the right time to buy, and only buying stocks showing strong quarterly and annual earnings (A criteria) increases.
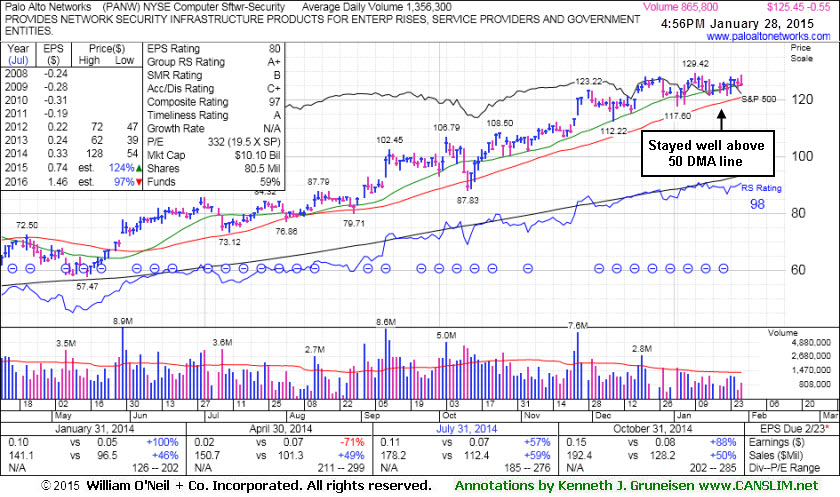
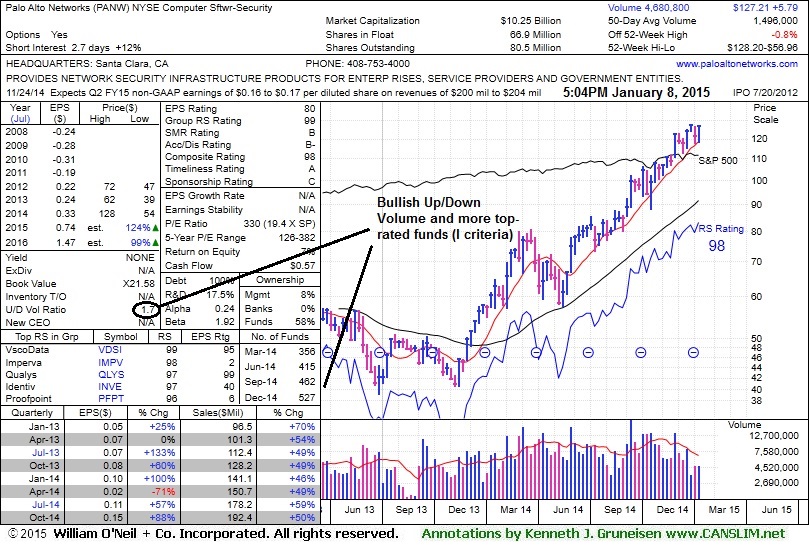
Finished With a Loss and Near Session Low After Chance at Best-Ever Close - Wednesday, January 28, 2015
Palo Alto Networks (PANW -$0.55 or -0.44% to $125.45) finished near the session low with a loss after early gains had it poised for a best-ever close. It has seen volume totals generally cooling in recent weeks while consolidating well above its 50-day moving average (DMA) line ($120.77). That short-term average and the recent low ($117.60 on 1/02/15) define important near-term support to watch where violations may trigger technical sell signals.
The Computer Software - Security firm was last shown in this FSU section with annotated graphs on 1/08/15 under the headline, "Tech Firm Still Extended From Any Sound Base Pattern", and gains since have come with lighter than average volume. Disciplined investors avoid chasing extended stocks more the +5% above prior highs and they always limit losses by selling any stock that falls more than -7% from their purchase price.
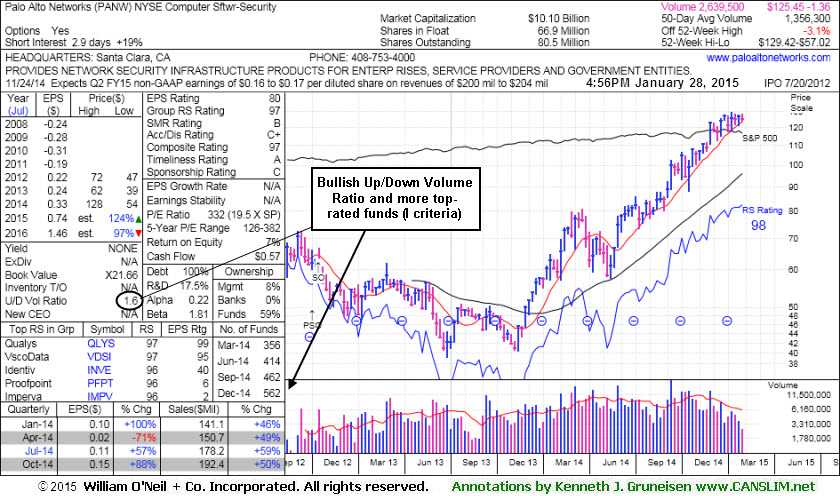
The number of top-rated funds owning its shares rose from 246 in Jun '13 to 562 in Dec '14, a reassuring sign concerning the I criteria. Its small supply (S criteria) of 66.9 million shares in the public float is another favorable characteristic. Its current Up/Down Volume Ratio of 1.6 is an unbiased indication its shares have been under accumulation over the past 50 days.
It recently reported earnings +88% on +50% sales revenues for the Oct '14 quarter. It has an Earnings Per Share (EPS) Rating of 80. Reviewing prior reports with annotated graphs carefully, it appears that the Apr '14 quarter now shows a -71% earnings comparison versus the year ago period. Previous annotated graphs published showed a more favorable comparison with strong sales revenues increases and earnings above the +25% minimum guideline satisfying the C criteria. It is unclear what prompted the apparent adjustment in the numbers as reported by the graph provider. Members are reminded that the fact-based investment system suggests waiting for the right time to buy, and only buying stocks showing strong quarterly and annual earnings (A criteria) increases.
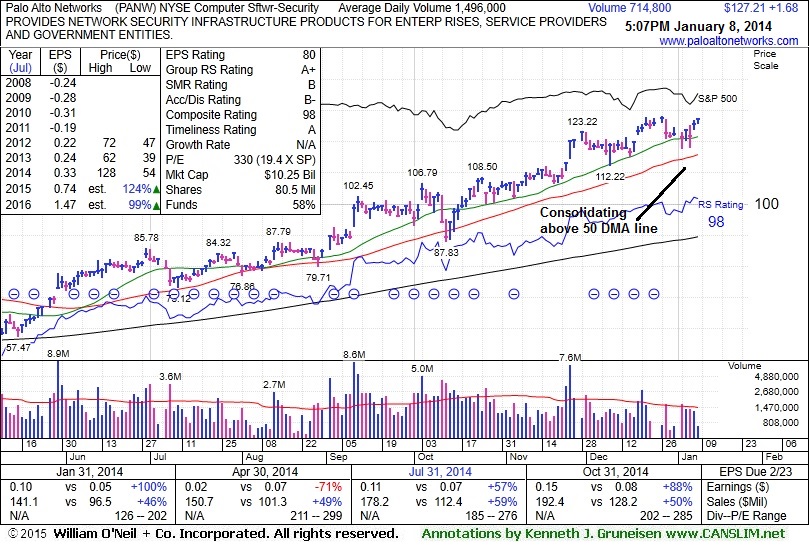
Tech Firm Still Extended From Any Sound Base Pattern - Thursday, January 08, 2015
Palo Alto Networks (PANW +$1.68 or +1.34% to $127.21) posted a 2nd consecutive gain today with much lighter than average volume. Disciplined investors avoid chasing extended stocks more the +5% above prior highs and they always limit losses by selling any stock that falls more than -7% from their purchase price. PANW is currently extended from any sound base pattern, and prior reports cautioned members - "It has not formed a sound base. The 50 DMA line defines near-term support to watch below recent lows." The Computer Software - Security firm was last shown in this FSU section with annotated graphs on 12/18/14 under the headline, "Latest Consolidation Was Not a Base of Sufficient Length".
The number of top-rated funds owning its shares rose from 246 in Jun '13 to 527 in Sep '14, a reassuring sign concerning the I criteria. Its small supply (S criteria) of 66.9 million shares in the public float is another favorable characteristic. Its current Up/Down Volume Ratio of 1.7 is an unbiased indication its shares have been under accumulation over the past 50 days.
It recently reported earnings +88% on +50% sales revenues for the Oct '14 quarter. It has an Earnings Per Share (EPS) Rating of 80. Reviewing prior reports with annotated graphs carefully, it appears that the Apr '14 quarter now shows a -71% earnings comparison versus the year ago period. Previous annotated graphs published showed a more favorable comparison with strong sales revenues increases and earnings above the +25% minimum guideline satisfying the C criteria. It is unclear what prompted the apparent adjustment in the numbers as reported by the graph provider. Members are reminded that the fact-based investment system suggests waiting for the right time to buy, and only buying stocks showing strong quarterly and annual earnings (A criteria) increases.
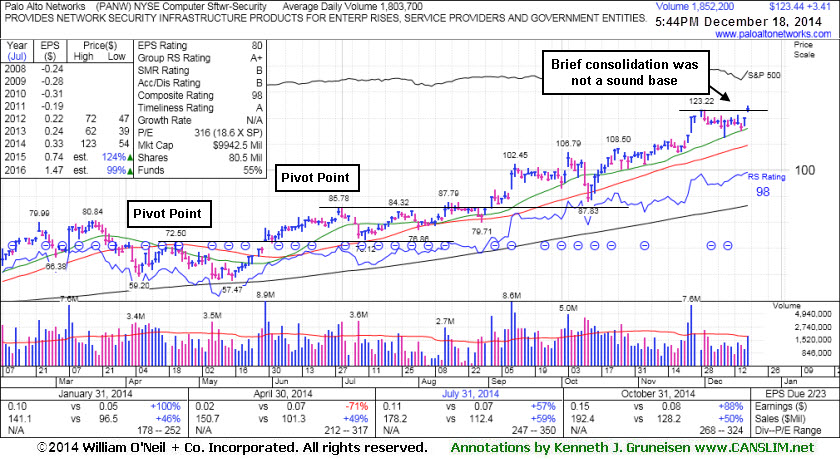
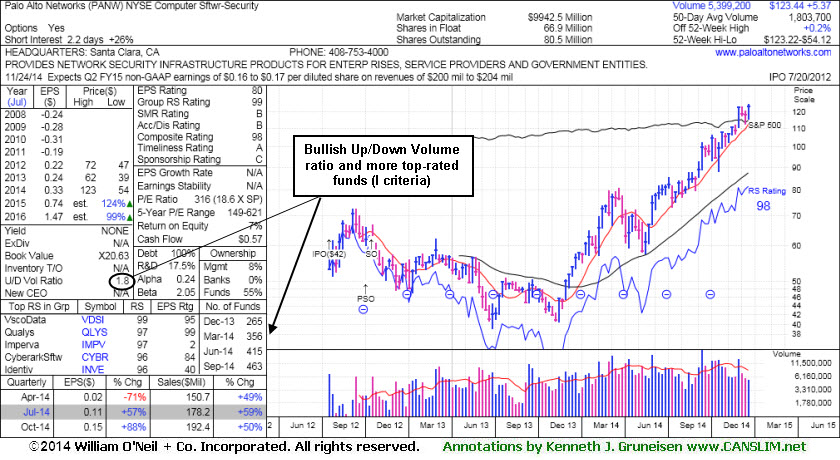
Latest Consolidation Was Not a Base of Sufficient Length - Thursday, December 18, 2014
Palo Alto Networks (PANW -$3.29 or -2.67% to $119.71) gapped up and hit new all-time highs with average volume behind today's gain. It has not formed any sound base of sufficient length. The 50-day moving average (DMA) line defines near-term support to watch below recent lows. It recently reported earnings +88% on +50% sales revenues for the Oct '14 quarter. PANW was last shown in this FSU section with annotated graphs on 12/01/14 under the headline, "Under Accumulation But Extended From Sound Base". Disciplined investors avoid chasing extended stocks more the +5% above prior highs and they always limit losses by selling any stock that falls more than -7% from their purchase price.
The number of top-rated funds owning its shares rose from 246 in Jun '13 to 463 in Sep '14, a reassuring sign concerning the I criteria. Its small supply (S criteria) of 66.9 million shares in the public float is another favorable characteristic. Its current Up/Down Volume Ratio of 1.8 is an unbiased indication its shares have been under accumulation over the past 50 days.
The Computer Software - Security firm has an Earnings Per Share (EPS) Rating of 80. Reviewing prior reports with annotated graphs carefully, it appears that the Apr '14 quarter now shows a -71% earnings comparison versus the year ago period. Previous annotated graphs published showed a more favorable comparison with strong sales revenues increases and earnings above the +25% minimum guideline satisfying the C criteria. It is unclear what prompted the apparent adjustment in the numbers as reported by the graph provider. Members are reminded that the fact-based investment system suggests waiting for the right time to buy, and only buying stocks showing strong quarterly and annual earnings (A criteria) increases.
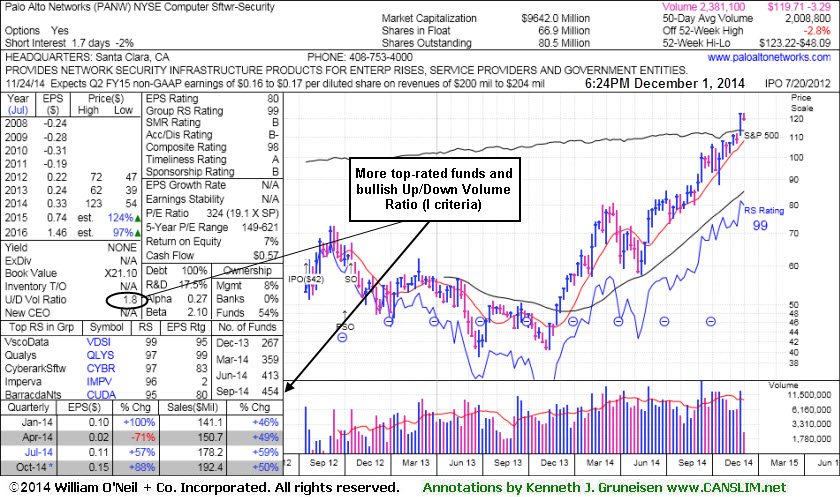
Under Accumulation But Extended From Sound Base - Monday, December 01, 2014
Palo Alto Networks (PANW -$3.29 or -2.67% to $119.71) pulled back from its all-time high with today's loss on near average volume. It has not formed a sound base lately, and the 50-day moving average (DMA) line defines near-term support to watch.The number of top-rated funds owning its shares rose from 246 in Jun '13 to 454 in Sep '14, a reassuring sign concerning the I criteria. Its small supply (S criteria) of 66.9 million shares in the public float is another favorable characteristic. Its current Up/Down Volume Ratio of 1.8 is an unbiased indication its shares have been under accumulation over the past 50 days. PANW was last shown in this FSU section with annotated graphs on 11/13/14 under the headline, "Finished Near Session Low With Small Gain on Light Volume". Disciplined investors avoid chasing extended stocks more the +5% above prior highs and they always limit losses by selling any stock that falls more than -7% from their purchase price.
It reported earnings +88% on +50% sales revenues for the Oct '14 quarter.
The Computer Software - Security firm has an Earnings Per Share (EPS) Rating of 80. Reviewing prior reports with annotated graphs carefully, it appears that the Apr '14 quarter now shows a -71% earnings comparison versus the year ago period. Previous annotated graphs published showed a more favorable comparison with strong sales revenues increases and earnings above the +25% minimum guideline satisfying the C criteria. It is unclear what prompted the apparent adjustment in the numbers as reported by the graph provider, however members are reminded that the fact-based investment system suggests only buying stocks showing strong quarterly and annual earnings (A criteria) increases.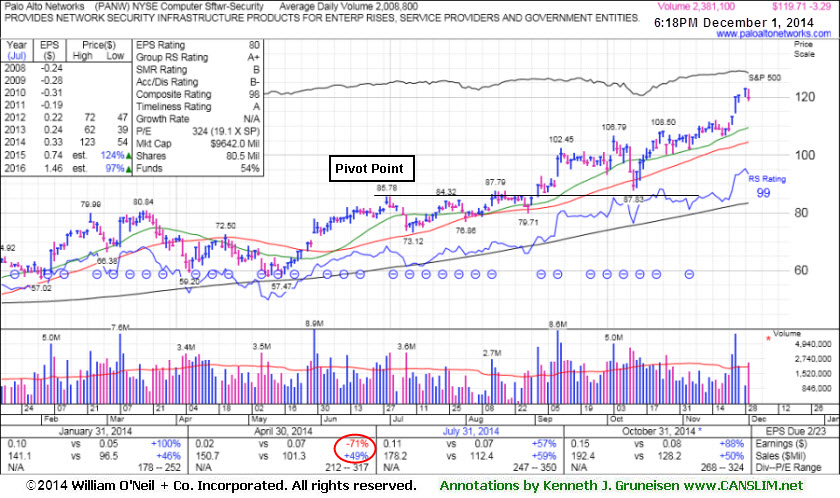
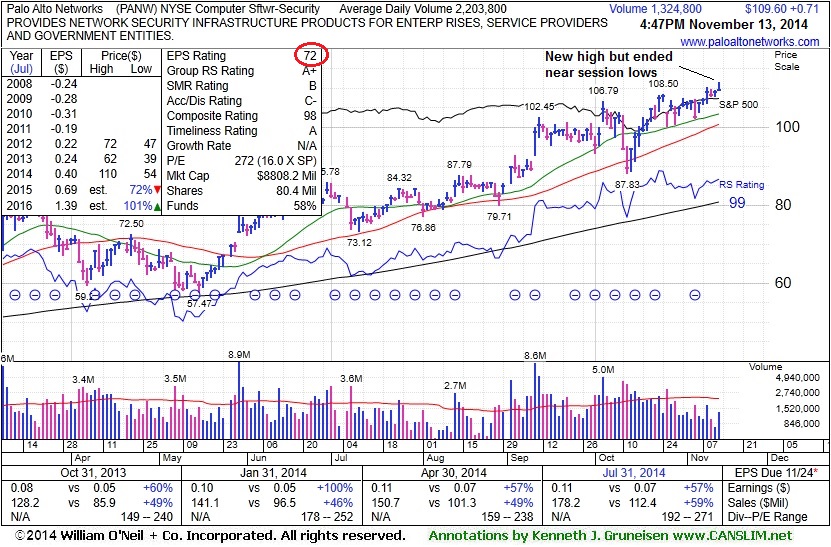
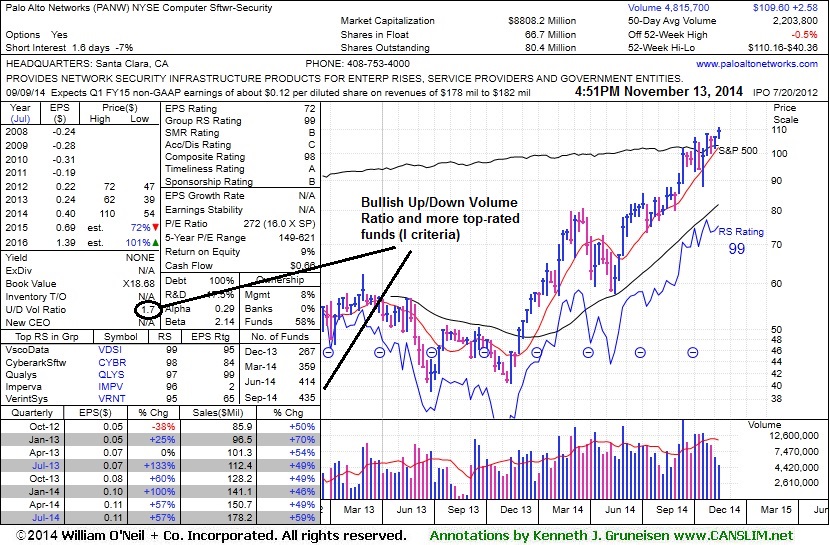
Finished Near Session Low With Small Gain on Light Volume - Thursday, November 13, 2014
Palo Alto Networks (PANW +$1.74 or +1.68% to $105.41) hit a new all-time high today but finished near the session low with a small gain on light volume. It has been getting extended from any sound base. Disciplined investors avoid chasing extended stocks more the +5% above prior highs and they always limit losses by selling any stock that falls more than -7% from their purchase price. Its 50-day moving average (DMA) line ($100.71) defines near-term support to watch where a subsequent violation would trigger a technical sell signal. Prior notes cautioned members - "Volume totals cooled in recent weeks, a sign that few investors have headed for the exit, however it has not formed a sound base."
PANW was last shown in this FSU section with annotated graphs on 10/28/14 under the headline, "Rebound and Rally Leaves Tech Firm Extended From Base". When last shown, the Computer Software - Security firm had an Earnings Per Share (EPS) Rating of 80, and it had reported (on 9/09/14) earnings +57% on +59% sales revenues for the Jul '14 quarter continuing its record of strong sales revenues increases and earnings above the +25% minimum guideline satisfying the C criteria. Although it is unclear what caused its EPS rating to fall to 72 (see red circle) from 80 in recent weeks, members are reminded that the fact-based investment system suggests only buying stocks with an 80+ minimum EPS rating.
Its annual earnings (A criteria) history is a bit limited, but growth has been strong since its July 2012 IPO at $42. The number of top-rated funds owning its shares rose from 246 in Jun '13 to 435 in Sep '14, a reassuring sign concerning the I criteria. Its small supply (S criteria) of 66.7 million shares in the public float is another favorable characteristic. Its current Up/Down Volume Ratio of 1.7 is an unbiased indication its shares have been under accumulation over the past 50 days.
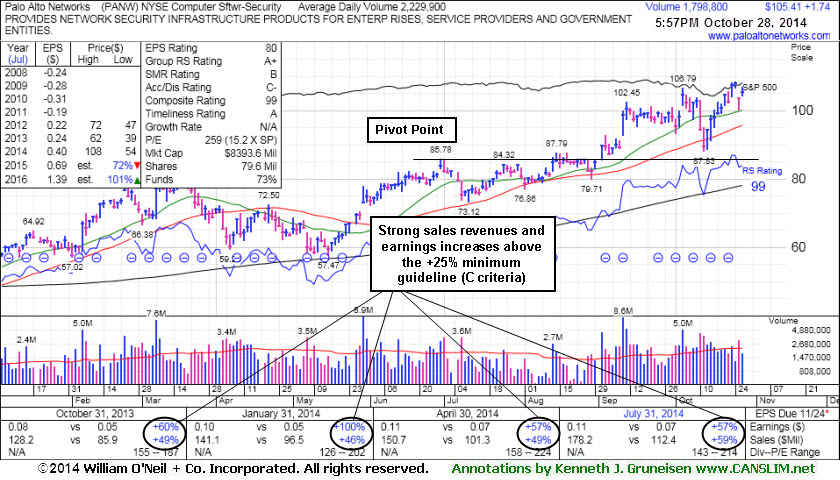
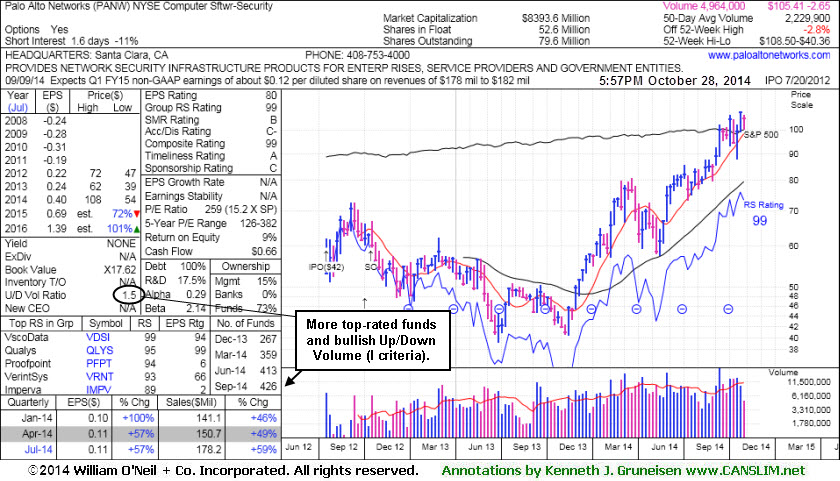
Rebound and Rally Leaves Tech Firm Extended From Base - Tuesday, October 28, 2014
Palo Alto Networks (PANW +$1.74 or +1.68% to $105.41) is perched near its 52-week high, extended from any sound base. Its 50-day moving average (DMA) line ($95.67) and recent low ($87.83 on 10/13/14) define important near-term support where subsequent violations would trigger technical sell signals.PANW was last shown in this FSU section with annotated graphs on 10/14/14 under the headline, "Prompt Rebound Above 50-Day Average an Encouraging Sign of Support". It was then noted - "The rebound was an encouraging sign that the institutional crowd stepped in to provide support after the pullback." Market strength (M criteria) of late has helped investors have confidence to maintain or increase market exposure. Disciplined investors avoid chasing extended stocks more the +5% above prior highs and they always limit losses by selling any stock that falls more than -7% from their purchase price.
The high-ranked leader hailing from the Computer Software - Security industry group reported earnings +57% on +59% sales revenues for the Jul '14 quarter continuing its record of strong sales revenues increases and earnings above the +25% minimum guideline satisfying the C criteria. Its annual earnings (A criteria) history is a bit limited, but growth has been strong since its July 2012 IPO at $42. The number of top-rated funds owning its shares rose from 246 in Jun '13 to 426 in Sep '14, a reassuring sign concerning the I criteria. Its small supply (S criteria) of only 52.6 million shares in the public float is another favorable characteristic. Its current Up/Down Volume Ratio of 1.5 is an unbiased indication its shares have been under accumulation over the past 50 days.
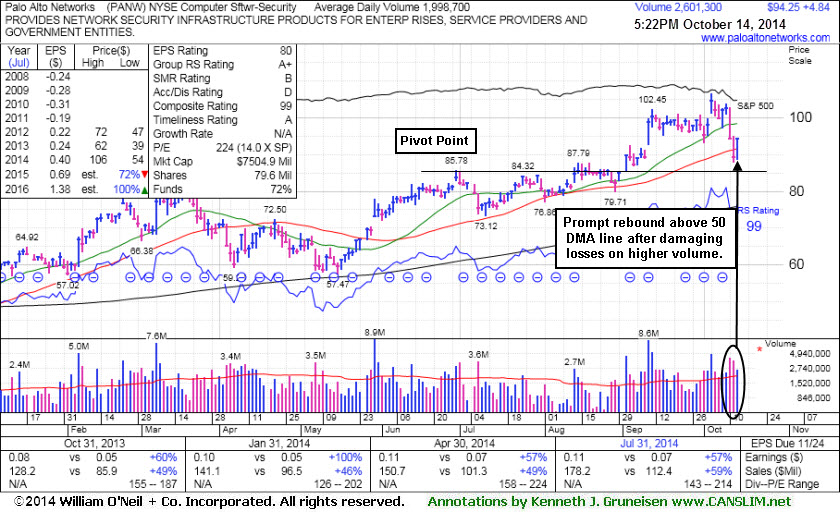
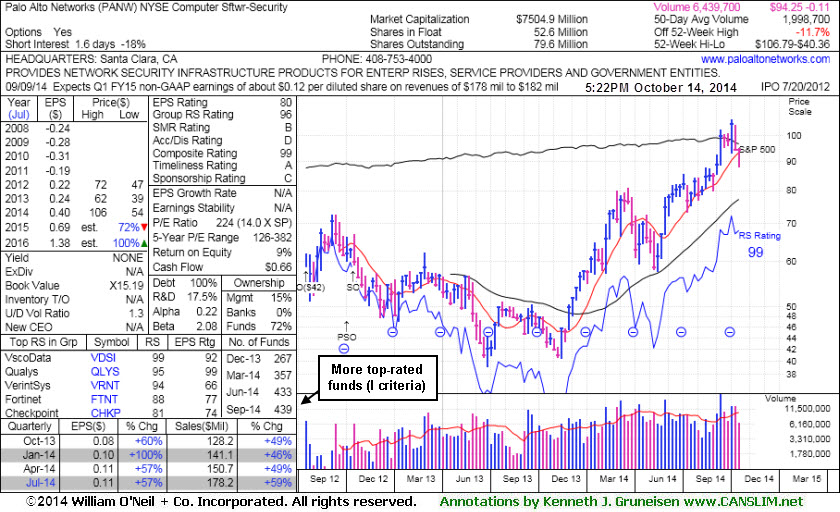
Prompt Rebound Above 50-Day Average an Encouraging Sign of Support - Tuesday, October 14, 2014
Palo Alto Networks (PANW +$1.71 or +1.76% to $99.14) managed a prompt rebound above its 50-day moving average (DMA) line today which helped its outlook improve after 2 consecutive volume-driven losses had violated the recent low ($93.00 on 10/01/14) and its 50 DMA line triggering technical sell signals. The rebound was an encouraging sign that the institutional crowd stepped in to provide support after the pullback.
PANW was last shown in this FSU section with annotated graphs on 9/24/14 under the headline, "Holding Ground Near Highs After Big Volume-Driven Gains". Prior highs in the $87 area define important support to watch below its 50-day moving average (DMA) line ($91.58). Resistance due to overhead supply up through the $106 level may hinder its ability to rally for the near term. Market weakness (M criteria) of late has prompted investors to reduce market exposure. Disciplined investors avoid chasing extended stocks more the +5% above prior highs and they always limit losses by selling any stock that falls more than -7% from their purchase price.
The high-ranked leader hailing from the Computer Software - Security industry group reported earnings +57% on +59% sales revenues for the Jul '14 quarter continuing its record of strong sales revenues increases and earnings above the +25% minimum guideline satisfying the C criteria. Its annual earnings (A criteria) history is a bit limited, but growth has been strong since its July 2012 IPO at $42. The number of top-rated funds owning its shares rose from 246 in Jun '13 to 439 in Sep '14, a reassuring sign concerning the I criteria. Its small supply (S criteria) of only 52.6 million shares in the public float is another favorable characteristic. Its current Up/Down Volume Ratio of 1.3 is an unbiased indication its shares have been under accumulation over the past 50 days.
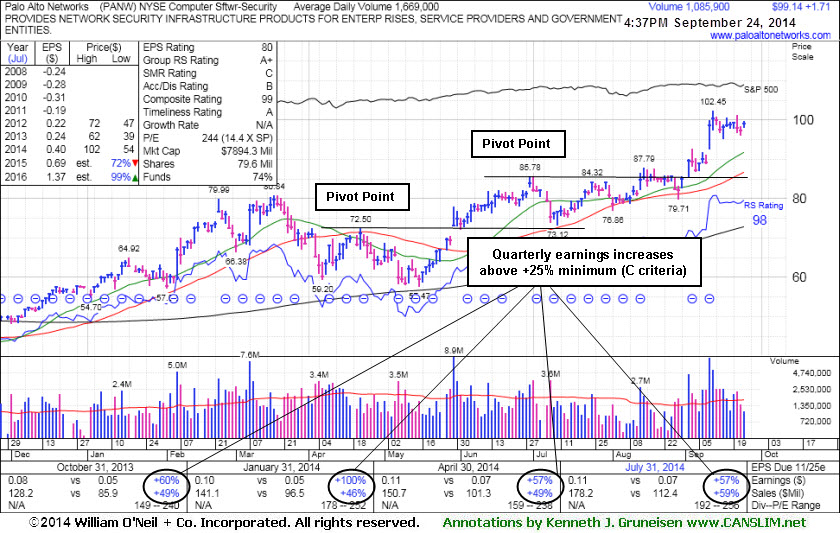
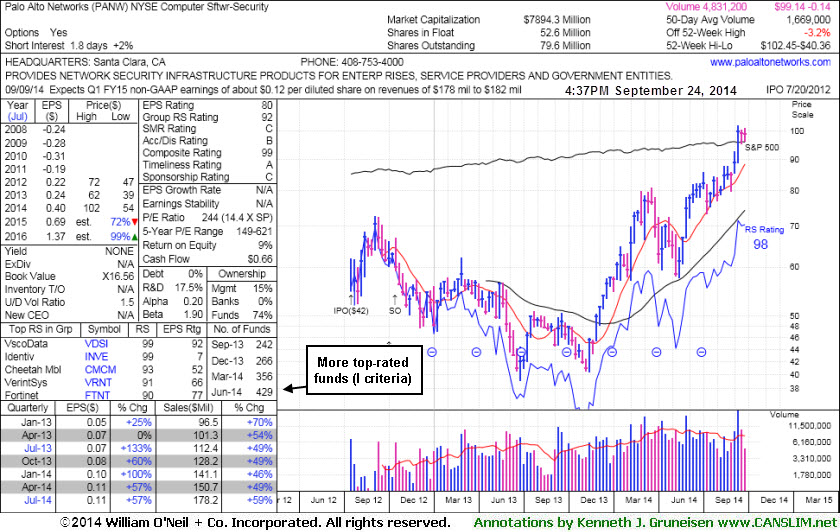
Holding Ground Near Highs After Big Volume-Driven Gains - Wednesday, September 24, 2014
Palo Alto Networks (PANW +$1.71 or +1.76% to $99.14) is extended from any sound base and stubbornly holding its ground after recent volume-driven gains. Prior highs in the $87 area define initial support to watch above its 50-day moving average (DMA) line ($86.74). Disciplined investors avoid chasing extended stocks more the +5% above prior highs and they always limit losses by selling any stock that falls more than -7% from their purchase price. It was last shown in this FSU section with annotated graphs on 9/04/14 under the headline, "Pulling Back Following New Technical Breakout", and no resistance remains due to overhead supply. Subsequent volume-driven gains lifted it well above its "max buy" level.
The high-ranked leader hailing from the Computer Software - Security industry group reported earnings +57% on +59% sales revenues for the Jul '14 quarter continuing its record of strong sales revenues increases and earnings above the +25% minimum guideline satisfying the C criteria. Its annual earnings (A criteria) history is a bit limited, but growth has been strong since its July 2012 IPO at $42. The number of top-rated funds owning its shares rose from 246 in Jun '13 to 429 in Jun '14, a reassuring sign concerning the I criteria. Its small supply (S criteria) of only 52.6 million shares in the public float is another favorable characteristic. Its current Up/Down Volume Ratio of 1.5 is an unbiased indication its shares have been under accumulation over the past 50 days.
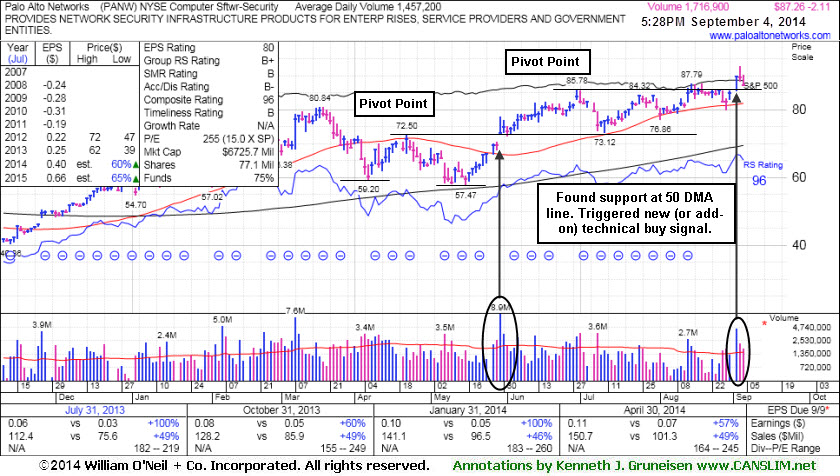
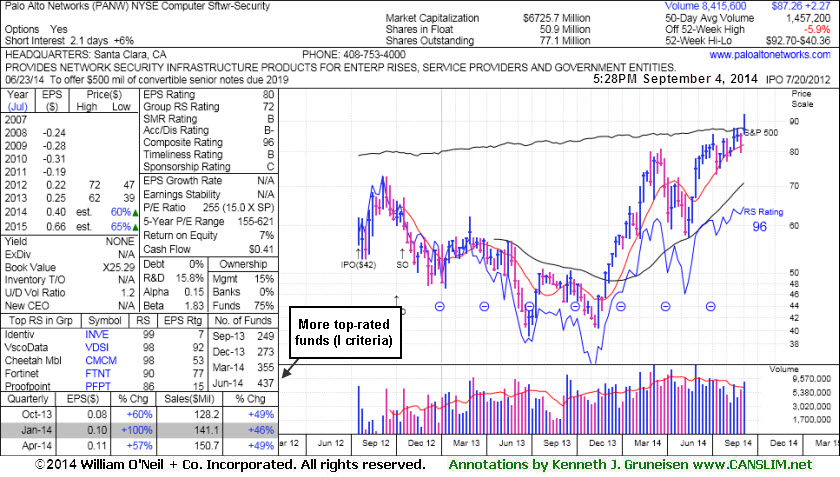
Pulling Back Following New Technical Breakout - Thursday, September 04, 2014
Palo Alto Networks (PANW -$2.11 or -2.36% to $87.26) ended in the red and finished near the session low for a 2nd day in a row after erasing early gains. A rally above its pivot point triggered a new (or add-on) technical buy signal on 9/02/14 with a considerable gain backed by more than 3 times average volume. No resistance remains due to overhead supply. Subsequent violations of the 50-day moving average (DMA) line or the 8/28/14 low ($79.71) would trigger technical sell signals. Keep in mind that the company is due to report earnings for the quarter ended July 31, 2014 on 9/09/14, and volume and volatility often increase near earnings news.The high-ranked leader hailing from the Computer Software - Security industry group was last shown in this FSU section with annotated graphs on 8/11/14 under the headline, "Building on New Base Pattern Above 50-Day Average". Since then the Group Relative Strength rating improved to 72 from a mediocre 57, and leadership from other stocks in the group is reassuring concerning the L criteria.
PANW was first highlighted in yellow at $75.95 with pivot point cited based on its 4/22/14 high in the 5/29/14 mid-day report (read here). Strong sales revenues increases and earnings through the Apr '14 quarter above the +25% minimum guideline satisfy the C criteria. Its annual earnings (A criteria) history is a bit limited, but growth has been strong since its July 2012 IPO at $42. The number of top-rated funds owning its shares rose from 246 in Jun '13 to 437 in Jun '14, a reassuring sign concerning the I criteria. Its small supply (S criteria) of only 50.9 million shares in the public float is another favorable characteristic.
Building on New Base Pattern Above 50-Day Average - Monday, August 11, 2014
Palo Alto Networks (PANW +$1.73 or +2.16% to $81.92) is perched within close striking distance of its 52-week high. Subsequent volume-driven gains to new high (N criteria) territory may trigger a new (or add-on) technical buy signal. Its 50 DMA line ($78.98) and recent low ($76.86 on 8/01/14) define important near-term support where subsequent violations would raise serious concerns and trigger technical sell signals.
The high-ranked leader hailing from the Computer Software - Security industry group has been building a base-on-base pattern since last shown in this FSU section with annotated graphs on 7/22/14 under the headline, "Found Support Above 50-Day Average Near Prior Highs". The Group Relative Strength rating is currently a mediocre 57, however leadership from other stocks in the group is reassuring concerning the L criteria). PANW was first highlighted in yellow at $75.95 with pivot point cited based on its 4/22/14 high in the 5/29/14 mid-day report (read here). Strong sales revenues increases and earnings through the Apr '14 quarter above the +25% minimum guideline satisfy the C criteria. Its annual earnings (A criteria) history is a bit limited, but growth has been strong since its July 2012 IPO at $42. The number of top-rated funds owning its shares rose from 246 in Jun '13 to 424 in Jun '14, a reassuring sign concerning the I criteria. Its small supply (S criteria) of only 50.9 million shares in the public float is another favorable characteristic.
Found Support Above 50-Day Average Near Prior Highs - Tuesday, July 22, 2014
Palo Alto Networks (PANW +$1.72 or +2.15% to $81.75) rose again with today's 3rd consecutive gain on below average volume. Its 50-day moving average (DMA) line defines important support and a violation would raise serious concerns and trigger a technical sell signal. The high-ranked leader hailing from the Computer Software - Security industry group stalled after it was last shown in this FSU section with annotated graphs on 6/30/14 under the headline, "Gap Up Gain on Above Average Volume for New Highs".PANW was first highlighted in yellow at $75.95 with pivot point cited based on its 4/22/14 high in the 5/29/14 mid-day report (read here). The gap up gain was backed by 5 times average volume as it completed a bullish "double bottom" base and triggered a technical buy signal. Strong sales revenues increases and earnings through the Apr '14 quarter above the +25% minimum guideline satisfy the C criteria. Its annual earnings (A criteria) history is a bit limited, but growth has been strong since its July 2012 IPO at $42. The number of top-rated funds owning its shares rose from 246 in Jun '13 to 418 in Jun '14, a reassuring sign concerning the I criteria. Its small supply (S criteria) of only 50.9 million shares in the public float is another favorable characteristic.
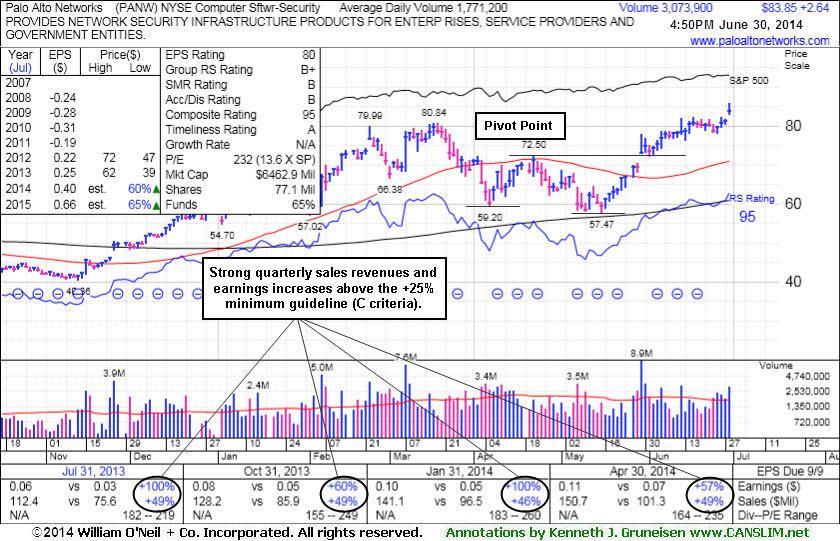
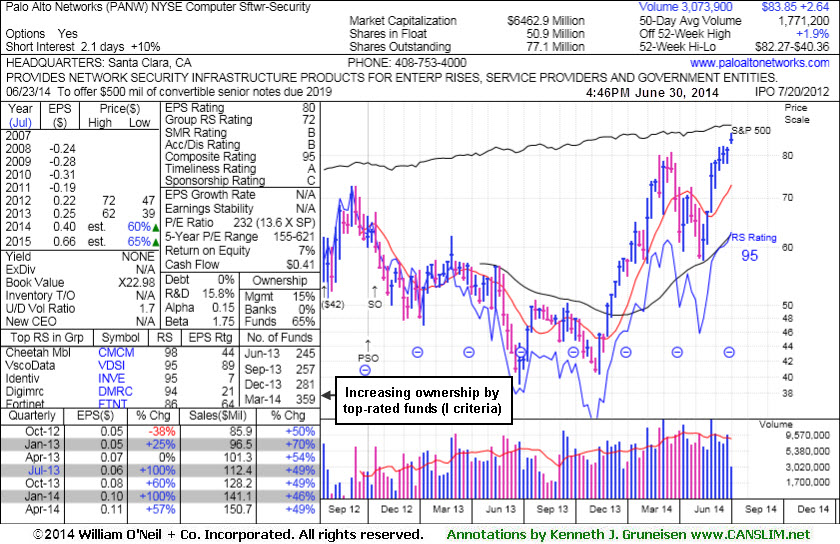
Gap Up Gain on Above Average Volume for New Highs - Monday, June 30, 2014
Palo Alto Networks (PANW +$2.64 or +3.25% to $83.85) gapped up and hit new 52-week and all-time highs while trading +73% above average volume behind with today's 4th consecutive gain. The high-ranked leader was last shown in this FSU section with annotated graphs on 6/12/14 under the headline, "Encountered Distributional Pressure After Touching New 52-Week High". Since then it stubbornly held its ground but it had made limited headway from the prior "double bottom" base, while it was previously noted - "Subsequent gains into new high territory (N criteria) could help it gain additional upward momentum. Keep in mind that disciplined investors avoid chasing stocks extended more than +5% above their prior high or pivot point, and they always limit losses by selling any stocks that fall more than -7% from their purchase price."Prior highs near $80 define initial support to watch on pullbacks now that it has distanced itself from that previous resistance level. PANW was first highlighted in yellow with pivot point cited based on its 4/22/14 high in the 5/29/14 mid-day report (read here). The gap up gain was backed by 5 times average volume as it completed a bullish "double bottom" base and triggered a technical buy signal.
Strong sales revenues increases and earnings through the Apr '14 quarter above the +25% minimum guideline satisfy the C criteria. Its annual earnings (A criteria) history is a bit limited, but growth has been strong since its July 2012 IPO at $42. The number of top-rated funds owning its shares rose from 246 in Jun '13 to 359 in Mar '14, a reassuring sign concerning the I criteria. Its small supply (S criteria) of only 50.9 million shares in the public float is another favorable characteristic. The Computer Software - Security group currently has a B+ rating, reflecting decent leadership (L criteria) in the group.
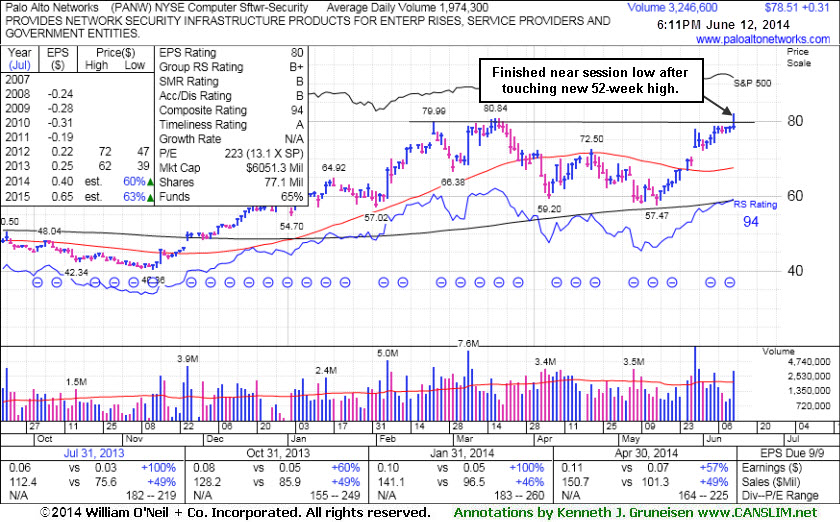
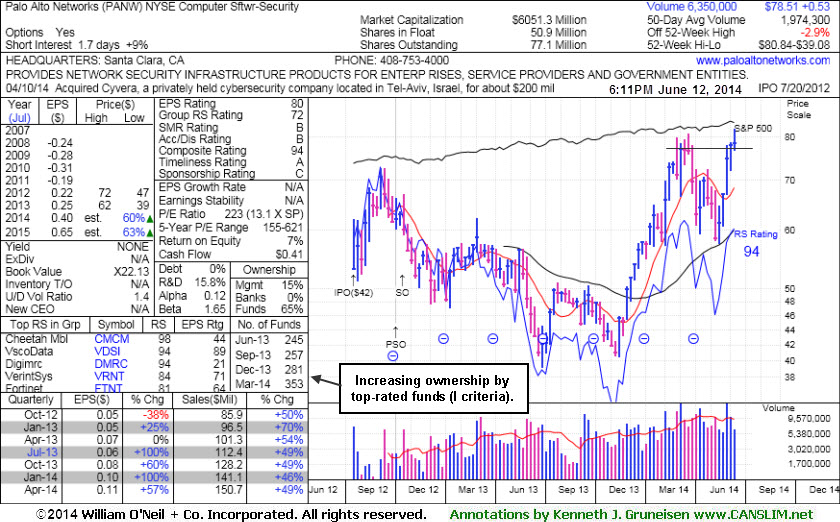
Encountered Distributional Pressure After Touching New 52-Week High - Thursday, June 12, 2014
Palo Alto Networks (PANW +$0.31 or +0.40% to $78.51) hit a new 52-week high today but encountered some distributional pressure and finished near the session low with a small gain on above average volume. It is extended from the previously noted base pattern and may be likely to encounter resistance near its old 52-week high. Prior highs near $72 define important support to watch on pullbacks above its 50-day moving average (DMA) line ($67.51).
PANW was last shown in this FSU section with annotated graphs on 5/29/14 under the headline, "Finish Near Session Low Following Gap Up From Double Bottom Base". It was highlighted in yellow with pivot point cited based on its 4/22/14 high in the 5/29/14 mid-day report (read here). The gap up gain was backed by 5 times average volume as it completed a bullish "double bottom" base and triggered a technical buy signal.
Subsequent gains into new high territory (N criteria) could help it gain additional upward momentum. Keep in mind that disciplined investors avoid chasing stocks extended more than +5% above their prior high or pivot point, and they always limit losses by selling any stocks that fall more than -7% from their purchase price.
Strong sales revenues increases and earnings through the Apr '14 quarter above the +25% minimum guideline satisfy the C criteria. Its annual earnings (A criteria) history is a bit limited, but growth has been strong since its July 2012 IPO at $42. The number of top-rated funds owning its shares rose from 246 in Jun '13 to 353 in Mar '14, a reassuring sign concerning the I criteria. Its small supply (S criteria) of only 50.9 million shares in the public float is another favorable characteristic. The Computer Software - Security group currently has a B+ rating, reflecting decent leadership (L criteria) in the group.
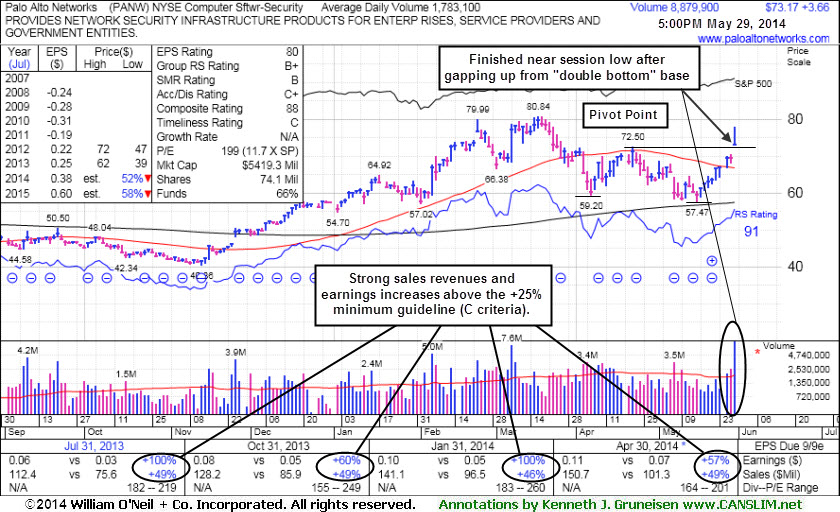
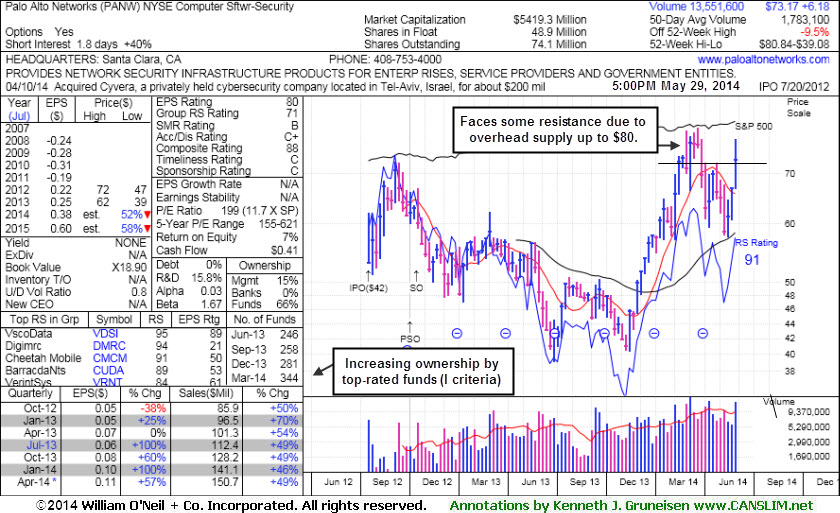
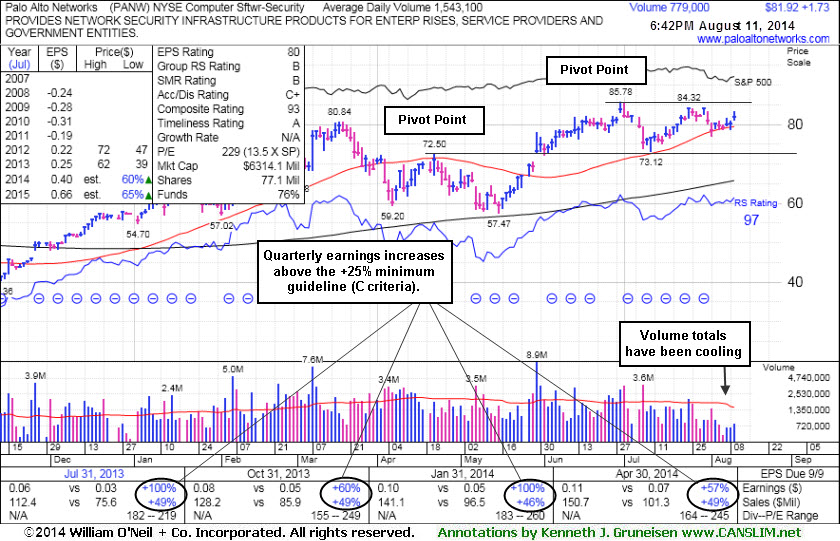
Finish Near Session Low Following Gap Up From Double Bottom Base - Thursday, May 29, 2014
Palo Alto Networks (PANW +$3.66 or +5.27% to $73.17) finished near the session low today, a sign that it was encountering distributional pressure after highlighted in yellow with pivot point cited based on its 4/22/14 high in the earlier mid-day report (read here). The gap up gain was backed by 5 times average volume as it completed a bullish "double bottom" base and triggered a technical buy signal. There is some near-term resistance due to overhead supply up through the $80 level, meanwhile it finished -9.5% off its 52-week high.Subsequent gains into new high territory (N criteria) could help it gain additional upward momentum. Deterioration below the pivot point would raise concerns. Keep in mind that disciplined investors avoid chasing stocks extended more than +5% above their prior high or pivot point, and they always limit losses by selling any stocks that fall more than -7% from their purchase price.
Strong sales revenues increases and earnings through the Apr '14 quarter above the +25% minimum guideline satisfy the C criteria. Its annual earnings (A criteria) history is a bit limited, but growth has been strong since its July 2012 IPO at $42. The number of top-rated funds owning its shares rose from 246 in Jun '13 to 344 in Mar '14, a reassuring sign concerning the I criteria. Its small supply (S criteria) of only 48.9 million shares in the public float is another favorable characteristic. The Computer Software - Security group currently has a B+ rating, reflecting decent leadership (L criteria) in the group.