You are not logged in.
This means you
CAN ONLY VIEW reports that were published prior to Thursday, March 20, 2025.
You
MUST UPGRADE YOUR MEMBERSHIP if you want to see any current reports.
AFTER MARKET UPDATE - THURSDAY, APRIL 27TH, 2023
Previous After Market Report Next After Market Report >>>
|
|
|
|
DOW |
+524.29 |
33,826.16 |
+1.57% |
|
Volume |
819,573,291 |
-4% |
|
Volume |
5,290,638,500 |
-1% |
|
NASDAQ |
+287.89 |
12,142.24 |
+2.43% |
|
Advancers |
2,267 |
78% |
|
Advancers |
2,784 |
64% |
|
S&P 500 |
+79.36 |
4,135.35 |
+1.96% |
|
Decliners |
622 |
22% |
|
Decliners |
1,592 |
36% |
|
Russell 2000 |
+20.81 |
1,751.22 |
+1.20% |
|
52 Wk Highs |
36 |
|
|
52 Wk Highs |
54 |
|
|
S&P 600 |
+17.02 |
1,136.78 |
+1.52% |
|
52 Wk Lows |
54 |
|
|
52 Wk Lows |
220 |
|
|
 |
Leadership Improved as Major Indices Bounced
Kenneth J. Gruneisen - Passed the CAN SLIM® Master's Exam
The Nasdaq Composite advanced 2.4% amid a surge in Technology shares. The S&P 500 added 2% and the Dow climbed 524 points (1.6%). Volume totals reported were lighter than the prior session on the NYSE and on the Nasdaq exchange. Breadth was positive as advancers led decliners by more than a 3-1 margin on the NYSE and by a 7-4 margin on the Nasdaq exchange. Leadership improved as there were 20 high-ranked companies from the Leaders List that hit a new 52-week high and were listed on the BreakOuts Page, versus the total of 3 on the prior session. New 52-week lows totals contracted but still outnumbered new 52-week highs totals on the NYSE and on the Nasdaq exchange.The major indices are in an uptrend under pressure (M criteria). Appropriate new buying efforts may be considered under the fact-based investment system.
PICTURED: The Dow Jones Industrial Average posted its best gain since January, finding support above its 50-day moving average (DMA) line.
All sectors finished in positive territory as equities were higher Thursday. Investors digested strong corporate earnings. This week, investors cheered as first-quarter earnings results from technology firms have come in better than expected.
On the data front today, the advance reading of first-quarter Gross Domestic Product (GDP) showed the economy grew at a slower-than-forecasted pace, coming in at an annualized 1.1% quarter-over-quarter versus the expected 1.9% growth. The personal consumption component of the report climbed 3.7%, accelerating from the prior quarter’s 1% growth rate. The Core Personal Consumption Expenditures (PCE) component, which excludes the more volatile food and energy prices, accelerated in the first quarter, and notched its fastest pace in a year. Meanwhile, pending home sales unexpectedly fell 5.2% month-over-month in March, its biggest drop since September, signaling the housing rout may not yet be over. Finally, the Kansas City Federal Reserve (Fed) Manufacturing Activity Index fell more than expected in April.
Treasuries weakened, with the yield on the benchmark 10-year note up eight basis points (0.08%) to 3.52%, while the 30-year bond yield climbed five basis points (0.05%) to 3.75%. The yield on the two-year note, which is more sensitive to changes in Fed policy, advanced 14 basis points (0.14%) to 4.07%. In commodities, West Texas Intermediate (WTI) crude climbed 0.7% to $74.80/barrel amid a larger-than-expected drawdown in domestic crude stockpiles. |
 Kenneth J. Gruneisen started out as a licensed stockbroker in August 1987, a couple of months prior to the historic stock market crash that took the Dow Jones Industrial Average down -22.6% in a single day. He has published daily fact-based fundamental and technical analysis on high-ranked stocks online for two decades. Through FACTBASEDINVESTING.COM, Kenneth provides educational articles, news, market commentary, and other information regarding proven investment systems that work in good times and bad.
Comments contained in the body of this report are technical opinions only and are not necessarily those of Gruneisen Growth Corp. The material herein has been obtained from sources believed to be reliable and accurate, however, its accuracy and completeness cannot be guaranteed. Our firm, employees, and customers may effect transactions, including transactions contrary to any recommendation herein, or have positions in the securities mentioned herein or options with respect thereto. Any recommendation contained in this report may not be suitable for all investors and it is not to be deemed an offer or solicitation on our part with respect to the purchase or sale of any securities. |
|
 |
Retail, Financial, Gold & Silver, and Semiconductor Indexes Rose
Kenneth J. Gruneisen - Passed the CAN SLIM® Master's Exam
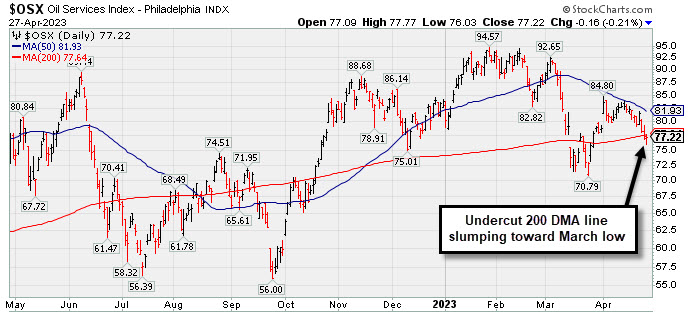
The Retail Index ($RLX +3.31%) posted a solid gain while the Broker/Dealer Index ($XBD +1.20%) and Bank Index ($BKX +1.54%) also posted influential gains on Thursday. The Semiconductor Index ($SOX +0.64%) led the tech sector with a small gain while the Networking Index ($NWX +0.15%) and Biotech Index ($BTK +0.16%) both inched higher. The Gold & Silver Index ($XAU +1.15%) posted a small gain while the Integrated Oil Index ($XOI -0.01%) finished flat and the Oil Services Index ($OSX -0.21%) edged lower.
PICTURED: The Oil Services Index ($OSX -0.21%) has slumped under its 200-day moving average (DMA) line toward the March low.
| Oil Services |
$OSX |
77.22 |
-0.16 |
-0.21% |
-7.92% |
| Integrated Oil |
$XOI |
1,724.12 |
-0.23 |
-0.01% |
-3.53% |
| Semiconductor |
$SOX |
2,941.59 |
+18.59 |
+0.64% |
+16.17% |
| Networking |
$NWX |
756.46 |
+1.14 |
+0.15% |
-3.43% |
| Broker/Dealer |
$XBD |
449.40 |
+5.31 |
+1.20% |
+0.06% |
| Retail |
$RLX |
3,107.17 |
+99.56 |
+3.31% |
+12.82% |
| Gold & Silver |
$XAU |
134.60 |
+1.53 |
+1.15% |
+11.37% |
| Bank |
$BKX |
80.08 |
+1.21 |
+1.54% |
-20.59% |
| Biotech |
$BTK |
5,185.54 |
+8.51 |
+0.16% |
-1.81% |
|
|
|
 |
Fell From High and Raised Concern With Subpar Mar '23 Report
Kenneth J. Gruneisen - Passed the CAN SLIM® Master's Exam
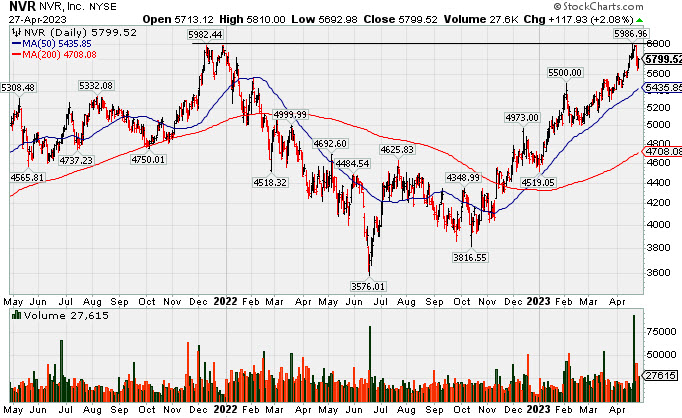
NVR Inc (NVR +$120.63 or +2.12% to $5,802.22) was highlighted in yellow in the 4/25/23 mid-day report (read here) with pivot point cited based on its 12/30/21 high plus 10 cents. It pulled back after recently rallying to touch a new all-time high. Confirming gains and a close above the pivot point backed by at least +40% above average volume may clinch a proper technical buy signal.
Concerns were raised as it reported Mar '23 quarterly earnings -14% on -8% sales revenues, a noted new fundamental flaw. Earnings had risen +50% on +23% sales revenues for the Dec '22 quarter versus the year-ago period, and prior quarterly comparisons were above the +25% minimum earnings guideline (C criteria). Annual earnings (A criteria) growth has been very strong. It still has a 90 Earnings Per Share Rating.
The Building - Residential/Commercial industry group is currently ranked 2nd on the 197 Industry Groups list (L criteria). The number of top-rated funds owning its shares rose from 1,548 in Dec '22 to 1,576 in Mar '23. Its current Up/Down Volume Ratio of 1.5 is an unbiased indication its shares have been under accumulation over the past 50 days. |
|
|
Color Codes Explained :
Y - Better candidates highlighted by our
staff of experts.
G - Previously featured
in past reports as yellow but may no longer be buyable under the
guidelines.
***Last / Change / Volume data in this table is the closing quote data***
Symbol/Exchange
Company Name
Industry Group |
PRICE |
CHANGE
(%Change) |
Day High |
Volume
(% DAV)
(% 50 day avg vol) |
52 Wk Hi
% From Hi |
Featured
Date |
Price
Featured |
Pivot Featured |
|
Max Buy |
 GPK
-
NYSE
GPK
-
NYSE
Graphic Packaging
CONSUMER NON-DURABLES - Packaging and Containers
|
$24.26
|
+0.35
1.46% |
$24.34
|
2,619,341
90.95% of 50 DAV
50 DAV is 2,880,000
|
$25.62
-5.31%
|
10/25/2022
|
$22.75
|
PP = $24.17
|
|
MB = $25.38
|
Most Recent Note - 4/26/2023 5:12:02 PM
G - Color code is changed to green as it slumped well below its 50 DMA line ($24.34) triggering a technical sell signal. A rebound above the 50 DMA line is needed for its outlook to improve. It remains perched just -6.7% below its all-time high. Recent gains lacked great volume conviction.
>>> FEATURED STOCK ARTICLE : Quietly Consolidating Just Below "Max Buy" Level - 4/10/2023 |
View all notes |
Set NEW NOTE alert |
Company Profile |
SEC
News |
Chart |
Request a new note
C
A
S
I |
STRL
-
NASDAQ
Sterling Infrastructure
MATERIALS and; CONSTRUCTION - Heavy Construction
|
$36.26
|
+0.58
1.63% |
$36.77
|
227,243
94.29% of 50 DAV
50 DAV is 241,000
|
$42.00
-13.67%
|
12/14/2022
|
$32.41
|
PP = $33.72
|
|
MB = $35.41
|
Most Recent Note - 4/26/2023 5:14:10 PM
G - Slumping again after meeting resistance at its 50 DMA line. A rebound above the 50 DMA line ($37.78) is needed for its outlook to improve. Due to report Mar '23 quarterly results on 5/01/23. Volume and volatility often increase near earnings news.
>>> FEATURED STOCK ARTICLE : Volume-Driven 50-Day Moving Average Violation Triggered Sell Signal - 4/5/2023 |
View all notes |
Set NEW NOTE alert |
Company Profile |
SEC
News |
Chart |
Request a new note
C
A
S
I |
PERI
-
NASDAQ
Perion Network
Comml Svcs-Advertising
|
$35.30
|
+0.21
0.60% |
$36.12
|
521,546
70.19% of 50 DAV
50 DAV is 743,000
|
$42.75
-17.43%
|
1/25/2023
|
$31.79
|
PP = $33.19
|
|
MB = $34.85
|
Most Recent Note - 4/24/2023 6:51:39 PM
G - Violated its 50 DMA line ($36.58) with a damaging volume-driven loss today triggering a technical sell signal. Only a prompt rebound above the 50 DMA line would help its outlook improve.
>>> FEATURED STOCK ARTICLE : Perion Pulls Back Toward 50-Day Moving Average Line - 4/20/2023 |
View all notes |
Set NEW NOTE alert |
Company Profile |
SEC
News |
Chart |
Request a new note
C
A
S
I |
FIX
-
NYSE
Comfort Systems USA
MATERIALS and CONSTRUCTION - General Contractors
|
$148.85
|
+16.02
12.06% |
$149.39
|
603,363
208.78% of 50 DAV
50 DAV is 289,000
|
$152.13
-2.16%
|
4/27/2023
|
$148.85
|
PP = $152.23
|
|
MB = $159.84
|
 Most Recent Note - 4/27/2023 5:25:35 PM
Y - Bullish action came today after it reported Mar '23 quarterly earnings +66% on +33% sales revenues versus the year-ago period. Powered above its 50 DMA liner ($138) with a considerable gain backed by twice its average volume. Its color code is changed to yellow with pivot point cited based on its 3/03/23 high plus 10 cents. Very little resistance remains due to overhead supply up to the $152 level. A gain and new high backed by at least +40% above average volume may trigger a technical buy signal.
>>> FEATURED STOCK ARTICLE : Consolidating Near 50-Day Moving Average and -10.5% off High - 4/21/2023 |
View all notes |
Set NEW NOTE alert |
Company Profile |
SEC
News |
Chart |
Request a new note
C
A
S
I |
KOF
-
NYSE
Coca-Cola Femsa ADR
FOOD and BEVERAGE - Beverages - Soft Drinks
|
$82.26
|
-1.26
-1.51% |
$84.49
|
315,326
170.45% of 50 DAV
50 DAV is 185,000
|
$85.61
-3.91%
|
3/7/2023
|
$76.63
|
PP = $77.11
|
|
MB = $80.97
|
Most Recent Note - 4/24/2023 6:54:20 PM
G - Hit a new all-time high with today's quiet gain, getting more extended from the prior base. On pullbacks, prior highs in the $79-$77 area define initial support to watch along with its 50 DMA line ($77.33).
>>> FEATURED STOCK ARTICLE : Streak of 11 Straight Gains into New High Territory - 4/12/2023 |
View all notes |
Set NEW NOTE alert |
Company Profile |
SEC
News |
Chart |
Request a new note
C
A
S
I |
Symbol/Exchange
Company Name
Industry Group |
PRICE |
CHANGE
(%Change) |
Day High |
Volume
(% DAV)
(% 50 day avg vol) |
52 Wk Hi
% From Hi |
Featured
Date |
Price
Featured |
Pivot Featured |
|
Max Buy |
ANET
-
NYSE
Arista Networks
Computer-Networking
|
$156.76
|
+0.80
0.51% |
$157.46
|
2,237,811
86.70% of 50 DAV
50 DAV is 2,581,000
|
$171.44
-8.56%
|
4/24/2023
|
$156.56
|
PP = $171.54
|
|
MB = $180.12
|
Most Recent Note - 4/26/2023 12:08:25 PM
Y - Finding support above its 50 DMA line ($154) with today's gain. Color code was changed to yellow with new pivot point cited based on its 3/23/23 high plus 10 cents. Subsequent gains above the pivot point backed by at least +40% above average volume may trigger a new (or add-on) technical buy signal. The 50 DMA line defines important support to watch above prior highs in the $148-145 area.
>>> FEATURED STOCK ARTICLE : Near High With Volume Cooling Following Volume-Driven Gains - 4/17/2023 |
View all notes |
Set NEW NOTE alert |
Company Profile |
SEC
News |
Chart |
Request a new note
C
A
S
I |
CLH
-
NYSE
Clean Harbors
Pollution Control
|
$144.26
|
+1.96
1.38% |
$144.51
|
373,920
87.77% of 50 DAV
50 DAV is 426,000
|
$146.05
-1.23%
|
3/10/2023
|
$136.89
|
PP = $136.74
|
|
MB = $143.58
|
Most Recent Note - 4/24/2023 7:06:52 PM
G - Posted a small gain today with below-average volume matching its best-ever close. Recently wedging up above its "max buy" level with gains backed by lackluster volume, not action considered indicative of fresh institutional buying demand. Found prompt support near its 50 DMA line ($136.49) during recent consolidations. Fundamentals remain strong.
>>> FEATURED STOCK ARTICLE : Wedged to a New High Close Above "Max Buy" Level - 4/19/2023 |
View all notes |
Set NEW NOTE alert |
Company Profile |
SEC
News |
Chart |
Request a new note
C
A
S
I |
MTRN
-
NYSE
Materion
METALS and MINING - Industrial Metals and Minerals
|
$108.72
|
+1.11
1.03% |
$109.01
|
58,079
46.46% of 50 DAV
50 DAV is 125,000
|
$119.75
-9.21%
|
4/18/2023
|
$114.52
|
PP = $118.30
|
|
MB = $124.22
|
Most Recent Note - 4/25/2023 1:34:25 PM
G - Color code is changed to green after slumping below its 50 DMA line ($109.75) with today's loss on light volume. Encountered distributional pressure when poised to break out. A prompt rebound above the 50 DMA line is needed for its outlook to improve. Subsequent gains and a strong close above the pivot point backed by at least +40% above average volume may trigger a proper technical buy signal. Due to report Mar '23 quarterly results on 5/03/23. Volume and volatility often increase near earnings news.
>>> FEATURED STOCK ARTICLE : Encountered Distributional Pressure When Poised for Breakout - 4/18/2023 |
View all notes |
Set NEW NOTE alert |
Company Profile |
SEC
News |
Chart |
Request a new note
C
A
S
I |
SPSC
-
NASDAQ
SPS Commerce
COMPUTER SOFTWARE and SERVICES - Application Software
|
$147.37
|
+4.72
3.31% |
$148.22
|
137,733
87.17% of 50 DAV
50 DAV is 158,000
|
$157.46
-6.41%
|
4/24/2023
|
$150.01
|
PP = $157.56
|
|
MB = $165.44
|
Most Recent Note - 4/27/2023 5:29:19 PM
G - Posted a solid gain today with below-average volume and rebounded near its 50 DMA line ($148.48) which may act as resistance. Highlighted in yellow with new pivot point cited based on its 2/15/23 high plus 10 cents in the 4/24/23 mid-day report. A prompt rebound above its 50 DMA line ($148.48) is needed for its outlook to improve. Subsequent gains above the pivot point backed by at least +40% above average volume may trigger a technical buy signal. Reported Mar '23 quarterly earnings +22% on +20% versus the year-ago period raising some fundamental concerns. Volume and volatility often increase near earnings news.
>>> FEATURED STOCK ARTICLE : Sputtered While Perched in Striking Distance of 52-Week HIgh - 4/24/2023 |
View all notes |
Set NEW NOTE alert |
Company Profile |
SEC
News |
Chart |
Request a new note
C
A
S
I |
HUBB
-
NYSE
Hubbell
Electrical-Power/Equipmt
|
$266.99
|
+6.97
2.68% |
$268.31
|
467,168
121.34% of 50 DAV
50 DAV is 385,000
|
$265.50
0.56%
|
4/25/2023
|
$262.85
|
PP = $257.51
|
|
MB = $270.39
|
Most Recent Note - 4/27/2023 5:31:51 PM
Y - Posted a 4th consecutive gain today and hit a new high with volume +19% above average. Gap up and close above the pivot point on 4/25/23 with a considerable gain backed by +367% triggered a technical buy signal. Highlighted in yellow in the 4/25/23 mid-day report with pivot point cited based on its 3/06/23 high after a 4-month double bottom base. Rebounded above its 50 DMA line ($240) and touched a new 52-week high. Reported strong Mar '23 quarterly earnings +70% on +11% sales revenues versus the year-ago period. Its Mar, Jun, Sep, and Dec '22 quarterly earnings increases were above the +25% minimum (C criteria). Annual earnings history (A criteria) had a downturn in FY '20 like many companies during the pandemic.
>>> FEATURED STOCK ARTICLE : Gap Up Following Earnings Triggered Technical Buy Signal - 4/25/2023 |
View all notes |
Set NEW NOTE alert |
Company Profile |
SEC
News |
Chart |
Request a new note
C
A
S
I |
Symbol/Exchange
Company Name
Industry Group |
PRICE |
CHANGE
(%Change) |
Day High |
Volume
(% DAV)
(% 50 day avg vol) |
52 Wk Hi
% From Hi |
Featured
Date |
Price
Featured |
Pivot Featured |
|
Max Buy |
NVR
-
NYSE
NVR Inc
MATERIALS and CONSTRUCTION - Residential Construction
|
$5,799.52
|
+117.93
2.08% |
$5,810.00
|
27,615
120.07% of 50 DAV
50 DAV is 23,000
|
$5,986.96
-3.13%
|
4/25/2023
|
$5,882.18
|
PP = $5,978.25
|
|
MB = $6,277.16
|
Most Recent Note - 4/25/2023 1:06:40 PM
Y - Color code is changed to yellow with pivot point cited based on its 12/30/21 high plus 10 cents. Pulling back today after rallying to touch a new all-time high. Confirming gains and a close above the pivot point backed by at least +40% above average volume may clinch a proper technical buy signal. Due to report Mar '23 quarterly earnings. Reported earnings +50% on +23% sales revenues for the Dec '22 quarter versus the year-ago period, and prior quarterly comparisons were above the +25% minimum earnings guideline (C criteria). Annual earnings (A criteria) growth has been very strong.
>>> FEATURED STOCK ARTICLE : Fell From High and Raised Concern With Subpar Mar '23 Report - 4/27/2023 |
View all notes |
Set NEW NOTE alert |
Company Profile |
SEC
News |
Chart |
Request a new note
C
A
S
I |
PHM
-
NYSE
PulteGroup
MATERIALS and CONSTRUCTION - Residential Construction
|
$66.27
|
+1.64
2.54% |
$66.27
|
3,903,473
139.76% of 50 DAV
50 DAV is 2,793,000
|
$66.08
0.29%
|
4/25/2023
|
$65.17
|
PP = $64.01
|
|
MB = $67.21
|
Most Recent Note - 4/26/2023 5:06:13 PM
Y - Pulled back today breaking a streak fo 4 consecutive volume-driven gains. Highlighted in yellow with pivot point cited based on its May 2021 high in the 4/25/23 mid-day report. Bullish action came after it reported earnings +28% for the Mar '23 quarter versus the year-ago period. This Building - Residential/Commercial firm has posted 13 strong quarterly comparisons above the +25% minimum earnings guideline (C criteria). Annual earnings (A criteria) history has been strong. See the latest FSU analysis for more details and a new annotated graph.
>>> FEATURED STOCK ARTICLE : Recently Rallying to New All-Time Highs - 4/26/2023 |
View all notes |
Set NEW NOTE alert |
Company Profile |
SEC
News |
Chart |
Request a new note
C
A
S
I |
|
|
|
THESE ARE NOT BUY RECOMMENDATIONS!
Comments contained in the body of this report are technical
opinions only. The material herein has been obtained
from sources believed to be reliable and accurate, however,
its accuracy and completeness cannot be guaranteed.
This site is not an investment advisor, hence it does
not endorse or recommend any securities or other investments.
Any recommendation contained in this report may not
be suitable for all investors and it is not to be deemed
an offer or solicitation on our part with respect to
the purchase or sale of any securities. All trademarks,
service marks and trade names appearing in this report
are the property of their respective owners, and are
likewise used for identification purposes only.
This report is a service available
only to active Paid Premium Members.
You may opt-out of receiving report notifications
at any time. Questions or comments may be submitted
by writing to Premium Membership Services 665 S.E. 10 Street, Suite 201 Deerfield Beach, FL 33441-5634 or by calling 1-800-965-8307
or 954-785-1121.
|
|
|