You are not logged in.
This means you
CAN ONLY VIEW reports that were published prior to Thursday, March 20, 2025.
You
MUST UPGRADE YOUR MEMBERSHIP if you want to see any current reports.
AFTER MARKET UPDATE - THURSDAY, OCTOBER 18TH, 2018
Previous After Market Report Next After Market Report >>>
|
|
|
|
DOW |
-327.23 |
25,379.45 |
-1.27% |
|
Volume |
827,683,830 |
+4% |
|
Volume |
2,524,359,720 |
+7% |
|
NASDAQ |
-157.56 |
7,485.14 |
-2.06% |
|
Advancers |
707 |
24% |
|
Advancers |
711 |
23% |
|
S&P 500 |
-40.43 |
2,768.78 |
-1.44% |
|
Decliners |
2,285 |
76% |
|
Decliners |
2,319 |
77% |
|
Russell 2000 |
-28.85 |
1,560.75 |
-1.82% |
|
52 Wk Highs |
9 |
|
|
52 Wk Highs |
22 |
|
|
S&P 600 |
-18.66 |
972.21 |
-1.88% |
|
52 Wk Lows |
245 |
|
|
52 Wk Lows |
157 |
|
|
 |
Leadership Elusive as Distributional Pressure Hits Major Indices Again
Kenneth J. Gruneisen - Passed the CAN SLIM® Master's Exam
Stocks finished sharply lower Thursday. The Dow fell 327 points to 25379 while the S&P 500 slipped 40 points to 2768. The Nasdaq Composite was off 157 points to 7485. Volume totals reported were higher on the NYSE and on the Nasdaq exchange versus the prior session. Breadth was negative as decliners led advancers by a 3-1 margin on the NYSE and on the Nasdaq exchange. There were 4 high-ranked companies from the Leaders List that made new 52-week highs and were listed on the BreakOuts Page, versus 5 on the prior session, as market leadership remained very elusive. New 52-week lows totals expanded and again easily outnumbered new 52-week highs on the NYSE and Nasdaq exchange. Recent reports have noted that the major indices (M criteria) have shown action indicative of a market correction while leadership disappeared. During market corrections investors should have a bias toward selling stocks on a case-by-case basis as technical sell signals occur, raising cash levels while reducing market exposure. The Featured Stocks Page provides the most timely analysis on high-ranked leaders. Charts used courtesy of www.stockcharts.com
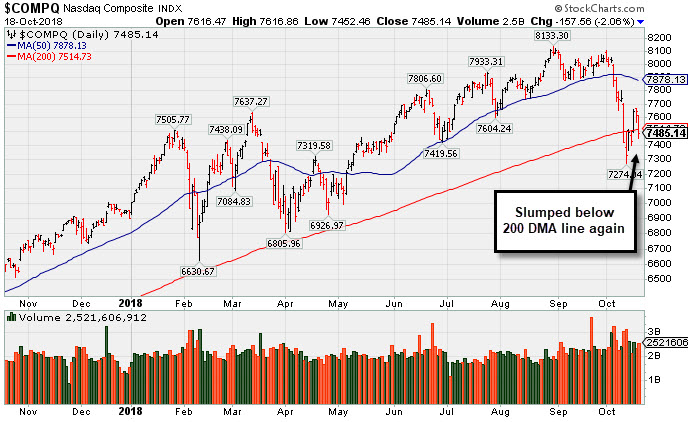
PICTURED: The Nasdaq Composite Index slumped back below its 200-day moving average (DMA) line, as the chart illustrates. Technically, however, the market still is in a "correction" under the fact-based investment system. Thursday marked Day 5 of the nascent rally attempt. Investors should watch for a subsequent gain or "follow-through day" to be noted. most ideally between Day 4 and Day 7, with solid gains on higher volume and leadership expansion all necessary elements to confirm a new rally. New buying efforts are against the rules and discouraged until a convincing follow-through day occurs.
The major averages declined as investors digested a confluence of geopolitical concerns. Markets opened lower following another sell-off in Chinese shares overnight, which left the Shanghai Composite off 30% from its January high. Meanwhile, the standoff between the populist Italian government and the E.U. intensified Thursday, sending European shares tumbling. Rounding out the international uncertainty was news that the U.S. backed out of an upcoming investment summit in Saudi Arabia amid the growing controversy around the disappearance of a Saudi dissident.
Nine of 11 S&P 500 sectors finished lower with only Utilities and Real Estate shares advancing. Technology and Consumer Discretionary stocks led the losses as Apple (AAPL -2.34%) and Amazon (AMZN -3.33%) fell. Industrials also underperformed as United Rentals (URI -15.04%) and Textron (TXT -11.25%) fell after both companies released disappointing third quarter earnings. In positive earnings news, Philip Morris (MO +3.50%) after topping profit expectations and raising forward guidance.
Treasuries were mixed following the perceived hawkish takeaway from the minutes of the Federal Reserve’s September policy meeting. The 10-year note rose one basis points to 3.18%. In commodities, WTI crude lost 1.5% to $68.72/barrel. |
 Kenneth J. Gruneisen started out as a licensed stockbroker in August 1987, a couple of months prior to the historic stock market crash that took the Dow Jones Industrial Average down -22.6% in a single day. He has published daily fact-based fundamental and technical analysis on high-ranked stocks online for two decades. Through FACTBASEDINVESTING.COM, Kenneth provides educational articles, news, market commentary, and other information regarding proven investment systems that work in good times and bad.
Comments contained in the body of this report are technical opinions only and are not necessarily those of Gruneisen Growth Corp. The material herein has been obtained from sources believed to be reliable and accurate, however, its accuracy and completeness cannot be guaranteed. Our firm, employees, and customers may effect transactions, including transactions contrary to any recommendation herein, or have positions in the securities mentioned herein or options with respect thereto. Any recommendation contained in this report may not be suitable for all investors and it is not to be deemed an offer or solicitation on our part with respect to the purchase or sale of any securities. |
|
 |
Financial, Retail, Tech, and Energy-Linked Groups Fell
Kenneth J. Gruneisen - Passed the CAN SLIM® Master's Exam
The Retail Index ($RLX -2.37%), Bank Index ($BKX -1.82%) and Broker/Dealer Index ($XBD -2.17%) on Thursday. The tech sector also had a negative bias as the Biotech Index ($BTK -1.77%), Semiconductor Index ($SOX -2.51%), and the Networking Index ($NWX -1.10%) ended. The Integrated Oil Index ($XOI -0.90%) and the Oil Services Index ($OSX -3.58%) both fell while the Gold & Silver Index ($XAU +0.28%) edged higher.
Charts courtesy of www.stockcharts.com
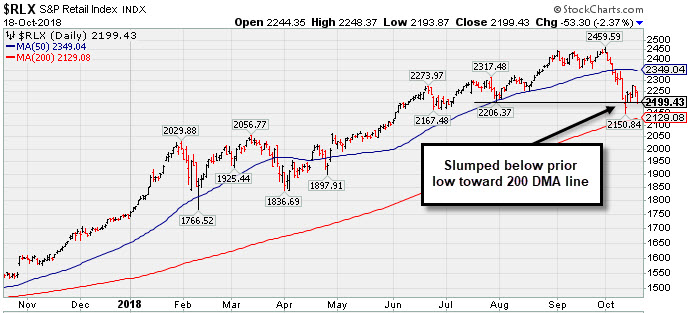 PICTURED: The Retail Index ($RLX -2.37%) recently violated its 50-day moving average and prior low, slumping toward its 200-day moving average line (red line).
| Oil Services |
$OSX |
138.57 |
-5.15 |
-3.58% |
-7.34% |
| Integrated Oil |
$XOI |
1,466.05 |
-13.31 |
-0.90% |
+9.77% |
| Semiconductor |
$SOX |
1,245.30 |
-32.01 |
-2.51% |
-0.62% |
| Networking |
$NWX |
524.83 |
-5.83 |
-1.10% |
+6.99% |
| Broker/Dealer |
$XBD |
261.62 |
-5.80 |
-2.17% |
-1.37% |
| Retail |
$RLX |
2,199.43 |
-53.30 |
-2.37% |
+26.86% |
| Gold & Silver |
$XAU |
70.05 |
+0.19 |
+0.27% |
-17.85% |
| Bank |
$BKX |
99.89 |
-1.85 |
-1.82% |
-6.39% |
| Biotech |
$BTK |
4,972.16 |
-89.68 |
-1.77% |
+17.76% |
|
|
|
 |
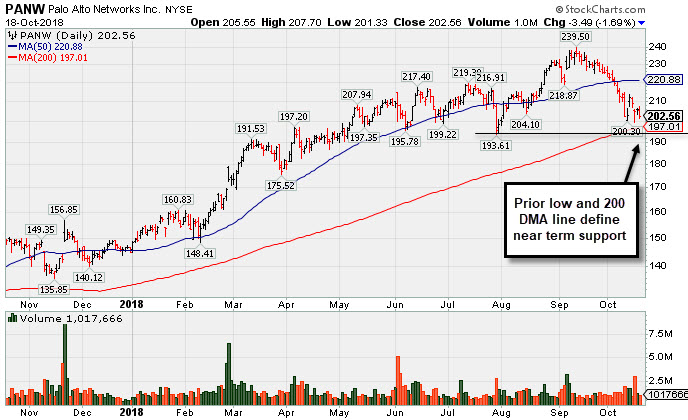
Consolidating Above 200-Day Moving Average Line
Kenneth J. Gruneisen - Passed the CAN SLIM® Master's Exam
Palo Alto Networks (PANW -$3.36 or -1.63% to $202.69) is consolidating above its 200-day moving average (DMA) line ($197) and prior low define the next important support level to watch. A rebound above the 50-day moving average (DMA) line ($220.88) is needed for its outlook to improve. Recently it reported +39% earnings on +29% sales revenues for the Jul '18 quarter, continuing its strong earnings track record. It has an Earnings Per Share (EPS) Rating of 98. It has a strong annual earnings (A criteria) history. PANW was last shown in this FSU section on 7/31/18 with an annotated graph under the headline, "Violated 50-day Average With Volume-driven Loss". It was noted in the 6/12/18 mid-day report (read here) that a valid secondary buy point existed from the 10 WMA line up to 5% above the most recent high ($214.69) or $225.42. The number of top-rated funds owning its shares rose from 892 in Jun '17 to 1,133 in Sep '18, a very reassuring sign concerning the I criteria. Its small supply (S criteria) of 93.8 million shares outstanding is another favorable characteristic. Its current Up/Down Volume Ratio of 0.8 is an indication that over the past 50 days it has been under distributional pressure. It has an A Timeliness Rating and a B Sponsorship Rating.
|
|
|
Color Codes Explained :
Y - Better candidates highlighted by our
staff of experts.
G - Previously featured
in past reports as yellow but may no longer be buyable under the
guidelines.
***Last / Change / Volume data in this table is the closing quote data***
Symbol/Exchange
Company Name
Industry Group |
PRICE |
CHANGE
(%Change) |
Day High |
Volume
(% DAV)
(% 50 day avg vol) |
52 Wk Hi
% From Hi |
Featured
Date |
Price
Featured |
Pivot Featured |
|
Max Buy |
SIVB
-
NASDAQ
S V B Financial Group
BANKING - Regional - Pacific Banks
|
$289.21
|
-7.77
-2.62% |
$297.93
|
512,559
126.56% of 50 DAV
50 DAV is 405,000
|
$333.74
-13.34%
|
8/6/2018
|
$314.77
|
PP = $329.75
|
|
MB = $346.24
|
Most Recent Note - 10/12/2018 12:58:41 PM
G - Slumped below its 200 DMA ($287) with above average volume behind today's 7th consecutive loss raising greater concerns while also undercutting its 7/02/18 low ($284.42). A rebound above the 50 DMA line ($319) is needed for its outlook to improve. See the latest FSU analysis for more details and an annotated graph.
>>> FEATURED STOCK ARTICLE : Weak Action Amid Broader Market Declines - 10/11/2018 |
View all notes |
Set NEW NOTE alert |
Company Profile |
SEC
News |
Chart |
Request a new note
C
A
S
I |
GMED
-
NYSE
Globus Medical Inc Cl A
CHEMICALS - Specialty Chemicals
|
$55.06
|
-0.18
-0.33% |
$56.15
|
779,938
129.13% of 50 DAV
50 DAV is 604,000
|
$57.55
-4.33%
|
9/26/2018
|
$56.11
|
PP = $57.65
|
|
MB = $60.53
|
Most Recent Note - 10/16/2018 4:00:53 PM
Y - Halted its slide at its 200 DMA line and today's rebound above the 50 DMA line ($52.76) helped its outlook improve. Color code is changed to yellow. Subsequent gains above the pivot point backed by more than +40% above average volume are needed to trigger a proper technical buy signal.
>>> FEATURED STOCK ARTICLE : Rallying Near Pivot Point With Volume-Driven Gains - 9/26/2018 |
View all notes |
Set NEW NOTE alert |
Company Profile |
SEC
News |
Chart |
Request a new note
C
A
S
I |
ZBRA
-
NASDAQ
Zebra Tech Corp Cl A
COMPUTER HARDWARE - Computer Peripherals
|
$168.49
|
-0.57
-0.34% |
$169.87
|
400,124
103.93% of 50 DAV
50 DAV is 385,000
|
$179.47
-6.12%
|
8/7/2018
|
$164.26
|
PP = $161.82
|
|
MB = $169.91
|
Most Recent Note - 10/16/2018 6:12:39 PM
G - Rebounded above the 50 DMA line ($167.93) with above average volume behind today's 4th consecutive gain, helping its outlook to improve. Still faces near-term resistance due to overhead supply up to $179.
>>> FEATURED STOCK ARTICLE : Hovering Near All-Time High With Strong Fundamentals - 9/24/2018 |
View all notes |
Set NEW NOTE alert |
Company Profile |
SEC
News |
Chart |
Request a new note
C
A
S
I |
CME
-
NASDAQ
C M E Group Inc
DIVERSIFIED SERVICES - Business/Management Services
|
$181.92
|
+0.60
0.33% |
$183.20
|
1,480,818
105.55% of 50 DAV
50 DAV is 1,403,000
|
$182.97
-0.57%
|
10/4/2018
|
$179.29
|
PP = $177.45
|
|
MB = $186.32
|
Most Recent Note - 10/15/2018 4:38:07 PM
Y - Pulled back amid broad market weakness (M criteria), undercutting prior highs in the $177 area, raising concerns. The 50 DMA line ($172) defines important near-term support.
>>> FEATURED STOCK ARTICLE : CME Group Blasted to New Record High - 10/4/2018 |
View all notes |
Set NEW NOTE alert |
Company Profile |
SEC
News |
Chart |
Request a new note
C
A
S
I |
FLT
-
NYSE
Fleetcor Technologies
DIVERSIFIED SERVICES - Business/Management Services
|
$206.73
|
-6.16
-2.89% |
$213.00
|
577,063
119.47% of 50 DAV
50 DAV is 483,000
|
$230.24
-10.21%
|
9/12/2018
|
$221.01
|
PP = $226.02
|
|
MB = $237.32
|
Most Recent Note - 10/12/2018 6:01:22 PM
G - Rebounded near its 200 DMA line ($209) with today's volume-driven gain after 6 consecutive losses. A rebound above the 50 DMA line ($217) is needed for its outlook to improve. Subsequent volume-driven gains above the pivot point are needed to trigger a new (or add-on) technical buy signal.
>>> FEATURED STOCK ARTICLE : Perched Within Close Striking Distance of New Pivot Point - 9/20/2018 |
View all notes |
Set NEW NOTE alert |
Company Profile |
SEC
News |
Chart |
Request a new note
C
A
S
I |
Symbol/Exchange
Company Name
Industry Group |
PRICE |
CHANGE
(%Change) |
Day High |
Volume
(% DAV)
(% 50 day avg vol) |
52 Wk Hi
% From Hi |
Featured
Date |
Price
Featured |
Pivot Featured |
|
Max Buy |
MA
-
NYSE
Mastercard Inc Cl A
Finance-CrdtCard/PmtPr
|
$203.62
|
-3.76
-1.81% |
$207.22
|
5,772,707
167.18% of 50 DAV
50 DAV is 3,453,000
|
$225.35
-9.64%
|
7/11/2018
|
$203.84
|
PP = $204.10
|
|
MB = $214.31
|
 Most Recent Note - 10/18/2018 12:41:20 PM
G - Found support above its 200 DMA line ($191), however, a rebound above the 50 DMA line ($211) is needed for its outlook to improve.
>>> FEATURED STOCK ARTICLE : Hovering Near High, Extended From Any Sound Base - 9/27/2018 |
View all notes |
Set NEW NOTE alert |
Company Profile |
SEC
News |
Chart |
Request a new note
C
A
S
I |
V
-
NYSE
Visa Inc Cl A
Finance-CrdtCard/PmtPr
|
$139.29
|
-3.16
-2.22% |
$142.46
|
10,131,386
130.64% of 50 DAV
50 DAV is 7,755,000
|
$151.56
-8.10%
|
4/26/2018
|
$126.68
|
PP = $126.98
|
|
MB = $133.33
|
Most Recent Note - 10/17/2018 5:47:18 PM
G - Following noted technical sell signals, a rebound above the 50 DMA line ($144) is needed for its outlook to improve. Found support after slumping near its 200 DMA line ($131) last week. See the latest FSU analysis for more details and a new annotated graph.
>>> FEATURED STOCK ARTICLE : Rebounding Toward 50-Day Moving Average - 10/17/2018 |
View all notes |
Set NEW NOTE alert |
Company Profile |
SEC
News |
Chart |
Request a new note
C
A
S
I |
TPL
-
NYSE
Texas Pacific Land Trust
Real Estate Dvlpmt/Ops
|
$784.41
|
-11.30
-1.42% |
$795.00
|
8,126
62.51% of 50 DAV
50 DAV is 13,000
|
$877.97
-10.66%
|
9/14/2018
|
$820.45
|
PP = $874.10
|
|
MB = $917.81
|
Most Recent Note - 10/15/2018 4:48:23 PM
G - Slumped further today after losses last week triggered technical sell signals. A rebound above the 50 DMA line ($828) is needed for its outlook to improve. The prior low ($760 on 8/15/18) defines the next important near-term support to watch.
>>> FEATURED STOCK ARTICLE : Slump Below 50-Day Moving Average Hurt Technical Stance - 10/12/2018 |
View all notes |
Set NEW NOTE alert |
Company Profile |
SEC
News |
Chart |
Request a new note
C
A
S
I |
ABMD
-
NASDAQ
Abiomed Inc
HEALTH SERVICES - Medical Instruments and Supplies
|
$386.63
|
-3.16
-0.81% |
$389.96
|
455,948
79.16% of 50 DAV
50 DAV is 576,000
|
$459.75
-15.90%
|
9/25/2018
|
$441.96
|
PP = $451.03
|
|
MB = $473.58
|
Most Recent Note - 10/12/2018 5:42:27 PM
G - Posted a gain today with above average volume, breaking a streak of 9 consecutive losses. A prompt rebound above the 50 DMA line ($391) would help its outlook improve.
>>> FEATURED STOCK ARTICLE : Quick Rebound Near Prior High - 9/25/2018 |
View all notes |
Set NEW NOTE alert |
Company Profile |
SEC
News |
Chart |
Request a new note
C
A
S
I |
DPZ
-
NYSE
Dominos Pizza Inc
Retail-Restaurants
|
$266.38
|
-1.31
-0.49% |
$268.68
|
814,943
150.64% of 50 DAV
50 DAV is 541,000
|
$305.34
-12.76%
|
8/13/2018
|
$288.60
|
PP = $293.91
|
|
MB = $308.61
|
Most Recent Note - 10/18/2018 12:37:10 PM
G - Managed a "positive reversal" on the prior session after testing near its 200 DMA line ($254), however, a rebound above the 50 DMA line ($286) is needed for its outlook to improve. The prior low ($253.63 on 7/31/18) and 200 DMA line define important near-term support to watch. Reported earnings +54% on +22% sales revenues for the Sep '18 quarter, continuing its strong earnings track record. See the latest FSU analysis for more details and an annotated graph.
>>> FEATURED STOCK ARTICLE : Sank Below 50 DMA Line Ahead of Earnings News - 10/15/2018 |
View all notes |
Set NEW NOTE alert |
Company Profile |
SEC
News |
Chart |
Request a new note
C
A
S
I |
Symbol/Exchange
Company Name
Industry Group |
PRICE |
CHANGE
(%Change) |
Day High |
Volume
(% DAV)
(% 50 day avg vol) |
52 Wk Hi
% From Hi |
Featured
Date |
Price
Featured |
Pivot Featured |
|
Max Buy |
FIVE
-
NASDAQ
Five Below Inc
Retail-DiscountandVariety
|
$115.04
|
-3.02
-2.56% |
$118.05
|
662,478
69.81% of 50 DAV
50 DAV is 949,000
|
$136.13
-15.49%
|
7/6/2018
|
$98.90
|
PP = $104.09
|
|
MB = $109.29
|
Most Recent Note - 10/16/2018 3:58:40 PM
G - It has not formed a sound base but has rebounded above the 50 DMA line ($118.68) with today's quiet gain helping its outlook to improve. The prior high ($109.09 on 7/19/18) defines the next important support level to watch.
>>> FEATURED STOCK ARTICLE : Retreating After +138% Rally in Under 12 Months - 10/2/2018 |
View all notes |
Set NEW NOTE alert |
Company Profile |
SEC
News |
Chart |
Request a new note
C
A
S
I |
NVEE
-
NASDAQ
N V 5 Global Inc
Comml Svcs-Consulting
|
$84.20
|
-0.79
-0.93% |
$85.18
|
41,052
48.30% of 50 DAV
50 DAV is 85,000
|
$92.75
-9.22%
|
6/15/2018
|
$7,070.00
|
PP = $72.00
|
|
MB = $75.60
|
Most Recent Note - 10/15/2018 4:35:29 PM
G - Posted a second consecutive small gain with lighter volume. A rebound above the 50 DMA line ($86.85) still is needed for its outlook to improve.
>>> FEATURED STOCK ARTICLE : Recently Slumped Below 50-Day Moving Average Line - 10/8/2018 |
View all notes |
Set NEW NOTE alert |
Company Profile |
SEC
News |
Chart |
Request a new note
C
A
S
I |
PANW
-
NYSE
Palo Alto Networks
Computer Sftwr-Security
|
$202.56
|
-3.49
-1.69% |
$207.70
|
1,140,794
88.16% of 50 DAV
50 DAV is 1,294,000
|
$239.50
-15.42%
|
6/12/2018
|
$206.55
|
PP = $214.69
|
|
MB = $225.42
|
Most Recent Note - 10/18/2018 5:12:18 PM
G - Its 200 DMA line ($197) and prior low define the next important support levels to watch. A rebound above the 50 DMA line ($221) is needed for its outlook to improve. See the latest FSU analysis for more details and a new annotated graph.
>>> FEATURED STOCK ARTICLE : Consolidating Above 200-Day Moving Average Line - 10/18/2018 |
View all notes |
Set NEW NOTE alert |
Company Profile |
SEC
News |
Chart |
Request a new note
C
A
S
I |
HQY
-
NASDAQ
Healthequity Inc
COMPUTER SOFTWARE and SERVICES - Healthcare Information Service
|
$87.52
|
+1.08
1.25% |
$87.72
|
638,297
81.21% of 50 DAV
50 DAV is 786,000
|
$99.99
-12.47%
|
8/13/2018
|
$82.39
|
PP = $83.44
|
|
MB = $87.61
|
Most Recent Note - 10/16/2018 4:09:40 PM
G - Posted a big gain today rebounding toward its 50 DMA line ($89.95) which may act as resistance. Found support near prior highs in the $82-83 area, but more damaging losses would raise serious concerns.
>>> FEATURED STOCK ARTICLE : Below 50-Day Moving Average Which May Act as Resistance - 10/16/2018 |
View all notes |
Set NEW NOTE alert |
Company Profile |
SEC
News |
Chart |
Request a new note
C
A
S
I |
OLLI
-
NASDAQ
Ollie's Bargain Outlet
Retail-DiscountandVariety
|
$89.55
|
-2.04
-2.23% |
$91.93
|
549,939
84.87% of 50 DAV
50 DAV is 648,000
|
$97.61
-8.26%
|
7/12/2018
|
$74.43
|
PP = $77.60
|
|
MB = $81.48
|
Most Recent Note - 10/12/2018 6:07:39 PM
G - Halted its slide at its 50 DMA line ($85.09) with a gain today on average volume after volume-driven losses this week. The 50 DMA line defines near-term support well above prior highs in the $77 area. Fundamentals remain strong.
>>> FEATURED STOCK ARTICLE : Encountered Distributional Pressure After a Great Rally - 10/9/2018 |
View all notes |
Set NEW NOTE alert |
Company Profile |
SEC
News |
Chart |
Request a new note
C
A
S
I |
Symbol/Exchange
Company Name
Industry Group |
PRICE |
CHANGE
(%Change) |
Day High |
Volume
(% DAV)
(% 50 day avg vol) |
52 Wk Hi
% From Hi |
Featured
Date |
Price
Featured |
Pivot Featured |
|
Max Buy |
|
|
|
THESE ARE NOT BUY RECOMMENDATIONS!
Comments contained in the body of this report are technical
opinions only. The material herein has been obtained
from sources believed to be reliable and accurate, however,
its accuracy and completeness cannot be guaranteed.
This site is not an investment advisor, hence it does
not endorse or recommend any securities or other investments.
Any recommendation contained in this report may not
be suitable for all investors and it is not to be deemed
an offer or solicitation on our part with respect to
the purchase or sale of any securities. All trademarks,
service marks and trade names appearing in this report
are the property of their respective owners, and are
likewise used for identification purposes only.
This report is a service available
only to active Paid Premium Members.
You may opt-out of receiving report notifications
at any time. Questions or comments may be submitted
by writing to Premium Membership Services 665 S.E. 10 Street, Suite 201 Deerfield Beach, FL 33441-5634 or by calling 1-800-965-8307
or 954-785-1121.
|
|
|