You are not logged in.
This means you
CAN ONLY VIEW reports that were published prior to Thursday, March 20, 2025.
You
MUST UPGRADE YOUR MEMBERSHIP if you want to see any current reports.
AFTER MARKET UPDATE - FRIDAY, DECEMBER 15TH, 2023
Previous After Market Report Next After Market Report >>>
|
|
|
|
DOW |
+56.81 |
37,305.16 |
+0.15% |
|
Volume |
3,847,592,100 |
+155% |
|
Volume |
8,897,592,100 |
+10% |
|
NASDAQ |
+52.36 |
14,813.92 |
+0.35% |
|
Advancers |
887 |
32% |
|
Advancers |
1,750 |
40% |
|
S&P 500 |
-0.36 |
4,719.19 |
-0.01% |
|
Decliners |
1,864 |
68% |
|
Decliners |
2,572 |
59% |
|
Russell 2000 |
-15.39 |
1,985.13 |
-0.77% |
|
52 Wk Highs |
184 |
|
|
52 Wk Highs |
253 |
|
|
S&P 600 |
-11.34 |
1,290.88 |
-0.87% |
|
52 Wk Lows |
12 |
|
|
52 Wk Lows |
108 |
|
|
 |
Major Indices Ended Session Mixed After a Week of Solid Gains
Kenneth J. Gruneisen - Passed the CAN SLIM® Master's Exam
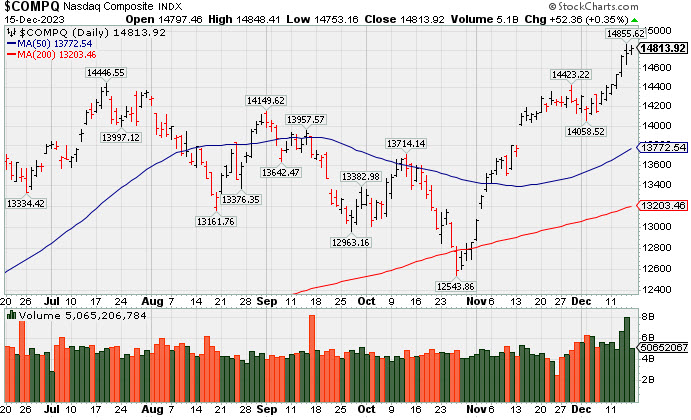
The Nasdaq Composite climbed 0.4% and the Dow Jones Industrial Average gained 0.2%. Meanwhile, the S&P 500 closed little changed from yesterday and the Russell 2000 declined 0.8%. Volume was reported higher than the prior session totals on the NYSE and on the Nasdaq exchange, inflated by options expirations. Breadth was negative as decliners led advancers by a 2-1 margin on the NYSE and by almost a 3-2 margin on the Nasdaq exchange. There were 108 high-ranked companies from the Leaders List that hit new 52-week highs and were listed on the BreakOuts Page, versus the total of 123 on the prior session. New 52-week highs totals contracted yet still outnumbered new 52-week lows totals on the NYSE and on the Nasdaq exchange. The major indices are in a confirmed uptrend (M criteria). New buying efforts should be only made in stocks fitting all key criteria of the fact-based investment system.
PICTURED: The Nasdaq Composite hit a new 2023 high as it posted a 7th consecutive gain. It is still -8.6% off its November 2021 all-time high (not shown). Three of the S&P 500 sectors closed higher, boosted by their mega cap constituents, while eight sectors declined. The information technology sector (+0.7%) saw the biggest gain while the utiltiies sector (-1.7%) registered the biggest loss. The 2-yr note settled at 4.46%, six basis points higher, while the 10-yr note yield settled unchanged from yesterday at 3.93%.
New economic data included generally soft industrial production data for November, and further slippage in the preliminary December S&P Global US Manufacturing PMI to 48.2 from the final reading of 49.4 for November.
|
 Kenneth J. Gruneisen started out as a licensed stockbroker in August 1987, a couple of months prior to the historic stock market crash that took the Dow Jones Industrial Average down -22.6% in a single day. He has published daily fact-based fundamental and technical analysis on high-ranked stocks online for two decades. Through FACTBASEDINVESTING.COM, Kenneth provides educational articles, news, market commentary, and other information regarding proven investment systems that work in good times and bad.
Comments contained in the body of this report are technical opinions only and are not necessarily those of Gruneisen Growth Corp. The material herein has been obtained from sources believed to be reliable and accurate, however, its accuracy and completeness cannot be guaranteed. Our firm, employees, and customers may effect transactions, including transactions contrary to any recommendation herein, or have positions in the securities mentioned herein or options with respect thereto. Any recommendation contained in this report may not be suitable for all investors and it is not to be deemed an offer or solicitation on our part with respect to the purchase or sale of any securities. |
|
 |
Retail and Semiconductor Indexes Rose
Kenneth J. Gruneisen - Passed the CAN SLIM® Master's Exam
The Bank Index ($BKX -0.79%) and the Broker/Dealer Index ($XBD -1.12%) pulled back while the Retail Index ($RLX +0.98%) posted a solid gain on Friday. The tech sector was mixed as the Biotech Index ($BTK -1.02%) and Networking Index ($NWX -0.37%) lost ground while the Semiconductor Index ($SOX +0.48%) posted a modest gain. Commodity-linked groups had a slightly negative bias as the Gold & Silver Index ($XAU -0.40%), Integrated Oil Index ($XOI -0.71%), and the Oil Services Index ($OSX -0.13%) each lost some ground.
PICTURED: The Integrated Oil Index ($XOI -0.71%) met resistance near its 50-day moving average (DMA) line after rebounding from near its 200 DMA line.
| Oil Services |
$OSX |
83.03 |
-0.10 |
-0.13% |
-0.99% |
| Integrated Oil |
$XOI |
1,843.24 |
-13.14 |
-0.71% |
+3.13% |
| Semiconductor |
$SOX |
4,117.00 |
+19.53 |
+0.48% |
+62.59% |
| Networking |
$NWX |
818.97 |
-3.08 |
-0.37% |
+4.55% |
| Broker/Dealer |
$XBD |
537.20 |
-6.10 |
-1.12% |
+19.61% |
| Retail |
$RLX |
3,860.07 |
+37.44 |
+0.98% |
+40.16% |
| Gold & Silver |
$XAU |
123.76 |
-0.49 |
-0.40% |
+2.40% |
| Bank |
$BKX |
95.83 |
-0.77 |
-0.79% |
-4.98% |
| Biotech |
$BTK |
5,274.00 |
-54.35 |
-1.02% |
-0.13% |
|
|
|
 |
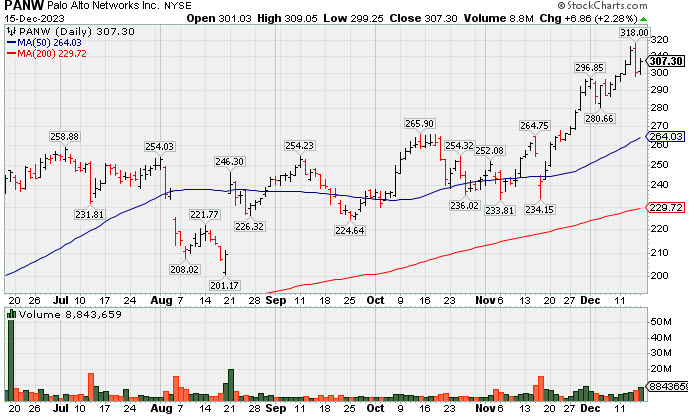
Consolidating After Volume-Driven Gains for All-Time Highs
Kenneth J. Gruneisen - Passed the CAN SLIM® Master's Exam
Palo Alto Networks (PANW +$6.86 or +2.28% to $307.30) is consolidating following a noted streak of 5 consecutive gains to new all-time highs. Prior highs in the $265 area define initial support to watch above its 50-day moving average (DMA) line ($264.02). PANW was highlighted in yellow in the 11/13/23 mid-day report (read here) with a new pivot point cited based on its 10/13/23 high after a short flat base. It was last shown in great detail on 11/13/23 with an annotated graph under the headline, "Earnings New Due While Perched Near Prior High". Subsequent gains above the pivot point backed by at least +40% above average volume triggered a proper technical buy signal. Fundamentals have been strong through the Oct '23 quarter with earnings +66% on +20% sales revenues versus the year-ago period. It has a 98 Earnings Per Share Rating. It had a downturn in FY '20 earnings like many companies during the pandemic but has continued posting strong annual earnings (A criteria) since. . PANW's share price was impacted by a 3:1 split on 9/14/22 and it now has a supply (S criteria) of 315.3 million shares outstanding. The number of top-rated funds owning its shares rose from 892 in Jun '17 to 3,123 in Sep '23, a very reassuring sign concerning the I criteria. Its current Up/Down Volume Ratio of 1.7 is an unbiased indication that over the past 50 days it has been under slight accumulation. It has an A Timeliness Rating and a C Sponsorship Rating.
|
|
|
Color Codes Explained :
Y - Better candidates highlighted by our
staff of experts.
G - Previously featured
in past reports as yellow but may no longer be buyable under the
guidelines.
***Last / Change / Volume data in this table is the closing quote data***
Symbol/Exchange
Company Name
Industry Group |
PRICE |
CHANGE
(%Change) |
Day High |
Volume
(% DAV)
(% 50 day avg vol) |
52 Wk Hi
% From Hi |
Featured
Date |
Price
Featured |
Pivot Featured |
|
Max Buy |
 ANET
-
NYSE
ANET
-
NYSE
Arista Networks
Computer-Networking
|
$235.60
|
+4.57
1.98% |
$237.21
|
2,868,915
131.00% of 50 DAV
50 DAV is 2,190,000
|
$234.40
0.51%
|
10/31/2023
|
$188.84
|
PP = $198.80
|
|
MB = $208.74
|
Most Recent Note - 12/13/2023 5:49:05 PM
G - Holding its ground perched at its all-time high, extended from any sound base. Its 50 DMA line ($205) defines near-term support above prior highs in the $198 area. Fundamentals remain strong.
>>> FEATURED STOCK ARTICLE : Made Gradual Progress Since Latest Breakout - 12/6/2023 |
View all notes |
Set NEW NOTE alert |
Company Profile |
SEC
News |
Chart |
Request a new note
C
A
S
I |
NVO
-
NYSE
Novo Nordisk ADR
Medical-Ethical Drugs
|
$97.10
|
-0.90
-0.92% |
$97.53
|
5,228,025
110.39% of 50 DAV
50 DAV is 4,736,000
|
$105.69
-8.13%
|
11/2/2023
|
$100.97
|
PP = $104.10
|
|
MB = $109.31
|
Most Recent Note - 12/13/2023 5:46:21 PM
Y - Color code is changed to yellow after it rebounded and closed the session just above the 50 DMA line ($98.72) helping its outlook to improve.
>>> FEATURED STOCK ARTICLE : Managed a "Positive Reversal" but Still Below 50-Day Moving Average - 12/11/2023 |
View all notes |
Set NEW NOTE alert |
Company Profile |
SEC
News |
Chart |
Request a new note
C
A
S
I |
QLYS
-
NASDAQ
Qualys
Computer Sftwr-Security
|
$198.85
|
+3.24
1.66% |
$200.84
|
1,284,805
346.31% of 50 DAV
50 DAV is 371,000
|
$195.97
1.47%
|
11/3/2023
|
$167.50
|
PP = $165.03
|
|
MB = $173.28
|
 Most Recent Note - 12/15/2023 6:57:36 PM
G - Volume was higher behind today's 8th consecutive gain hitting another new all-time high, extended from any sound base. Its 50 DMA line ($171.76) defines initial support to watch on pullbacks above the prior high ($165).
>>> FEATURED STOCK ARTICLE : Extended From Base Following Big Breakout - 12/12/2023 |
View all notes |
Set NEW NOTE alert |
Company Profile |
SEC
News |
Chart |
Request a new note
C
A
S
I |
AXON
-
NASDAQ
Axon Enterprise
Security/Sfty
|
$255.98
|
+2.86
1.13% |
$256.82
|
815,489
180.42% of 50 DAV
50 DAV is 452,000
|
$253.73
0.89%
|
11/8/2023
|
$127.84
|
PP = $223.30
|
|
MB = $234.47
|
Most Recent Note - 12/13/2023 5:39:30 PM
G - Hit a new all-time high with today's 6th consecutive gain backed by light volume. On pullbacks, the prior highs in the $229-231 area define near-term support to watch above its 50-day moving average (DMA) line ($219.71). See the latest FSU analysis for more details and a new annotated graph.
>>> FEATURED STOCK ARTICLE : Axon Enterprise Hits New High With 6th Straight Gain - 12/13/2023 |
View all notes |
Set NEW NOTE alert |
Company Profile |
SEC
News |
Chart |
Request a new note
C
A
S
I |
TDG
-
NYSE
TransDigm Group
Aerospace/Defense
|
$985.59
|
-1.41
-0.14% |
$994.50
|
485,750
201.56% of 50 DAV
50 DAV is 241,000
|
$1,015.72
-2.97%
|
12/12/2023
|
$1,000.39
|
PP = $1,013.18
|
|
MB = $1,063.84
|
Most Recent Note - 12/14/2023 5:54:55 PM
Y - Suffered a loss today with above-average volume undercutting prior highs and breaking a streak of 6 consecutive gains backed by lackluster volume. The new pivot point cited was based on its 11/14/23 high plus 10 cents, however, gains above the pivot point were not backed by the +40% above-average volume necessary to trigger a proper new technical buy signal. Fundamentals remain strong. Recent lows in the $950 area define near-term support to watch on pullbacks. See the latest FSU analysis for more details and a new annotated graph.
>>> FEATURED STOCK ARTICLE : Volume-Driven Loss Breaks Streak of 6 Straight Gains - 12/14/2023 |
View all notes |
Set NEW NOTE alert |
Company Profile |
SEC
News |
Chart |
Request a new note
C
A
S
I |
Symbol/Exchange
Company Name
Industry Group |
PRICE |
CHANGE
(%Change) |
Day High |
Volume
(% DAV)
(% 50 day avg vol) |
52 Wk Hi
% From Hi |
Featured
Date |
Price
Featured |
Pivot Featured |
|
Max Buy |
PANW
-
NASDAQ
Palo Alto Networks
Computer Sftwr-Security
|
$307.30
|
+6.86
2.28% |
$309.05
|
9,107,938
210.39% of 50 DAV
50 DAV is 4,329,000
|
$318.00
-3.36%
|
11/13/2023
|
$255.90
|
PP = $266.00
|
|
MB = $279.30
|
Most Recent Note - 12/15/2023 6:56:08 PM
G - Consolidating after a noted streak of 5 consecutive gains to new all-time highs. Prior highs in the $265 area define initial support to watch above its 50 DMA line ($264). Fundamentals remain strong. See the latest FSU analysis for more detailed analysis and a new annotated graph.
>>> FEATURED STOCK ARTICLE : Consolidating After Volume-Driven Gains for All-Time Highs - 12/15/2023 |
View all notes |
Set NEW NOTE alert |
Company Profile |
SEC
News |
Chart |
Request a new note
C
A
S
I |
URI
-
NYSE
United Rentals
Comml Svcs-Leasing
|
$571.74
|
+2.31
0.41% |
$581.00
|
1,486,027
192.99% of 50 DAV
50 DAV is 770,000
|
$571.08
0.12%
|
12/1/2023
|
$499.51
|
PP = $488.73
|
|
MB = $513.17
|
Most Recent Note - 12/14/2023 6:05:19 PM
G - Volume was heavier behind today's 7th consecutive gain while hitting another new all-time high. Prior highs in the $492 area define near-term support to watch on pullbacks.
>>> FEATURED STOCK ARTICLE : New Breakout For United Rentals - 12/1/2023 |
View all notes |
Set NEW NOTE alert |
Company Profile |
SEC
News |
Chart |
Request a new note
C
A
S
I |
AMPH
-
NASDAQ
Amphastar Pharm
Medical-Biomed/Biotech
|
$56.56
|
-1.60
-2.75% |
$58.70
|
925,955
228.63% of 50 DAV
50 DAV is 405,000
|
$67.66
-16.41%
|
12/4/2023
|
$60.84
|
PP = $58.35
|
|
MB = $61.27
|
Most Recent Note - 12/14/2023 5:56:57 PM
Y - Suffered a big loss today with twice its average volume raising concerns while slumping back below the pivot point cited based on its 11/21/23 high after a cup-with-handle base. Little resistance remains due to overhead supply. Fundamentals remain strong.
>>> FEATURED STOCK ARTICLE : Amphastar Pharm on Track for 7th Weekly Gain - 12/4/2023 |
View all notes |
Set NEW NOTE alert |
Company Profile |
SEC
News |
Chart |
Request a new note
C
A
S
I |
TBBK
-
NASDAQ
The Bancorp
Banks-Northeast
|
$40.51
|
-1.00
-2.41% |
$42.07
|
1,117,331
276.57% of 50 DAV
50 DAV is 404,000
|
$42.27
-4.16%
|
12/4/2023
|
$39.88
|
PP = $41.62
|
|
MB = $43.70
|
Most Recent Note - 12/14/2023 6:03:30 PM
Y - Posted a 3rd consecutive gain today with +34% above average volume, hitting a new 52-week high but finishing near the middle of its intra-day range and below its pivot point. Subsequent gains and a strong close above the pivot point backed by at least +40% above average volume may trigger a proper technical buy signal.
>>> FEATURED STOCK ARTICLE : The Bancorp is Perched Near High with Strong Fundamentals - 12/5/2023 |
View all notes |
Set NEW NOTE alert |
Company Profile |
SEC
News |
Chart |
Request a new note
C
A
S
I |
LULU
-
NASDAQ
lululemon athletica
Retail-Apparel/Shoes/Acc
|
$491.33
|
+2.03
0.41% |
$492.19
|
2,676,647
111.25% of 50 DAV
50 DAV is 2,406,000
|
$508.43
-3.36%
|
12/8/2023
|
$490.61
|
PP = $485.93
|
|
MB = $510.23
|
Most Recent Note - 12/14/2023 5:59:52 PM
Y - Pulled back today with higher (near average) volume after 6 consecutive gains, retreating from its all-time high. Its 2021 high of $485 defines initial support to watch after its recent breakout from a 2+ year base.
>>> FEATURED STOCK ARTICLE : Lululemon Breaks Out to New All-Time High - 12/8/2023 |
View all notes |
Set NEW NOTE alert |
Company Profile |
SEC
News |
Chart |
Request a new note
C
A
S
I |
Symbol/Exchange
Company Name
Industry Group |
PRICE |
CHANGE
(%Change) |
Day High |
Volume
(% DAV)
(% 50 day avg vol) |
52 Wk Hi
% From Hi |
Featured
Date |
Price
Featured |
Pivot Featured |
|
Max Buy |
|
|
|
THESE ARE NOT BUY RECOMMENDATIONS!
Comments contained in the body of this report are technical
opinions only. The material herein has been obtained
from sources believed to be reliable and accurate, however,
its accuracy and completeness cannot be guaranteed.
This site is not an investment advisor, hence it does
not endorse or recommend any securities or other investments.
Any recommendation contained in this report may not
be suitable for all investors and it is not to be deemed
an offer or solicitation on our part with respect to
the purchase or sale of any securities. All trademarks,
service marks and trade names appearing in this report
are the property of their respective owners, and are
likewise used for identification purposes only.
This report is a service available
only to active Paid Premium Members.
You may opt-out of receiving report notifications
at any time. Questions or comments may be submitted
by writing to Premium Membership Services 665 S.E. 10 Street, Suite 201 Deerfield Beach, FL 33441-5634 or by calling 1-800-965-8307
or 954-785-1121.
|
|
|