You are not logged in.
This means you
CAN ONLY VIEW reports that were published prior to Sunday, April 13, 2025.
You
MUST UPGRADE YOUR MEMBERSHIP if you want to see any current reports.
AFTER MARKET UPDATE - MONDAY, NOVEMBER 13TH, 2023
Previous After Market Report Next After Market Report >>>
|
|
|
|
DOW |
+54.77 |
34,337.87 |
+0.16% |
|
Volume |
788,116,255 |
-10% |
|
Volume |
4,360,378,100 |
-8% |
|
NASDAQ |
-30.36 |
13,767.74 |
-0.22% |
|
Advancers |
1,356 |
48% |
|
Advancers |
2,181 |
51% |
|
S&P 500 |
-3.69 |
4,411.55 |
-0.08% |
|
Decliners |
1,448 |
52% |
|
Decliners |
2,081 |
49% |
|
Russell 2000 |
+0.18 |
1,705.50 |
+0.01% |
|
52 Wk Highs |
48 |
|
|
52 Wk Highs |
67 |
|
|
S&P 600 |
-0.76 |
1,113.75 |
-0.07% |
|
52 Wk Lows |
75 |
|
|
52 Wk Lows |
249 |
|
|
 |
Major Indices Were Mixed and Little Changed
Kenneth J. Gruneisen - Passed the CAN SLIM® Master's Exam
15 of the 30 Dow components were up and 15 were down while the major indices ended mixed and little changed The volume totals were mixed, lighter than the prior session on the NYSE and higher on the Nasdaq exchange. Advancers and decliners were evenly mixed on the NYSE and the Nasdaq exchange. There were 60 high-ranked companies from the Leaders List that hit new 52-week highs and were listed on the BreakOuts Page, versus the total of 48 on the prior session. New 52-week lows totals still solidly outnumbered new 52-week highs on the NYSE and on the Nasdaq exchange. The major indices recently signaled a new confirmed uptrend for the market (M criteria). New buying efforts should be only made in stocks fitting all key criteria of the fact-based investment system.
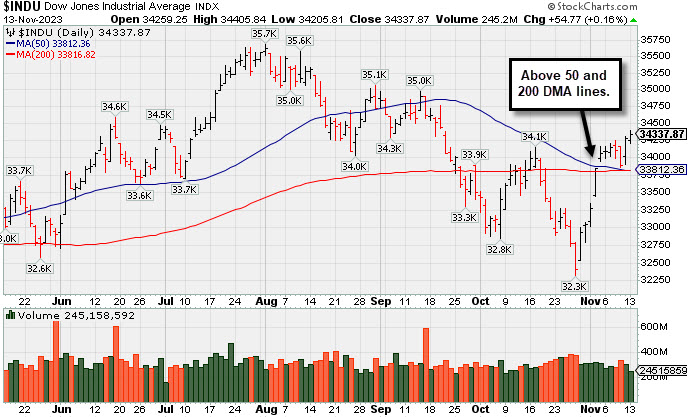
PICTURED: The Dow Jones Industrial Average is making further technical progress since rebounding above its 50-day and 200-day moving average (DMA) lines. The energy sector (+0.7%) saw the largest gain, rising alongside oil ($78.34/bbl, +1.13, +1.5%). Health care (+0.6%) and consumer staples (+0.4%) followed. Meanwhile, utilities (-1.2%), real estate (-0.8%), and the information technology (-0.5%) sectors were worst performers. Boeing (BA +4.01%) was a standout winner on news that it received multiple orders at the Dubai Airshow and a Bloomberg report that China is considering ending its freeze of Boeing with a new 737 Max deal.
The 2-yr note yield settled one basis point lower at 5.04%. The 10-yr note yield settled unchanged. Notably, Treasuries did not react much to the report from Moody's after Friday's close that it had downgraded the U.S. credit outlook to negative from stable based in part on concerns about partisan politics and the potential for budget deficits that remain very large. Moody's, did not downgrade its U.S. credit rating, which remains AAA. The release of the October Consumer Price Index is due on Tuesday.
|
 Kenneth J. Gruneisen started out as a licensed stockbroker in August 1987, a couple of months prior to the historic stock market crash that took the Dow Jones Industrial Average down -22.6% in a single day. He has published daily fact-based fundamental and technical analysis on high-ranked stocks online for two decades. Through FACTBASEDINVESTING.COM, Kenneth provides educational articles, news, market commentary, and other information regarding proven investment systems that work in good times and bad.
Comments contained in the body of this report are technical opinions only and are not necessarily those of Gruneisen Growth Corp. The material herein has been obtained from sources believed to be reliable and accurate, however, its accuracy and completeness cannot be guaranteed. Our firm, employees, and customers may effect transactions, including transactions contrary to any recommendation herein, or have positions in the securities mentioned herein or options with respect thereto. Any recommendation contained in this report may not be suitable for all investors and it is not to be deemed an offer or solicitation on our part with respect to the purchase or sale of any securities. |
|
 |
Retail, Financial, Tech, and Gold & Silver Indexes Fell
Kenneth J. Gruneisen - Passed the CAN SLIM® Master's Exam
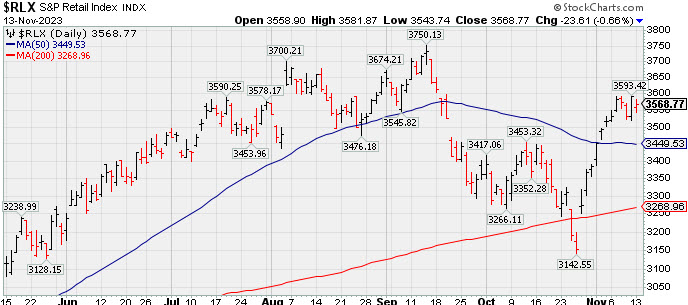
The Retail Index ($RLX -0.66%), Bank Index ($BKX -0.22%), and the Broker/Dealer Index ($XBD -0.44%) each lost ground. The tech sector had a negative bias as the Semiconductor Index ($SOX -0.97%) and the Networking Index ($NWX -0.83%) ended lower, meanwhile, the Biotech Index ($BTK +0.03%) finished flat. The Gold & Silver Index ($XAU -1.08%) fell while the Integrated Oil Index ($XOI +0.81%) and the Oil Services Index ($OSX +0.50%) each ended higher.
PICTURED: The Retail Index ($RLX -0.66%) rebounded above its 50-day and 200-day moving average (DMA) lines from its October 2023 low.
| Oil Services |
$OSX |
84.86 |
+0.42 |
+0.50% |
+1.19% |
| Integrated Oil |
$XOI |
1,837.98 |
+14.80 |
+0.81% |
+2.84% |
| Semiconductor |
$SOX |
3,556.74 |
-34.99 |
-0.97% |
+40.47% |
| Networking |
$NWX |
692.09 |
-5.76 |
-0.83% |
-11.65% |
| Broker/Dealer |
$XBD |
477.93 |
-2.10 |
-0.44% |
+6.41% |
| Retail |
$RLX |
3,568.77 |
-23.61 |
-0.66% |
+29.58% |
| Gold & Silver |
$XAU |
106.72 |
-1.17 |
-1.08% |
-11.70% |
| Bank |
$BKX |
77.82 |
-0.17 |
-0.22% |
-22.84% |
| Biotech |
$BTK |
4,640.58 |
+1.49 |
+0.03% |
-12.13% |
|
|
|
 |
Earnings New Due While Perched Near Prior High
Kenneth J. Gruneisen - Passed the CAN SLIM® Master's Exam
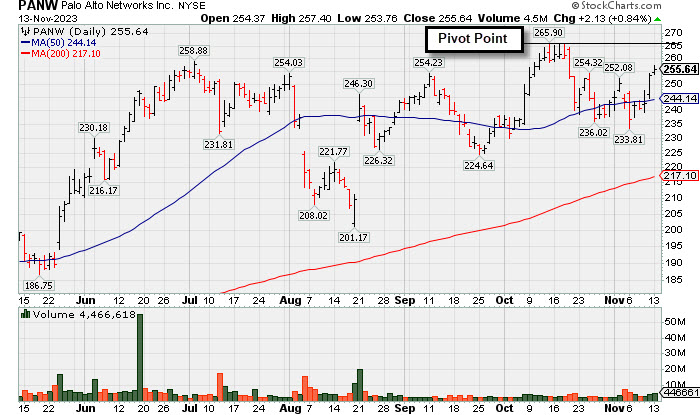
Palo Alto Networks (PANW +$2.12 or +0.84% to $255.63) was highlighted in yellow in the earlier mid-day report (read here) with a new pivot point cited based on its 10/13/23 high after a short flat base. It rebounded further above its 50-day moving average DMA line ($244) toward the prior high with today's 3rd consecutive gain. Subsequent gains above the pivot point backed by at least +40% above average volume are needed to trigger a proper technical buy signal. Keep in mind it is due to report Oct '23 quarterly results on 11/15/23. Volume and volatility often increase near earnings news. Fundamentals have been strong through the Jul '23 quarter with earnings +80% on +26% sales revenues versus the year-ago period. PANW was last shown in great detail on 7/13/23 with an annotated graph under the headline, "Volume Cooling While Hovering Near High". It showed resilience since dropped from the Featured Stocks list on 8/09/23. It has a 98 Earnings Per Share Rating. It has shown bullish action after reporting Apr '23 quarterly earnings +83% on +24% sales revenues versus the year-ago period. Prior quarterly comparisons were above the +25% minimum earnings guideline (C criteria). It had a downturn in FY '20 earnings like many companies during the pandemic but has continued posting strong annual earnings (A criteria) since. PANW's share price was impacted by a 3:1 split on 9/14/22 and it now has a supply (S criteria) of 305.9 million shares outstanding. The number of top-rated funds owning its shares rose from 892 in Jun '17 to 3,095 in Sep '23, a very reassuring sign concerning the I criteria. Its current Up/Down Volume Ratio of 1.2 is an unbiased indication that over the past 50 days it has been under slight accumulation. It has an A Timeliness Rating and a C Sponsorship Rating.
|
|
|
Color Codes Explained :
Y - Better candidates highlighted by our
staff of experts.
G - Previously featured
in past reports as yellow but may no longer be buyable under the
guidelines.
***Last / Change / Volume data in this table is the closing quote data***
Symbol/Exchange
Company Name
Industry Group |
PRICE |
CHANGE
(%Change) |
Day High |
Volume
(% DAV)
(% 50 day avg vol) |
52 Wk Hi
% From Hi |
Featured
Date |
Price
Featured |
Pivot Featured |
|
Max Buy |
 ANET
-
NYSE
ANET
-
NYSE
Arista Networks
Computer-Networking
|
$206.84
|
-4.80
-2.27% |
$208.99
|
3,416,418
155.79% of 50 DAV
50 DAV is 2,193,000
|
$216.29
-4.37%
|
10/31/2023
|
$188.84
|
PP = $198.80
|
|
MB = $208.74
|
Most Recent Note - 11/10/2023 12:14:52 PM
G - Consolidating this week after 5 consecutive gains to new all-time highs. Prior highs in the $198 area define near-term support above its 50 DMA line ($192). Bullish action came after it reported Sep '23 quarterly earnings +46% on +28% sales revenues versus the year-ago period.
>>> FEATURED STOCK ARTICLE : Powerful Gain Following Earnings Report for Arista Networks - 10/31/2023 |
View all notes |
Set NEW NOTE alert |
Company Profile |
SEC
News |
Chart |
Request a new note
C
A
S
I |
NVO
-
NYSE
Novo Nordisk ADR
Medical-Ethical Drugs
|
$101.19
|
+1.16
1.16% |
$101.41
|
5,632,668
117.76% of 50 DAV
50 DAV is 4,783,000
|
$104.00
-2.70%
|
11/2/2023
|
$100.97
|
PP = $104.10
|
|
MB = $109.31
|
Most Recent Note - 11/10/2023 5:18:22 PM
Y - Posted a small gain today while churning above-average volume. Its 50 DMA line ($95.96) defines important near-term support to watch on pullbacks. Subsequent gains for new highs backed by at least +40% above average volume are needed to trigger a technical buy signal.
>>> FEATURED STOCK ARTICLE : Approaching Prior High With Strong Fundamentals - 11/2/2023 |
View all notes |
Set NEW NOTE alert |
Company Profile |
SEC
News |
Chart |
Request a new note
C
A
S
I |
QLYS
-
NASDAQ
Qualys
Computer Sftwr-Security
|
$171.72
|
+3.74
2.23% |
$171.83
|
455,939
132.54% of 50 DAV
50 DAV is 344,000
|
$172.83
-0.64%
|
11/3/2023
|
$167.50
|
PP = $165.03
|
|
MB = $173.28
|
Most Recent Note - 11/10/2023 5:14:29 PM
Y - Posted a solid gain with above-average volume today for a second-best-ever close. Prior high ($165) defines initial support to watch on pullbacks.
>>> FEATURED STOCK ARTICLE : Powerful Breakout for Qualys - 11/3/2023 |
View all notes |
Set NEW NOTE alert |
Company Profile |
SEC
News |
Chart |
Request a new note
C
A
S
I |
AXON
-
NASDAQ
Axon Enterprise
Security/Sfty
|
$217.94
|
+2.24
1.04% |
$220.00
|
830,258
174.42% of 50 DAV
50 DAV is 476,000
|
$231.71
-5.94%
|
11/8/2023
|
$127.84
|
PP = $223.30
|
|
MB = $234.47
|
Most Recent Note - 11/10/2023 5:20:19 PM
Y - Posted a gain with above-average volume today. Negated the 11/08/23 gain with a big volume-driven loss raising concerns while undercutting the new pivot point cited. More damaging losses would raise greater concerns.
>>> FEATURED STOCK ARTICLE : Breakout for Axon as it Returns to Featured Stocks List - 11/8/2023 |
View all notes |
Set NEW NOTE alert |
Company Profile |
SEC
News |
Chart |
Request a new note
C
A
S
I |
TDG
-
NYSE
TransDigm Group
Aerospace/Defense
|
$992.50
|
+19.43
2.00% |
$996.25
|
355,077
146.12% of 50 DAV
50 DAV is 243,000
|
$990.10
0.24%
|
11/9/2023
|
$982.68
|
PP = $940.10
|
|
MB = $987.11
|
Most Recent Note - 11/10/2023 5:16:41 PM
G - Color code is changed to green after rising above its "max buy" level for a new all-time with today's 11th consecutive gain. Reported Sep '23 quarterly earnings +46% on +23% sales revenues versus the year-ago period, its 10th consecutive comparison above the +25% minimum earnings guideline (C criteria).
>>> FEATURED STOCK ARTICLE : TransDigm's Big Gap Up Gain Triggered Technical Buy Signal - 11/9/2023 |
View all notes |
Set NEW NOTE alert |
Company Profile |
SEC
News |
Chart |
Request a new note
C
A
S
I |
Symbol/Exchange
Company Name
Industry Group |
PRICE |
CHANGE
(%Change) |
Day High |
Volume
(% DAV)
(% 50 day avg vol) |
52 Wk Hi
% From Hi |
Featured
Date |
Price
Featured |
Pivot Featured |
|
Max Buy |
|
|
|
THESE ARE NOT BUY RECOMMENDATIONS!
Comments contained in the body of this report are technical
opinions only. The material herein has been obtained
from sources believed to be reliable and accurate, however,
its accuracy and completeness cannot be guaranteed.
This site is not an investment advisor, hence it does
not endorse or recommend any securities or other investments.
Any recommendation contained in this report may not
be suitable for all investors and it is not to be deemed
an offer or solicitation on our part with respect to
the purchase or sale of any securities. All trademarks,
service marks and trade names appearing in this report
are the property of their respective owners, and are
likewise used for identification purposes only.
This report is a service available
only to active Paid Premium Members.
You may opt-out of receiving report notifications
at any time. Questions or comments may be submitted
by writing to Premium Membership Services 665 S.E. 10 Street, Suite 201 Deerfield Beach, FL 33441-5634 or by calling 1-800-965-8307
or 954-785-1121.
|
|
|