Symbol/Exchange
Company Name
Industry Group |
PRICE |
CHANGE
(%Change) |
Day High |
Volume
(% DAV)
(% 50 day avg vol) |
52 Wk Hi
% From Hi |
Featured
Date |
Price
Featured |
Pivot Featured |
|
Max Buy |
 STRL
-
NASDAQ
STRL
-
NASDAQ
Sterling Infrastructure
Bldg-Heavy Construction
|
$59.99
|
+1.24
2.11% |
$60.24
|
339,741
103.90% of 50 DAV
50 DAV is 327,000
|
$60.58
-0.97%
|
12/14/2022
|
$32.41
|
PP = $33.72
|
|
MB = $35.41
|
 Most Recent Note - 7/31/2023 4:24:11 PM
G - Posted a 5th consecutive gain today for a best-ever close. It is very extended from any sound base and its 50 DMA line ($53.58) defines near-term support to watch. Mar '23 quarterly earnings were below the +25% minimum guideline (C criteria) raising fundamental concerns.
>>> FEATURED STOCK ARTICLE : Streak of Gains Lifts Sterling Infrastructure to New Highs - 7/3/2023 |
View all notes |
Set NEW NOTE alert |
Company Profile |
SEC
News |
Chart |
Request a new note
C
A
S
I |
FIX
-
NYSE
Comfort Systems USA
Bldg-A/C and Heating Prds
|
$173.97
|
+0.19
0.11% |
$176.27
|
180,893
80.40% of 50 DAV
50 DAV is 225,000
|
$174.56
-0.34%
|
4/27/2023
|
$148.85
|
PP = $152.23
|
|
MB = $159.84
|
Most Recent Note - 7/28/2023 6:00:19 PM
G - Hit a new all-time high today after testing its 50 DMA line ($159) on the prior session. Reported Jun '23 quarterly earnings +65% on +27% versus the year ago period. Volume and volatility often increase near earnings news.
>>> FEATURED STOCK ARTICLE : Pulled Back From High With Lighter Volume - 7/19/2023 |
View all notes |
Set NEW NOTE alert |
Company Profile |
SEC
News |
Chart |
Request a new note
C
A
S
I |
KOF
-
NYSE
Coca-Cola Femsa ADR
Beverages-Non-Alcoholic
|
$84.32
|
-0.64
-0.75% |
$85.56
|
83,712
51.04% of 50 DAV
50 DAV is 164,000
|
$91.23
-7.57%
|
6/9/2023
|
$88.61
|
PP = $91.33
|
|
MB = $95.90
|
Most Recent Note - 7/25/2023 5:23:18 PM
G - Due to report Jun '23 quarterly results. Volume and volatility often increase near earnings news. Its Relative Strength Rating has slumped to 79 while lingering below its 50 DMA line. A rebound above the 50 DMA line ($85.33) is needed for its outlook to improve. Fundamentals remain strong.
>>> FEATURED STOCK ARTICLE : Slumping Below 50-Day Moving Average and Below Prior Low - 7/6/2023 |
View all notes |
Set NEW NOTE alert |
Company Profile |
SEC
News |
Chart |
Request a new note
C
A
S
I |
CLH
-
NYSE
Clean Harbors
Pollution Control
|
$166.26
|
+1.07
0.65% |
$167.05
|
284,342
74.44% of 50 DAV
50 DAV is 382,000
|
$172.54
-3.64%
|
3/10/2023
|
$136.89
|
PP = $136.74
|
|
MB = $143.58
|
Most Recent Note - 7/25/2023 5:10:35 PM
G - Hovering near its all-time high, extended from any sound base. Its 50 DMA line ($155.89) defines important near-term support to watch on pullbacks. Due to report Jun '23 quarterly results on 8/02/23.
>>> FEATURED STOCK ARTICLE : Negative Reversal at High After +26% Rally in 4 Months - 7/18/2023 |
View all notes |
Set NEW NOTE alert |
Company Profile |
SEC
News |
Chart |
Request a new note
C
A
S
I |
SPSC
-
NASDAQ
SPS Commerce
Comp Sftwr-Spec Enterprs
|
$180.39
|
+5.86
3.36% |
$180.81
|
281,131
136.47% of 50 DAV
50 DAV is 206,000
|
$196.39
-8.15%
|
4/24/2023
|
$150.01
|
PP = $157.56
|
|
MB = $165.44
|
Most Recent Note - 7/31/2023 5:01:47 PM
Y - Posted a 2nd consecutive volume-driven gain and rebounded above its 50 DMA line ($177) and its color code is changed to yellow. Reported Jun '23 quarterly earnings +30% on +19% sales revenues versus the year-ago period.
>>> FEATURED STOCK ARTICLE : Pulled Back Abruptly to 50-Day Moving Average Line - 7/24/2023 |
View all notes |
Set NEW NOTE alert |
Company Profile |
SEC
News |
Chart |
Request a new note
C
A
S
I |
Symbol/Exchange
Company Name
Industry Group |
PRICE |
CHANGE
(%Change) |
Day High |
Volume
(% DAV)
(% 50 day avg vol) |
52 Wk Hi
% From Hi |
Featured
Date |
Price
Featured |
Pivot Featured |
|
Max Buy |
HUBB
-
NYSE
Hubbell
Electrical-Power/Equipmt
|
$312.00
|
+2.02
0.65% |
$312.22
|
407,956
97.36% of 50 DAV
50 DAV is 419,000
|
$340.06
-8.25%
|
4/25/2023
|
$262.85
|
PP = $257.51
|
|
MB = $270.39
|
Most Recent Note - 7/26/2023 5:38:35 PM
G - Abruptly retreated from its all-time high with today's 2nd consecutive volume-driven undercutting its 50 DMA line ($311) raising concerns. Fundamentals remain strong after Jun '23 earnings rose +45%. See the latest FSU analysis for more details and a new annotated graph.
>>> FEATURED STOCK ARTICLE : Pulled Back Undercutting 50 Day Moving Average Line - 7/26/2023 |
View all notes |
Set NEW NOTE alert |
Company Profile |
SEC
News |
Chart |
Request a new note
C
A
S
I |
NVR
-
NYSE
N V R Inc
MATERIALS and CONSTRUCTION - Residential Construction
|
$6,306.44
|
-36.89
-0.58% |
$6,369.72
|
16,150
68.43% of 50 DAV
50 DAV is 23,600
|
$6,474.53
-2.60%
|
4/25/2023
|
$5,882.18
|
PP = $5,978.25
|
|
MB = $6,277.16
|
Most Recent Note - 7/27/2023 7:50:27 PM
G - Pulled back today with above average volume. Reported Jun '23 quarterly earnings -6% on -13% sales revenues raising greater fundamental concerns. Its prior low ($6,009 on 7/06) and 50 DMA line ($6,028) define near-term support watch.
>>> FEATURED STOCK ARTICLE : New High Close for Strong Homebuilder - 6/30/2023 |
View all notes |
Set NEW NOTE alert |
Company Profile |
SEC
News |
Chart |
Request a new note
C
A
S
I |
PHM
-
NYSE
PulteGroup
Bldg-Resident/Comml
|
$84.39
|
-0.43
-0.51% |
$85.49
|
1,848,031
65.51% of 50 DAV
50 DAV is 2,821,000
|
$86.01
-1.88%
|
4/25/2023
|
$65.17
|
PP = $64.01
|
|
MB = $67.21
|
Most Recent Note - 7/27/2023 7:42:23 PM
G - There was a "negative reversal" today after hitting another new high. It is very extended from any sound base. Recently reported earnings +18% for the Jun '23 quarter versus the year-ago period, below the +25% minimum guideline (C criteria) raising concerns. Important support to watch is defined by its 50 DMA line ($74.54). See the latest FSU analysis for more details and a new annotated graph.
>>> FEATURED STOCK ARTICLE : Reversed After Reaching a New All-Time High - 7/27/2023 |
View all notes |
Set NEW NOTE alert |
Company Profile |
SEC
News |
Chart |
Request a new note
C
A
S
I |
AMPH
-
NASDAQ
Amphastar Pharm
Medical-Biomed/Biotech
|
$60.69
|
-0.14
-0.23% |
$61.01
|
240,528
53.57% of 50 DAV
50 DAV is 449,000
|
$63.72
-4.76%
|
5/15/2023
|
$43.56
|
PP = $44.15
|
|
MB = $46.36
|
Most Recent Note - 7/26/2023 5:40:51 PM
G - Hovering near its all-time high. It did not form a sound new base of sufficient length. Its 50 DMA line ($52) defines important support to watch. Fundamentals remain strong.
>>> FEATURED STOCK ARTICLE : 6th Straight Gain for Amphastar - 7/20/2023 |
View all notes |
Set NEW NOTE alert |
Company Profile |
SEC
News |
Chart |
Request a new note
C
A
S
I |
ANET
-
NYSE
"Arista Networks, Inc"
Computer-Networking
|
$155.09
|
+4.00
2.65% |
$155.42
|
5,788,934
171.33% of 50 DAV
50 DAV is 3,378,800
|
$178.36
-13.05%
|
5/30/2023
|
$176.35
|
PP = $171.54
|
|
MB = $180.12
|
Most Recent Note - 7/31/2023 12:15:56 PM
G - Due to report Jun '23 quarterly results. Volume and volatility often increase near earnings news. Violated its 50 DMA line ($160) on the prior session triggering a technical sell signal with heavier volume behind its 3rd consecutive loss. A rebound above the 50 DMA line is needed for its outlook to improve.
>>> FEATURED STOCK ARTICLE : Wedging Higher After Rebounding Above 50-Day Moving Average - 7/12/2023 |
View all notes |
Set NEW NOTE alert |
Company Profile |
SEC
News |
Chart |
Request a new note
C
A
S
I |
Symbol/Exchange
Company Name
Industry Group |
PRICE |
CHANGE
(%Change) |
Day High |
Volume
(% DAV)
(% 50 day avg vol) |
52 Wk Hi
% From Hi |
Featured
Date |
Price
Featured |
Pivot Featured |
|
Max Buy |
PANW
-
NASDAQ
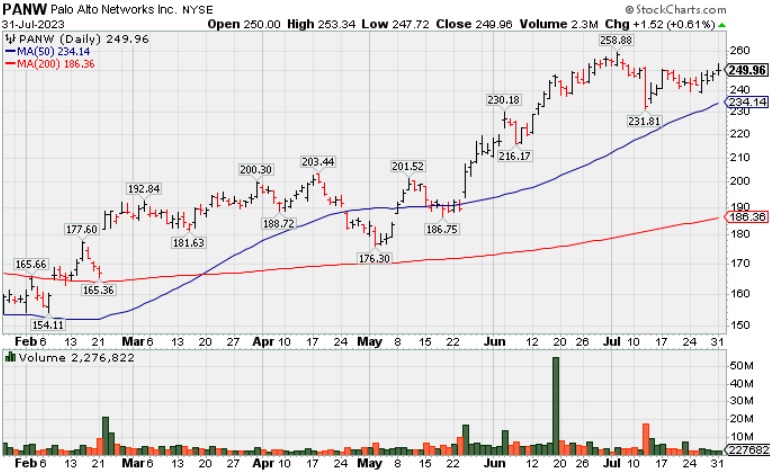
Palo Alto Networks
Computer Sftwr-Security
|
$249.96
|
+1.52
0.61% |
$253.34
|
2,278,381
34.61% of 50 DAV
50 DAV is 6,583,000
|
$258.88
-3.45%
|
6/5/2023
|
$228.35
|
PP = $213.73
|
|
MB = $224.42
|
Most Recent Note - 7/31/2023 4:58:13 PM
G - Posted a 4th consecutive gain today with light volume. Volume totals have been cooling while consolidating above its 50 DMA line ($234) which defines near-term support to watch. Fundamentals remain strong. See the latest FSU analysis for more details and a new annotated graph.
>>> FEATURED STOCK ARTICLE : Volume Cooling While Hovering Near High - 7/31/2023 |
View all notes |
Set NEW NOTE alert |
Company Profile |
SEC
News |
Chart |
Request a new note
C
A
S
I |
LSCC
-
NASDAQ
Lattice Semiconductor
Elec-Semicondctor Fablss
|
$90.94
|
-0.01
-0.01% |
$91.55
|
2,059,093
92.25% of 50 DAV
50 DAV is 2,232,000
|
$98.18
-7.37%
|
6/13/2023
|
$91.73
|
PP = $96.92
|
|
MB = $101.77
|
Most Recent Note - 7/27/2023 7:44:48 PM
Y - Color code is changed to yellow after today's gap up and big volume-driven gain helped it promptly rebound above the 50 DMA line helping its outlook improve, Due to report Jun '23 quarterly results on 7/31/23.
>>> FEATURED STOCK ARTICLE : Perched Near Pivot Point After Best-Ever Close - 7/17/2023 |
View all notes |
Set NEW NOTE alert |
Company Profile |
SEC
News |
Chart |
Request a new note
C
A
S
I |
XPEL
-
NASDAQ
Xpel Inc
Auto/Truck-Tires andamp; Misc
|
$81.23
|
+2.39
3.03% |
$81.35
|
113,707
85.88% of 50 DAV
50 DAV is 132,400
|
$87.46
-7.12%
|
6/28/2023
|
$83.14
|
PP = $87.11
|
|
MB = $91.47
|
Most Recent Note - 7/31/2023 4:25:08 PM
Y - Color code was changed to yellow after rebounding back above its 50 DMA line ($78.68) with 2 consecutive gains. Stalled after recently hitting a new 52-week high. Reported Mar '23 quarterly earnings +46% on +19% sales revenues versus the year-ago period, its 3rd quarterly comparison above the +25% minimum earnings guideline (C criteria), helping it better match the winning models of the fact-based investment system.
>>> FEATURED STOCK ARTICLE : XPEL Returns to Featured Stocks List After Long Consolidation - 6/28/2023 |
View all notes |
Set NEW NOTE alert |
Company Profile |
SEC
News |
Chart |
Request a new note
C
A
S
I |
FTNT
-
NASDAQ
Fortinet
Computer Sftwr-Security
|
$77.72
|
+0.92
1.20% |
$77.75
|
3,541,559
65.31% of 50 DAV
50 DAV is 5,423,000
|
$81.24
-4.33%
|
7/10/2023
|
$78.29
|
PP = $74.45
|
|
MB = $78.17
|
Most Recent Note - 7/31/2023 5:03:18 PM
Y - Volume totals are cooling while perched near its all-time high. Its prior high in the $74 area defines support above its 50 DMA line ($73.14) Fundamentals remain strong.
>>> FEATURED STOCK ARTICLE : Fortinet Powered to New All-Time High - 7/10/2023 |
View all notes |
Set NEW NOTE alert |
Company Profile |
SEC
News |
Chart |
Request a new note
C
A
S
I |
PII
-
NYSE
Polaris
Leisure-Products
|
$135.84
|
+1.03
0.76% |
$136.15
|
1,861,575
320.41% of 50 DAV
50 DAV is 581,000
|
$138.49
-1.91%
|
7/11/2023
|
$126.92
|
PP = $123.97
|
|
MB = $130.17
|
Most Recent Note - 7/31/2023 5:06:08 PM
G - Posted a gain today with above average volume. Reported Jun '23 quarterly earnings +0% versus the year ago period, below the +25% minimum earnings guideline (C criteria). On pullbacks, the prior highs define initial support to watch above its 50 DMA line ($120.73).
>>> FEATURED STOCK ARTICLE : Volume-Driven Breakout for Polaris - 7/11/2023 |
View all notes |
Set NEW NOTE alert |
Company Profile |
SEC
News |
Chart |
Request a new note
C
A
S
I |
Symbol/Exchange
Company Name
Industry Group |
PRICE |
CHANGE
(%Change) |
Day High |
Volume
(% DAV)
(% 50 day avg vol) |
52 Wk Hi
% From Hi |
Featured
Date |
Price
Featured |
Pivot Featured |
|
Max Buy |
ALGM
-
NASDAQ
Allegro MicroSystems
Elec-Semicondctor Fablss
|
$51.61
|
+0.77
1.51% |
$52.26
|
2,263,856
155.81% of 50 DAV
50 DAV is 1,453,000
|
$53.05
-2.71%
|
7/13/2023
|
$49.86
|
PP = $48.82
|
|
MB = $51.26
|
Most Recent Note - 7/28/2023 5:57:55 PM
Y - Posted a 2nd consecutive gain with below average volume. Due to report Jun '23 quarterly earnings news on 8/01/23. Volume and volatility often increase near earnings news. Disciplined investors always limit losses by selling any stock that falls more than -8% from their purchase price.
>>> FEATURED STOCK ARTICLE : Volume Heavy Behind Considerable Breakout Gain - 7/13/2023 |
View all notes |
Set NEW NOTE alert |
Company Profile |
SEC
News |
Chart |
Request a new note
C
A
S
I |
ESQ
-
NASDAQ
Esquire Finl Hldgs
Finance-Commercial Loans
|
$49.95
|
-0.51
-1.01% |
$50.63
|
21,911
73.04% of 50 DAV
50 DAV is 30,000
|
$54.03
-7.56%
|
7/14/2023
|
$45.80
|
PP = $48.23
|
|
MB = $50.64
|
Most Recent Note - 7/27/2023 7:46:46 PM
Y - Color code is changed to yellow after pulling back below its "max buy" level. Found support above its 50 DMA line on the recent pullback.
>>> FEATURED STOCK ARTICLE : Esquire Perched Near Prior Highs - 7/14/2023 |
View all notes |
Set NEW NOTE alert |
Company Profile |
SEC
News |
Chart |
Request a new note
C
A
S
I |
MEDP
-
NASDAQ
Medpace Holdings
Medical-Research Eqp/Svc
|
$253.17
|
-1.64
-0.64% |
$257.25
|
240,171
61.42% of 50 DAV
50 DAV is 391,000
|
$264.19
-4.17%
|
7/25/2023
|
$196.32
|
PP = $241.57
|
|
MB = $253.65
|
Most Recent Note - 7/27/2023 7:53:30 PM
Y - Pulled back with average volume today for a 2nd consecutive loss after hitting a new all-time high. Prior highs in the $241 area define support to watch on pullbacks. Reported earnings increases above the +25% minimum earnings guideline (C criteria) in the past 5 quarterly comparisons through Jun '23.
>>> FEATURED STOCK ARTICLE : Medpace Posted a Solid Volume-Driven Gain for a New High - 7/25/2023 |
View all notes |
Set NEW NOTE alert |
Company Profile |
SEC
News |
Chart |
Request a new note
C
A
S
I |