You are not logged in.
This means you
CAN ONLY VIEW reports that were published prior to Tuesday, April 29, 2025.
You
MUST UPGRADE YOUR MEMBERSHIP if you want to see any current reports.
AFTER MARKET UPDATE - TUESDAY, JUNE 27TH, 2023
Previous After Market Report Next After Market Report >>>
|
|
|
|
DOW |
+212.03 |
33,926.74 |
+0.63% |
|
Volume |
817,482,020 |
-2% |
|
Volume |
5,087,793,400 |
+13% |
|
NASDAQ |
+219.89 |
13,555.67 |
+1.65% |
|
Advancers |
2,065 |
72% |
|
Advancers |
2,634 |
60% |
|
S&P 500 |
+49.59 |
4,378.41 |
+1.15% |
|
Decliners |
800 |
28% |
|
Decliners |
1,774 |
40% |
|
Russell 2000 |
+26.67 |
1,849.93 |
+1.46% |
|
52 Wk Highs |
100 |
|
|
52 Wk Highs |
88 |
|
|
S&P 600 |
+20.53 |
1,193.92 |
+1.75% |
|
52 Wk Lows |
31 |
|
|
52 Wk Lows |
169 |
|
|
 |
Major Averages Rose as Economic Data Eased Concerns
Kenneth J. Gruneisen - Passed the CAN SLIM® Master's Exam
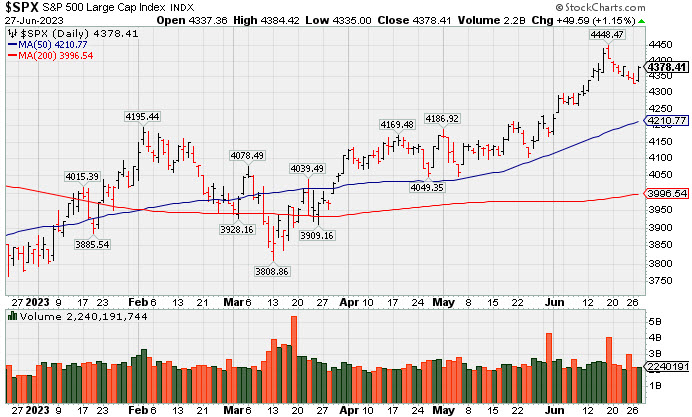
Tuesday was a strong day for the stock market as the major indices all closed near their best levels of the session with gains ranging from 0.6% to 1.7%. Volume totals reported were mixed, lighter on the NYSE and higher on the Nasdaq exchange versus the prior session. Advancers led decliners by a 5-2 margin on the NYSE and by a 3-2 margin on the Nasdaq exchange. There were 66 high-ranked companies from the Leaders List that hit a new 52-week high and were listed on the BreakOuts Page, doubling the total of 33 on the prior session. New 52-week highs outnumbered new 52-week lows on the NYSE, but new lows outnumbered new highs on the Nasdaq exchange. The major indices are in a confirmed uptrend (M criteria). Appropriate new buying efforts may be considered under the fact-based investment system.
PICTURED: The S&P 500 Index is consolidating following a "negative reversal" on 6/16/23 after hitting a new 2023 high.
The upside moves were in response to a slate of stronger-than-expected economic data this morning that helped to ease some concerns about a hard landing for the economy. Namely, the May Durable Goods Orders, May New Home Sales, and June Consumer Confidence reports all went the market's way. As a result, today's trade had a risk-on and pro-cyclical vibe. Gains in their respective mega cap components propelled the information technology (+2.0%) and consumer discretionary (+2.1%) sectors to first place on the leaderboard.
The consumer discretionary sector was also boosted by outperforming homebuilder components in response to the jump in new homes sales in May. The information technology sector, meanwhile, was boosted by outperforming semiconductor components. The SPDR S&P Homebuilder ETF (XHB) rose 2.9%. The PHLX Semiconductor Index rose 3.6%.
|
 Kenneth J. Gruneisen started out as a licensed stockbroker in August 1987, a couple of months prior to the historic stock market crash that took the Dow Jones Industrial Average down -22.6% in a single day. He has published daily fact-based fundamental and technical analysis on high-ranked stocks online for two decades. Through FACTBASEDINVESTING.COM, Kenneth provides educational articles, news, market commentary, and other information regarding proven investment systems that work in good times and bad.
Comments contained in the body of this report are technical opinions only and are not necessarily those of Gruneisen Growth Corp. The material herein has been obtained from sources believed to be reliable and accurate, however, its accuracy and completeness cannot be guaranteed. Our firm, employees, and customers may effect transactions, including transactions contrary to any recommendation herein, or have positions in the securities mentioned herein or options with respect thereto. Any recommendation contained in this report may not be suitable for all investors and it is not to be deemed an offer or solicitation on our part with respect to the purchase or sale of any securities. |
|
 |
Retail, Financial, Semiconductor, and Networking Indexes Rose
Kenneth J. Gruneisen - Passed the CAN SLIM® Master's Exam
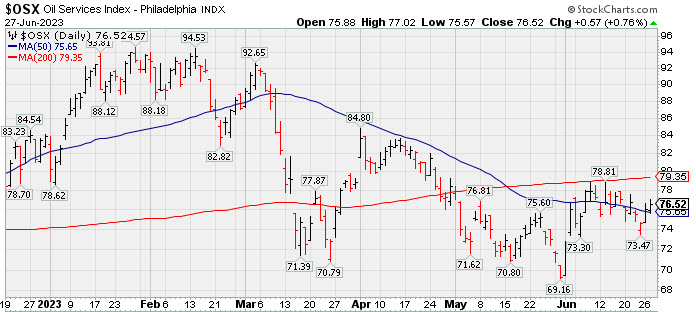
The Retail Index ($RLX +1.53%) outpaced the Bank Index ($BKX +1.07%) and the Broker/Dealer Index ($XBD +0.67%). The tech sector was led by the Semiconductor Index ($SOX +3.60%) and Networking Index ($NWX +2.38%), but the Biotech Index ($BTK -0.78%) slumped again. The Gold & Silver Index ($XAU -0.91%) slumped and the Integrated Oil Index ($XOI -0.12%) ended slightly in the red while the Oil Services Index ($OSX +0.76%) posted a small gain.
PICTURED: The Oil Services Index ($OSX +0.76%) is consolidating near its 50-day moving average (DMA) line after meeting resistance at its 200 DMA line while rebounding from 2023 lows.
| Oil Services |
$OSX |
76.52 |
+0.57 |
+0.76% |
-8.75% |
| Integrated Oil |
$XOI |
1,636.82 |
-1.92 |
-0.12% |
-8.42% |
| Semiconductor |
$SOX |
3,642.41 |
+126.64 |
+3.60% |
+43.85% |
| Networking |
$NWX |
821.14 |
+19.05 |
+2.38% |
+4.83% |
| Broker/Dealer |
$XBD |
464.65 |
+3.07 |
+0.67% |
+3.46% |
| Retail |
$RLX |
3,449.01 |
+52.07 |
+1.53% |
+25.24% |
| Gold & Silver |
$XAU |
118.37 |
-1.09 |
-0.91% |
-2.06% |
| Bank |
$BKX |
78.93 |
+0.84 |
+1.07% |
-21.74% |
| Biotech |
$BTK |
5,181.49 |
-40.75 |
-0.78% |
-1.89% |
|
|
|
 |
Strength Continues for Network Security Leader
Kenneth J. Gruneisen - Passed the CAN SLIM® Master's Exam
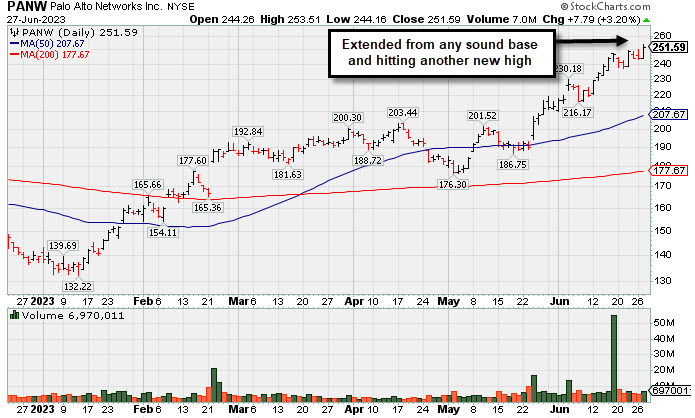
Palo Alto Networks (PANW +$7.79 or +3.20% to $251.59) hit a new all-time high with today's gain backed by +16% above-average volume. It is very extended from the prior high ($213) which defines initial support to watch on pullbacks. Fundamentals remain strong. PANW was highlighted in yellow with new pivot point cited based on its 4/20/22 high plus 10 cents in the 6/05/23 mid-day report (read here). It was shown in greater detail that evening with an annotataed graph under the headline, "Palo Alto Powers to New Highs Again". It has a 98 Earnings Per Share Rating. It has shown bullish action after reporting Apr '23 quarterly earnings +83% on +24% sales revenues versus the year-ago period. Prior quarterly comparisons were above the +25% minimum earnings guideline (C criteria). It had a downturn in FY '20 earnings like many companies during the pandemic but has continued posting strong annual earnings (A criteria) since. PANW's share price was impacted by a 3:1 split on 9/14/22 and it now has a supply (S criteria) of 305.9 million shares outstanding. The number of top-rated funds owning its shares rose from 892 in Jun '17 to 2,538 in Mar '23, a very reassuring sign concerning the I criteria. Its current Up/Down Volume Ratio of 2.1 is an unbiased indication that over the past 50 days it has been under accumulation. It has an A Timeliness Rating and a C Sponsorship Rating.
|
|
|
Color Codes Explained :
Y - Better candidates highlighted by our
staff of experts.
G - Previously featured
in past reports as yellow but may no longer be buyable under the
guidelines.
***Last / Change / Volume data in this table is the closing quote data***
Symbol/Exchange
Company Name
Industry Group |
PRICE |
CHANGE
(%Change) |
Day High |
Volume
(% DAV)
(% 50 day avg vol) |
52 Wk Hi
% From Hi |
Featured
Date |
Price
Featured |
Pivot Featured |
|
Max Buy |
 GPK
-
NYSE
GPK
-
NYSE
Graphic Packaging Hldg
CONSUMER NON-DURABLES - Packaging and Containers
|
$24.22
|
+0.25
1.04% |
$24.57
|
4,517,880
103.63% of 50 DAV
50 DAV is 4,359,700
|
$27.56
-12.12%
|
10/25/2022
|
$22.75
|
PP = $24.17
|
|
MB = $25.38
|
Most Recent Note - 6/22/2023 3:59:03 PM
G - Undercut the prior low (23.75) today while slumping near its 200 DMA line ($23.33). Violation of its 50 DMA line ($25.24) raised concerns following a noted "negative reversal" on 6/13/23. A rebound above the 50 DMA line is needed to help its outlook improve. It was repeatedly noted - "It did not form a sound new base of sufficient length but quickly recovered after testing its 4/27/23 low. Reported Mar '23 quarterly earnings +60% on +9% sales revenues versus the year-ago period."
>>> FEATURED STOCK ARTICLE : Graphic Packaging Hits New High With 6th Consecutive Gain - 6/8/2023 |
View all notes |
Set NEW NOTE alert |
Company Profile |
SEC
News |
Chart |
Request a new note
C
A
S
I |
STRL
-
NASDAQ
Sterling Infrastructure
Bldg-Heavy Construction
|
$52.92
|
+0.76
1.46% |
$53.47
|
211,748
75.36% of 50 DAV
50 DAV is 281,000
|
$54.44
-2.79%
|
12/14/2022
|
$32.41
|
PP = $33.72
|
|
MB = $35.41
|
Most Recent Note - 6/22/2023 5:27:54 PM
G - Posted a volume-driven gain today. It has been holding its ground stubbornly near its all-time high, extended from any sound base. Mar '23 quarterly earnings were below the +25% minimum guideline (C criteria) raising fundamental concerns.
>>> FEATURED STOCK ARTICLE : Impressive Streak of Gains for New Highs - 6/7/2023 |
View all notes |
Set NEW NOTE alert |
Company Profile |
SEC
News |
Chart |
Request a new note
C
A
S
I |
FIX
-
NYSE
Comfort Systems USA
Bldg-A/C and Heating Prds
|
$162.00
|
+1.00
0.62% |
$163.07
|
165,208
59.43% of 50 DAV
50 DAV is 278,000
|
$165.05
-1.85%
|
4/27/2023
|
$148.85
|
PP = $152.23
|
|
MB = $159.84
|
 Most Recent Note - 6/27/2023 5:37:17 PM
G - Volume totals have been cooling while hovering near its all-time high. Extended from the prior base and no resistance remains due to overhead supply. Prior highs in the $152-156 area define initial support to watch above its 50 DMA line ($150.54).
>>> FEATURED STOCK ARTICLE : "Negative Reversal" Following Recent Volume-Driven Gains - 6/16/2023 |
View all notes |
Set NEW NOTE alert |
Company Profile |
SEC
News |
Chart |
Request a new note
C
A
S
I |
KOF
-
NYSE
Coca-Cola Femsa ADR
Beverages-Non-Alcoholic
|
$84.51
|
-1.19
-1.39% |
$86.27
|
312,429
180.59% of 50 DAV
50 DAV is 173,000
|
$91.23
-7.37%
|
6/9/2023
|
$88.61
|
PP = $91.33
|
|
MB = $95.90
|
Most Recent Note - 6/27/2023 12:30:58 PM
G - Further undercutting its 50 DMA line ($86.36) with today's 4th consecutive loss raising greater concerns. A prompt rebound above the 50 DMA line is needed to help its outlook improve. The prior low ($81.63 on 5/31/23) defines the next important near-term support to watch. Subsequent gains above the pivot point backed by at least +40% above average volume may trigger a technical buy signal. Fundamentals remain strong.
>>> FEATURED STOCK ARTICLE : Coca-Cola Femsa Posts 7th Consecutive Gain - 6/9/2023 |
View all notes |
Set NEW NOTE alert |
Company Profile |
SEC
News |
Chart |
Request a new note
C
A
S
I |
CLH
-
NYSE
Clean Harbors
Pollution Control
|
$158.17
|
+2.06
1.32% |
$159.56
|
239,921
61.20% of 50 DAV
50 DAV is 392,000
|
$160.50
-1.45%
|
3/10/2023
|
$136.89
|
PP = $136.74
|
|
MB = $143.58
|
Most Recent Note - 6/27/2023 5:36:07 PM
G - Volume totals have cooled while hovering near its all-time high, extended from any sound base. Its 50 DMA line ($146.56) and prior high define important near-term support to watch on pullbacks. Fundamentals remain strong.
>>> FEATURED STOCK ARTICLE : Extended From Any Sound Base and Hovering Near High - 6/15/2023 |
View all notes |
Set NEW NOTE alert |
Company Profile |
SEC
News |
Chart |
Request a new note
C
A
S
I |
Symbol/Exchange
Company Name
Industry Group |
PRICE |
CHANGE
(%Change) |
Day High |
Volume
(% DAV)
(% 50 day avg vol) |
52 Wk Hi
% From Hi |
Featured
Date |
Price
Featured |
Pivot Featured |
|
Max Buy |
SPSC
-
NASDAQ
SPS Commerce
Comp Sftwr-Spec Enterprs
|
$183.85
|
+2.62
1.45% |
$185.20
|
143,553
82.03% of 50 DAV
50 DAV is 175,000
|
$186.39
-1.36%
|
4/24/2023
|
$150.01
|
PP = $157.56
|
|
MB = $165.44
|
Most Recent Note - 6/27/2023 5:41:04 PM
G - Volume totals have been cooling while stubbornly hovering near its 52-week high, extended from the previously noted base. Reported Mar '23 quarterly earnings +22% on +20% versus the year-ago period, below the +25% minimum earnings guideline (C criteria) raising some fundamental concerns.
>>> FEATURED STOCK ARTICLE : Perched Near High Following Noted Volume-Driven Gains - 6/21/2023 |
View all notes |
Set NEW NOTE alert |
Company Profile |
SEC
News |
Chart |
Request a new note
C
A
S
I |
HUBB
-
NYSE
Hubbell
Electrical-Power/Equipmt
|
$323.32
|
+3.87
1.21% |
$325.32
|
363,161
86.88% of 50 DAV
50 DAV is 418,000
|
$326.62
-1.01%
|
4/25/2023
|
$262.85
|
PP = $257.51
|
|
MB = $270.39
|
Most Recent Note - 6/22/2023 5:26:38 PM
G - Very extended from the prior base. Prior highs in the $263 area define initial support to watch on pullbacks. Fundamentals remain strong. See the latest FSU analysis for more details and a new annotated graph.
>>> FEATURED STOCK ARTICLE : Hubbell on Track for 11th Weekly Gain - 6/22/2023 |
View all notes |
Set NEW NOTE alert |
Company Profile |
SEC
News |
Chart |
Request a new note
C
A
S
I |
NVR
-
NYSE
NVR
Bldg-Resident/Comml
|
$6,330.20
|
+181.12
2.95% |
$6,357.53
|
25,996
103.98% of 50 DAV
50 DAV is 25,000
|
$6,253.47
1.23%
|
4/25/2023
|
$5,882.18
|
PP = $5,978.25
|
|
MB = $6,277.16
|
Most Recent Note - 6/26/2023 6:32:01 PM
G - There was a "negative reversal" today after hitting another new all-time high. Its 50 DMA line ($5,824) defines near-term support watch on pullbacks. Reported Mar '23 quarterly earnings -14% on -3% sales revenues versus the year-ago period, below the +25% minimum earnings guideline (C criteria) raising fundamental concerns, and its color code was changed to green.
>>> FEATURED STOCK ARTICLE : Rebounded Above 50 Day Average With Light Volume Gains - 6/6/2023 |
View all notes |
Set NEW NOTE alert |
Company Profile |
SEC
News |
Chart |
Request a new note
C
A
S
I |
PHM
-
NYSE
PulteGroup
Bldg-Resident/Comml
|
$78.67
|
+2.64
3.47% |
$78.80
|
2,250,745
73.53% of 50 DAV
50 DAV is 3,061,000
|
$77.48
1.54%
|
4/25/2023
|
$65.17
|
PP = $64.01
|
|
MB = $67.21
|
Most Recent Note - 6/26/2023 6:27:37 PM
G - There was a "negative reversal" today after hitting yet another new high . Very extended from any sound base. Reported earnings +28% for the Mar '23 quarter versus the year-ago period. Important support to watch is defined by its 50 DMA line ($68.40). See the latest FSU analysis for more details and a new annotated graph.
>>> FEATURED STOCK ARTICLE : Negative Reversal After Hitting Another New High - 6/26/2023 |
View all notes |
Set NEW NOTE alert |
Company Profile |
SEC
News |
Chart |
Request a new note
C
A
S
I |
COKE
-
NASDAQ
Coca-Cola Consolidated
Beverages-Non-Alcoholic
|
$644.77
|
+5.20
0.81% |
$648.41
|
49,209
123.02% of 50 DAV
50 DAV is 40,000
|
$694.20
-7.12%
|
5/4/2023
|
$646.66
|
PP = $656.21
|
|
MB = $689.02
|
Most Recent Note - 6/26/2023 6:35:42 PM
Y - Pulled back today with average volume. Important near-term support is its 50 DMA line ($630). Fundamentals remain strong.
>>> FEATURED STOCK ARTICLE : Fell Below Pivot Point With Recent Volume-Driven Losses - 6/14/2023 |
View all notes |
Set NEW NOTE alert |
Company Profile |
SEC
News |
Chart |
Request a new note
C
A
S
I |
Symbol/Exchange
Company Name
Industry Group |
PRICE |
CHANGE
(%Change) |
Day High |
Volume
(% DAV)
(% 50 day avg vol) |
52 Wk Hi
% From Hi |
Featured
Date |
Price
Featured |
Pivot Featured |
|
Max Buy |
AMPH
-
NASDAQ
Amphastar Pharm
Medical-Biomed/Biotech
|
$56.14
|
+0.84
1.52% |
$56.28
|
292,326
62.46% of 50 DAV
50 DAV is 468,000
|
$58.70
-4.36%
|
5/15/2023
|
$43.56
|
PP = $44.15
|
|
MB = $46.36
|
Most Recent Note - 6/26/2023 6:34:06 PM
G - Pulled back from its all-time high with today's 2nd consecutive volume-driven loss. Very extended from any sound base. Prior highs in the $44 area define important support to watch coinciding with its 50 DMA line. Fundamentals remain strong.
>>> FEATURED STOCK ARTICLE : Hit Another New High With 4th Consecutive Volume-Driven Gain - 6/20/2023 |
View all notes |
Set NEW NOTE alert |
Company Profile |
SEC
News |
Chart |
Request a new note
C
A
S
I |
ANET
-
NYSE
Arista Networks
Computer-Networking
|
$156.13
|
+5.31
3.52% |
$157.29
|
3,127,531
86.11% of 50 DAV
50 DAV is 3,632,000
|
$178.36
-12.46%
|
5/30/2023
|
$176.35
|
PP = $171.54
|
|
MB = $180.12
|
Most Recent Note - 6/27/2023 5:32:56 PM
G - Rebounded above its 50 DMA line ($152.81) with below-average volume behind today's 2nd consecutive gain helping its outlook improve. Faces near-term resistance due to overhead supply up to the $178 level. Fundamentals remain strong.
>>> FEATURED STOCK ARTICLE : Rebounding Near Recent High With 3 Consecutive Gains - 6/12/2023 |
View all notes |
Set NEW NOTE alert |
Company Profile |
SEC
News |
Chart |
Request a new note
C
A
S
I |
PANW
-
NASDAQ
Palo Alto Networks
Computer Sftwr-Security
|
$251.59
|
+7.79
3.20% |
$253.51
|
6,992,187
115.98% of 50 DAV
50 DAV is 6,029,000
|
$250.55
0.42%
|
6/5/2023
|
$228.35
|
PP = $213.73
|
|
MB = $224.42
|
Most Recent Note - 6/27/2023 5:29:16 PM
G - Hit another new all-time high with today's gain. Very extended from the prior high ($213) which defines initial support to watch on pullbacks. Fundamentals remain strong. See the latest FSU analysis for more details and a new annotated graph.
>>> FEATURED STOCK ARTICLE : Strength Continues for Network Security Leader - 6/27/2023 |
View all notes |
Set NEW NOTE alert |
Company Profile |
SEC
News |
Chart |
Request a new note
C
A
S
I |
LSCC
-
NASDAQ
Lattice Semiconductor
Elec-Semicondctor Fablss
|
$90.99
|
+4.71
5.46% |
$91.07
|
1,432,114
57.68% of 50 DAV
50 DAV is 2,483,000
|
$96.82
-6.02%
|
6/13/2023
|
$91.73
|
PP = $96.92
|
|
MB = $101.77
|
Most Recent Note - 6/27/2023 5:43:34 PM
Y - Posted a solid gain today backed by light volume after recently testing its 50 DMA line ($84.54). More damaging losses would raise concerns. Subsequent gains above the pivot point backed by at least +40% above average volume may trigger a technical buy signal. Reported Mar '23 quarterly earnings +38% on +22% sales revenues versus the year-ago period, its 9th consecutive strong quarterly comparison above the +25% minimum earnings guideline (C criteria). Annual earnings history (A criteria) has been strong.
>>> FEATURED STOCK ARTICLE : Lattice Posts Volume-Driven Gains Approaching Prior High - 6/13/2023 |
View all notes |
Set NEW NOTE alert |
Company Profile |
SEC
News |
Chart |
Request a new note
C
A
S
I |
|
|
|
THESE ARE NOT BUY RECOMMENDATIONS!
Comments contained in the body of this report are technical
opinions only. The material herein has been obtained
from sources believed to be reliable and accurate, however,
its accuracy and completeness cannot be guaranteed.
This site is not an investment advisor, hence it does
not endorse or recommend any securities or other investments.
Any recommendation contained in this report may not
be suitable for all investors and it is not to be deemed
an offer or solicitation on our part with respect to
the purchase or sale of any securities. All trademarks,
service marks and trade names appearing in this report
are the property of their respective owners, and are
likewise used for identification purposes only.
This report is a service available
only to active Paid Premium Members.
You may opt-out of receiving report notifications
at any time. Questions or comments may be submitted
by writing to Premium Membership Services 665 S.E. 10 Street, Suite 201 Deerfield Beach, FL 33441-5634 or by calling 1-800-965-8307
or 954-785-1121.
|
|
|