***Last / Change / Volume data in this table is the closing quote data***
Symbol/Exchange
Company Name
Industry Group |
PRICE |
CHANGE
(%Change) |
Day High |
Volume
(% DAV)
(% 50 day avg vol) |
52 Wk Hi
% From Hi |
Featured
Date |
Price
Featured |
Pivot Featured |
|
Max Buy |
PFBC
-
NASDAQ
Preferred Bank Los Angls
BANKING - Regional - Pacific Banks
|
$63.80
|
+0.05
0.08% |
$64.39
|
52,461
60.79% of 50 DAV
50 DAV is 86,300
|
$67.65
-5.69%
|
4/10/2018
|
$64.56
|
PP = $67.75
|
|
MB = $71.14
|
Most Recent Note - 5/8/2018 5:34:24 PM
G - Its Relative Strength rating has slumped below the 80+ minimum guideline to 73 while failing to rebound after slumping below its 50 DMA line and also briefly undercutting the prior low. A rebound above the 50 DMA line ($64.79) is needed for its outlook to improve.
>>> FEATURED STOCK ARTICLE : Bank Stock Hovering Within Striking Distance of Prior High - 4/10/2018 |
View all notes |
Set NEW NOTE alert |
Company Profile |
SEC
News |
Chart |
Request a new note
C
A
S
I |
SIVB
-
NASDAQ
S V B Financial Group
BANKING - Regional - Pacific Banks
|
$317.12
|
+4.39
1.40% |
$318.71
|
387,558
47.85% of 50 DAV
50 DAV is 810,000
|
$313.93
1.02%
|
3/12/2018
|
$267.79
|
PP = $263.19
|
|
MB = $276.35
|
Most Recent Note - 5/8/2018 5:23:19 PM
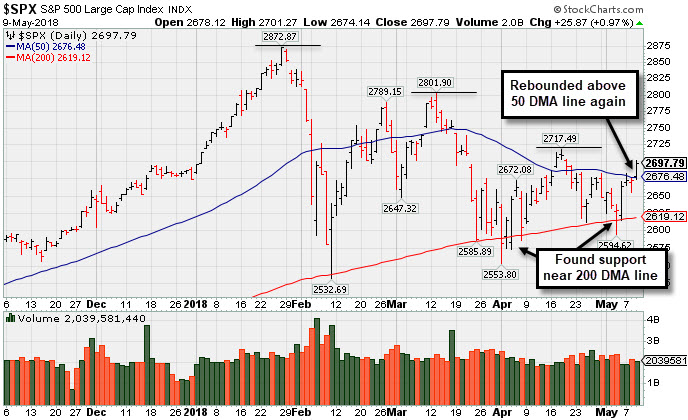
G - Stubbornly holding its ground and quietly edging higher after a big "breakaway gap" for a new high on 4/27/18. Bullish action came after it reported financial results for the quarter ended March 31, 2018 and earnings rose +90% on +34% sales revenues versus the year ago period.
>>> FEATURED STOCK ARTICLE : Rebounded Above its 50-Day Moving Average - 4/12/2018 |
View all notes |
Set NEW NOTE alert |
Company Profile |
SEC
News |
Chart |
Request a new note
C
A
S
I |
EPAM
-
NYSE
Epam Systems Inc
COMPUTER SOFTWARE and SERVICES - Information Technology Service
|
$124.32
|
+7.42
6.35% |
$125.00
|
632,250
222.62% of 50 DAV
50 DAV is 284,000
|
$125.88
-1.24%
|
5/9/2018
|
$120.34
|
PP = $125.98
|
|
MB = $132.28
|
 Most Recent Note - 5/9/2018 5:34:15 PM
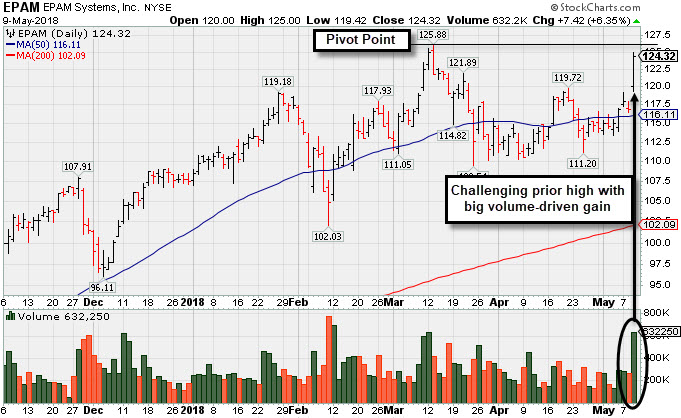
Y - Finished strong after highlighted in yellow with pivot point cited based on its 3/13/18 high plus 10 cents in the earlier mid-day report. Challenged its all-time high with a gap up and big volume-driven gain. Subsequent gains above the pivot point backed by at least +40% above average volume are needed to trigger a proper technical buy signal. Reported Mar '18 earnings +29% on +31% sales revenues, above the +25% minimum earnings guideline (C criteria). Sequential quarterly comparisons show strong earnings with an encouraging acceleration in sales revenues growth. Annual earnings history (A criteria) remained strong after it was dropped from Featured Stocks list on 8/11/15. See the latest FSU analysis for more details and a new annotated graph.
>>> FEATURED STOCK ARTICLE : Volume-Driven Gain Challenged Prior High Following Earnings - 5/9/2018 |
View all notes |
Set NEW NOTE alert |
Company Profile |
SEC
News |
Chart |
Request a new note
C
A
S
I |
MA
-
NYSE
Mastercard Inc Cl A
DIVERSIFIED SERVICES - Business/Management Services
|
$190.63
|
+0.10
0.05% |
$191.68
|
2,930,375
71.88% of 50 DAV
50 DAV is 4,077,000
|
$190.66
-0.02%
|
5/2/2018
|
$184.96
|
PP = $183.83
|
|
MB = $193.02
|
Most Recent Note - 5/9/2018 3:41:06 PM
Y - Holding its ground stubbornly and rising after breaking out on 5/02/18 from a riskier "late stage" base. Reported earnings +49% on +31% sales revenues for the Mar '18 quarter. Helping it better match the winning models of the fact-based investment system, sequential quarterly comparisons have shown encouraging sales revenues acceleration and earnings increases above the +25% minimum earnings guideline (C criteria). Annual earnings growth has been good.
>>> FEATURED STOCK ARTICLE : Gap Up and Volume Driven Gain for New High After Earnings - 5/2/2018 |
View all notes |
Set NEW NOTE alert |
Company Profile |
SEC
News |
Chart |
Request a new note
C
A
S
I |
V
-
NYSE
Visa Inc Cl A
DIVERSIFIED SERVICES - Business/Management Services
|
$130.84
|
+0.94
0.72% |
$131.00
|
6,110,978
75.96% of 50 DAV
50 DAV is 8,045,000
|
$129.97
0.67%
|
4/26/2018
|
$126.68
|
PP = $126.98
|
|
MB = $133.33
|
Most Recent Note - 5/9/2018 3:47:33 PM
Y - Inching to new highs with today's 5th consecutive small gain backed by below average volume. Held its ground stubbornly after a technical breakout noted in the 4/26/18 mid-day report. Reported earnings +29% on +13% sales revenues for the Mar '18 quarter, and 3 of the past 4 quarterly comparisons were above the +25% minimum earnings guideline (C criteria).
>>> FEATURED STOCK ARTICLE : Volume-Driven Gain For New High Triggered Technical Buy Signal - 4/26/2018 |
View all notes |
Set NEW NOTE alert |
Company Profile |
SEC
News |
Chart |
Request a new note
C
A
S
I |
Symbol/Exchange
Company Name
Industry Group |
PRICE |
CHANGE
(%Change) |
Day High |
Volume
(% DAV)
(% 50 day avg vol) |
52 Wk Hi
% From Hi |
Featured
Date |
Price
Featured |
Pivot Featured |
|
Max Buy |
TPL
-
NYSE
Texas Pacific Land Trust
FINANCIAL SERVICES - Diversified Investments
|
$646.90
|
+3.02
0.47% |
$657.54
|
17,310
108.19% of 50 DAV
50 DAV is 16,000
|
$677.15
-4.47%
|
4/13/2018
|
$547.85
|
PP = $552.10
|
|
MB = $579.71
|
Most Recent Note - 5/8/2018 1:08:18 PM
G - Pulling back today from a new all-time high after a streak of 9 consecutive gains marked by heavy volume while getting very extended from the prior base. Reported earnings +130% on +97% sales revenues for the Mar '18 quarter and gapped up on 5/01/18 for a considerable volume-driven gain, rallying above the pivot point cited based on its 2/28/18 high plus 10 cents. Prior highs in the $569-552 area define initial support to watch above its 50 DMA line ($537).
>>> FEATURED STOCK ARTICLE : Perched Near Prior High After Showing Resilience - 4/20/2018 |
View all notes |
Set NEW NOTE alert |
Company Profile |
SEC
News |
Chart |
Request a new note
C
A
S
I |
STMP
-
NASDAQ
Stamps.com Inc
INTERNET - Internet Software and Services
|
$246.35
|
+5.45
2.26% |
$248.15
|
337,323
102.84% of 50 DAV
50 DAV is 328,000
|
$244.15
0.90%
|
5/4/2018
|
$234.15
|
PP = $233.23
|
|
MB = $244.89
|
Most Recent Note - 5/9/2018 3:55:22 PM
G - Color code is changed to green after quietly rising above its "max buy" level hitting another new all-time high today. Prior highs in the $233 area define initial support above its 50 DMA line.
>>> FEATURED STOCK ARTICLE : Volume-Driven Gain For New High - 5/4/2018 |
View all notes |
Set NEW NOTE alert |
Company Profile |
SEC
News |
Chart |
Request a new note
C
A
S
I |
DPZ
-
NYSE
Dominos Pizza Inc
WHOLESALE - Food Wholesale
|
$249.91
|
-0.50
-0.20% |
$250.36
|
543,137
79.29% of 50 DAV
50 DAV is 685,000
|
$255.00
-2.00%
|
2/20/2018
|
$224.86
|
PP = $222.01
|
|
MB = $233.11
|
Most Recent Note - 5/7/2018 6:04:40 PM
G - Consolidating above prior highs following a big 4/26/18 gap up for a new all-time high. Bullish action came after it reported earnings +59% on +26% sales revenues for the Mar '18 quarter, continuing its strong earnings track record. Its 50 DMA line ($232) and recent lows define near-term support to watch on pullbacks.
>>> FEATURED STOCK ARTICLE : Earnings News Due From Pizza Firm - 4/23/2018 |
View all notes |
Set NEW NOTE alert |
Company Profile |
SEC
News |
Chart |
Request a new note
C
A
S
I |
FIVE
-
NASDAQ
Five Below Inc
Retail-DiscountandVariety
|
$71.06
|
-0.26
-0.36% |
$71.56
|
557,705
37.61% of 50 DAV
50 DAV is 1,483,000
|
$78.28
-9.22%
|
3/9/2018
|
$68.58
|
PP = $73.65
|
|
MB = $77.33
|
Most Recent Note - 5/7/2018 6:06:41 PM
Y - Slumped into the prior base recently raising concerns. Found support near its 50 DMA line ($71.14). Damaging losses may trigger a more worrisome technical sell signal. See the latest FSU analysis for more details and a new annotated graph.
>>> FEATURED STOCK ARTICLE : Trading Near 50-Day Average After Falling Into Prior Base - 5/7/2018 |
View all notes |
Set NEW NOTE alert |
Company Profile |
SEC
News |
Chart |
Request a new note
C
A
S
I |
NOW
-
NYSE
Servicenow Inc
Computer Sftwr-Enterprse
|
$180.04
|
+4.01
2.28% |
$180.98
|
2,151,633
105.47% of 50 DAV
50 DAV is 2,040,000
|
$176.89
1.78%
|
5/8/2018
|
$174.63
|
PP = $176.66
|
|
MB = $185.49
|
Most Recent Note - 5/8/2018 5:16:37 PM
Y - Finished flat after highlighted in yellow with pivot point cited based on its 3/14/18 high plus 10 cents. Gains backed by at least +40% above average volume while rising above the pivot point may trigger a technical buy signal. Rebounded above its 50 DMA line recently, and touched a new all-time high with a quiet gain on the prior session. Reported earnings +81% on +37% sales revenues for the Mar '18 quarter, and prior quarterly comparisons were above the +25% minimum earnings guideline (C criteria). See the latest FSU analysis for more details and a new annotated graph.
>>> FEATURED STOCK ARTICLE : High-Ranked Software - Enterprise Firm is Near Pivot Point - 5/8/2018 |
View all notes |
Set NEW NOTE alert |
Company Profile |
SEC
News |
Chart |
Request a new note
C
A
S
I |
Symbol/Exchange
Company Name
Industry Group |
PRICE |
CHANGE
(%Change) |
Day High |
Volume
(% DAV)
(% 50 day avg vol) |
52 Wk Hi
% From Hi |
Featured
Date |
Price
Featured |
Pivot Featured |
|
Max Buy |
NVEE
-
NASDAQ
N V 5 Global Inc
Comml Svcs-Consulting
|
$59.55
|
-1.95
-3.17% |
$61.45
|
84,804
91.19% of 50 DAV
50 DAV is 93,000
|
$71.90
-17.18%
|
4/9/2018
|
$58.35
|
PP = $59.05
|
|
MB = $62.00
|
Most Recent Note - 5/9/2018 3:49:45 PM
Y - Encountered distributional pressure recently, pulling back near prior highs defining initial support in the $58-59 area. Reported earnings +51% on +48% sales revenues for the Mar '18 quarter, continuing its strong earnings track record.
>>> FEATURED STOCK ARTICLE : Perched Near High After 3 Strong Quarterly Comparisons - 4/9/2018 |
View all notes |
Set NEW NOTE alert |
Company Profile |
SEC
News |
Chart |
Request a new note
C
A
S
I |
QLYS
-
NASDAQ
Qualys Inc
Computer Sftwr-Security
|
$77.50
|
-0.25
-0.32% |
$78.35
|
243,264
72.40% of 50 DAV
50 DAV is 336,000
|
$85.00
-8.82%
|
4/17/2018
|
$82.85
|
PP = $79.50
|
|
MB = $83.48
|
Most Recent Note - 5/8/2018 5:21:54 PM
Y - Rebounded above its 50 DMA line ($76.61) and its color code is changed to yellow. Recently reported earnings +80% on +22% sales revenues for the Mar '18 quarter, continuing its strong earnings track record.
>>> FEATURED STOCK ARTICLE : Quickly Rallied More Than 5% Above Prior High - 4/18/2018 |
View all notes |
Set NEW NOTE alert |
Company Profile |
SEC
News |
Chart |
Request a new note
C
A
S
I |
SPLK
-
NASDAQ
Splunk Inc
Computer Sftwr-Database
|
$114.84
|
+1.70
1.50% |
$116.43
|
2,153,912
108.62% of 50 DAV
50 DAV is 1,983,000
|
$113.99
0.75%
|
5/8/2018
|
$113.14
|
PP = $112.76
|
|
MB = $118.40
|
Most Recent Note - 5/8/2018 5:27:34 PM
Y - Touched a new high with below average volume behind today's 4th consecutive gain. Color code is changed to yellow with new pivot point cited based on its 3/21/18 high plus 10 cents. Gains above a stock's pivot point must have at least +40% above average volume to trigger a proper technical buy signal. Found prompt support near its 50 DMA line ($103) during its ongoing ascent.
>>> FEATURED STOCK ARTICLE : Found Support Near 50-Day Average on Pullbacks - 4/19/2018 |
View all notes |
Set NEW NOTE alert |
Company Profile |
SEC
News |
Chart |
Request a new note
C
A
S
I |
SUPN
-
NASDAQ
Supernus Pharmaceuticals
Medical-Biomed/Biotech
|
$47.95
|
+3.30
7.39% |
$50.30
|
1,418,274
213.27% of 50 DAV
50 DAV is 665,000
|
$50.05
-4.19%
|
4/24/2018
|
$47.73
|
PP = $50.15
|
|
MB = $52.66
|
Most Recent Note - 5/9/2018 1:34:28 PM
Y - Reported earnings +158% on +57% sales revenues for the Mar '18 quarter, continuing its strong earnings track record. Color code is changed to yellow after gapping up today, finding prompt support near its 50 DMA line ($45.10). It is perched within striking distance of its all-time high. Subsequent gains above the pivot point backed by at least +40% above average volume are needed to trigger a technical buy signal.
>>> FEATURED STOCK ARTICLE : Pharmaceutical Firm Perched Near Record High - 4/24/2018 |
View all notes |
Set NEW NOTE alert |
Company Profile |
SEC
News |
Chart |
Request a new note
C
A
S
I |
PAYC
-
NYSE
Paycom Software Inc
COMPUTER SOFTWARE and SERVICES - Application Software
|
$109.00
|
+0.03
0.03% |
$109.58
|
476,625
66.85% of 50 DAV
50 DAV is 713,000
|
$118.45
-7.98%
|
2/15/2018
|
$95.01
|
PP = $93.61
|
|
MB = $98.29
|
Most Recent Note - 5/9/2018 3:43:01 PM
G - Halted its slide and it has been consolidating near its 50 DMA line ($109.34). Reported earnings +56% on +29% sales revenues for the Mar '18 quarter. Recent lows in the $101 area define important support to watch where further deterioration would raise concerns.
>>> FEATURED STOCK ARTICLE : Violation of 50-Day Average Triggered Technical Sell Signal - 5/3/2018 |
View all notes |
Set NEW NOTE alert |
Company Profile |
SEC
News |
Chart |
Request a new note
C
A
S
I |
Symbol/Exchange
Company Name
Industry Group |
PRICE |
CHANGE
(%Change) |
Day High |
Volume
(% DAV)
(% 50 day avg vol) |
52 Wk Hi
% From Hi |
Featured
Date |
Price
Featured |
Pivot Featured |
|
Max Buy |
GRUB
-
NYSE
Grubhub Inc
COMPUTER SOFTWARE and SERVICES - Technical and System Software
|
$103.45
|
+1.00
0.98% |
$104.31
|
1,037,641
65.55% of 50 DAV
50 DAV is 1,583,000
|
$112.41
-7.97%
|
6/21/2017
|
$47.33
|
PP = $46.94
|
|
MB = $49.29
|
Most Recent Note - 5/8/2018 5:31:04 PM
G - Consolidating near and quietly closing above its 50 DMA line ($101.96) today. Faces resistance due to overhead supply up to the $112 level. Recently reported earnings +79% on +49% sales revenues for the Mar '18 quarter.
>>> FEATURED STOCK ARTICLE : Consolidating Near 50 Day Average With Earnings News Due - 4/30/2018 |
View all notes |
Set NEW NOTE alert |
Company Profile |
SEC
News |
Chart |
Request a new note
C
A
S
I |
HQY
-
NASDAQ
Healthequity Inc
COMPUTER SOFTWARE and SERVICES - Healthcare Information Service
|
$70.46
|
+0.54
0.77% |
$70.89
|
352,856
55.48% of 50 DAV
50 DAV is 636,000
|
$70.28
0.26%
|
5/2/2018
|
$66.31
|
PP = $68.85
|
|
MB = $72.29
|
Most Recent Note - 5/9/2018 3:39:13 PM
Y - Volume totals have been below average while recently wedging into new all-time high territory. Color code was changed to yellow with new pivot point cited based on its 3/22/18 high plus 10 cents. Gains above a stock's pivot point must have at least +40% above average volume to trigger a new (or add-on) technical buy signal. Its 50 DMA line ($63.10) defines near term support above the recent low ($59.50 on 4/03/18).
>>> FEATURED STOCK ARTICLE : Perched Near All-Time High Building a Short New Base - 4/25/2018 |
View all notes |
Set NEW NOTE alert |
Company Profile |
SEC
News |
Chart |
Request a new note
C
A
S
I |
LOB
-
NASDAQ
Live Oak Bancshares Inc
Banks-Southeast
|
$28.95
|
-0.15
-0.52% |
$29.30
|
73,715
55.01% of 50 DAV
50 DAV is 134,000
|
$30.05
-3.66%
|
3/16/2018
|
$28.63
|
PP = $28.30
|
|
MB = $29.72
|
Most Recent Note - 5/7/2018 6:12:27 PM
Y - Consolidating above its 50 DMA line ($28.15) and prior lows where more damaging losses would raise greater concerns. Recently reported earnings +63% on +42% for the Mar '18 quarter.
>>> FEATURED STOCK ARTICLE : Tested Support at 50-Day Moving Average After Breakout - 4/16/2018 |
View all notes |
Set NEW NOTE alert |
Company Profile |
SEC
News |
Chart |
Request a new note
C
A
S
I |
PYPL
-
NASDAQ
Paypal Holdings Inc
Finance-CrdtCard/PmtPr
|
$77.01
|
+1.29
1.70% |
$77.05
|
6,180,909
72.19% of 50 DAV
50 DAV is 8,562,000
|
$86.32
-10.79%
|
2/1/2018
|
$80.35
|
PP = $79.49
|
|
MB = $83.46
|
Most Recent Note - 5/9/2018 3:45:12 PM
G - Posting a 5th consecutive gain after it found prompt support near its 200 DMA line and prior lows in the $71-72 area. More damaging losses would raise serious concerns. A rebound above the 50 DMA line ($77.52) is needed for its outlook to improve. Recently reported earnings +30% on +24% sales revenues for the Mar '18 quarter.
>>> FEATURED STOCK ARTICLE : Slumping Near Important Near-Term Support - 4/27/2018 |
View all notes |
Set NEW NOTE alert |
Company Profile |
SEC
News |
Chart |
Request a new note
C
A
S
I |
OLLI
-
NASDAQ
Ollie's Bargain Outlet
Retail-DiscountandVariety
|
$63.85
|
+0.90
1.43% |
$64.25
|
464,784
70.32% of 50 DAV
50 DAV is 661,000
|
$64.45
-0.93%
|
4/10/2018
|
$62.05
|
PP = $62.15
|
|
MB = $65.26
|
Most Recent Note - 5/7/2018 6:10:56 PM
Y - Volume totals have cooled while hovering in a tight range near its all-time high. No resistance remains due to overhead supply.
>>> FEATURED STOCK ARTICLE : Encountered Distribution, Finished Below Pivot Point After Early Gain - 4/11/2018 |
View all notes |
Set NEW NOTE alert |
Company Profile |
SEC
News |
Chart |
Request a new note
C
A
S
I |
Symbol/Exchange
Company Name
Industry Group |
PRICE |
CHANGE
(%Change) |
Day High |
Volume
(% DAV)
(% 50 day avg vol) |
52 Wk Hi
% From Hi |
Featured
Date |
Price
Featured |
Pivot Featured |
|
Max Buy |
NOVT
-
NASDAQ
Novanta Inc
Elec-Scientific/Msrng
|
$62.40
|
+0.70
1.13% |
$62.45
|
241,717
104.64% of 50 DAV
50 DAV is 231,000
|
$63.60
-1.89%
|
4/17/2018
|
$60.55
|
PP = $60.40
|
|
MB = $63.42
|
Most Recent Note - 5/8/2018 5:41:00 PM
Y - Posted a 5th consecutive gain backed by above average volume. Reported earnings +52% on +35% sales revenues for the Mar '18 quarter. Found support near prior highs in the $58 area and stayed above its 50 DMA line ($56.40) during the recent consolidation.
>>> FEATURED STOCK ARTICLE : Volume-Driven Gain Hit New All-Time High - 4/17/2018 |
View all notes |
Set NEW NOTE alert |
Company Profile |
SEC
News |
Chart |
Request a new note
C
A
S
I |
SEDG
-
NASDAQ
Solaredge Technologies
Energy-Solar
|
$55.65
|
-0.50
-0.89% |
$57.00
|
1,510,416
223.43% of 50 DAV
50 DAV is 676,000
|
$59.20
-6.00%
|
5/9/2018
|
$55.33
|
PP = $59.30
|
|
MB = $62.27
|
Most Recent Note - 5/9/2018 1:29:38 PM
Found prompt support at its 50 DMA line and remains perched near its all-time high. Due to report earnings news today after the market close, and volume and volatility often increase near earnings reports. Color code is changed to yellow with pivot point cited based on its 4/10/18 high plus 10 cents. Subsequent gains above the pivot point backed by at least +40% above average volume are needed to trigger a technical buy signal. Last noted in the 4/16/18 mid-day reports - "This Israel-based Energy - Solar firm had a "breakaway gap" for a considerable volume-driven gain on 2/15/18 and tallied additional volume driven gains for new all-time highs. Bullish action came after it reported Dec '17 earnings +166% on +70% sales revenues, its 3rd consecutive quarterly comparison with earnings above the +25% minimum guideline (C criteria) with a great acceleration in its sales revenues growth rate. Disciplined investors may wait for a new base or secondary buy point to possibly develop and be noted in the weeks ahead."
There are no Featured Stock Updates™ available for this stock at this time. You may request one by clicking the Request a New Note link below |
View all notes |
Set NEW NOTE alert |
Company Profile |
SEC
News |
Chart |
Request a new note
C
A
S
I |
SEND
-
NYSE
Sendgrid Inc
INTERNET - Content
|
$27.69
|
+1.63
6.25% |
$27.78
|
410,882
99.73% of 50 DAV
50 DAV is 412,000
|
$32.03
-13.54%
|
3/6/2018
|
$28.00
|
PP = $28.37
|
|
MB = $29.79
|
Most Recent Note - 5/9/2018 3:53:11 PM
G - A rebound above the 50 DMA line ($28.06) is needed for its outlook to improve. Held its ground above the prior low ($23.77 on 4/04/18) after triggering a technical sell signal. Weak action followed news earnings rose +100% on +31% sales revenues for the Mar '18 quarter continuing its strong earnings track record. Completed a new Public Offering and Secondary Offering on 4/05/18.
>>> FEATURED STOCK ARTICLE : Earnings News Continues to be Strong - 5/1/2018 |
View all notes |
Set NEW NOTE alert |
Company Profile |
SEC
News |
Chart |
Request a new note
C
A
S
I |