You are not logged in.
This means you
CAN ONLY VIEW reports that were published prior to Monday, April 7, 2025.
You
MUST UPGRADE YOUR MEMBERSHIP if you want to see any current reports.
AFTER MARKET UPDATE - TUESDAY, AUGUST 11TH, 2015
Previous After Market Report Next After Market Report >>>
|
|
|
|
DOW |
-212.33 |
17,402.84 |
-1.21% |
|
Volume |
833,946,390 |
-2% |
|
Volume |
1,756,716,050 |
+8% |
|
NASDAQ |
-65.01 |
5,036.79 |
-1.27% |
|
Advancers |
1,156 |
37% |
|
Advancers |
854 |
29% |
|
S&P 500 |
-20.11 |
2,084.07 |
-0.96% |
|
Decliners |
1,958 |
63% |
|
Decliners |
2,046 |
71% |
|
Russell 2000 |
-11.54 |
1,211.14 |
-0.94% |
|
52 Wk Highs |
42 |
|
|
52 Wk Highs |
40 |
|
|
S&P 600 |
-4.99 |
704.68 |
-0.70% |
|
52 Wk Lows |
162 |
|
|
52 Wk Lows |
129 |
|
|
 |
Breadth Negative as Major Averages Fall Amid More Geopolitical Concerns
Kenneth J. Gruneisen - Passed the CAN SLIM® Master's Exam
Stocks finished lower on Tuesday, giving back the prior session's gains as investors focused on international weakness. The Dow lost 212 points to 17403. The S&P 500 declined 20 points to 2084. The NASDAQ fell 65 points to 5036. Volume totals were reported mixed, lighter than the prior session total on the NYSE and higher on the Nasdaq exchange. Breadth was negative as decliners led advancers by more than a 3-2 margin on the NYSE and more than 2-1 on the Nasdaq exchange. Leadership contracted as there were 24 high-ranked companies from the Leaders List that made new 52-week highs and appeared on the BreakOuts Page, down from the prior session total of 47 stocks. There were gains for only 3 of the 16 high-ranked companies currently on the Featured Stocks Page, a disproportionately negative bias versus the broader market. There was an increase in the number of new 52-week lows anf they solidly outnumbered new 52-week highs on both the Nasdaq and on the NYSE.
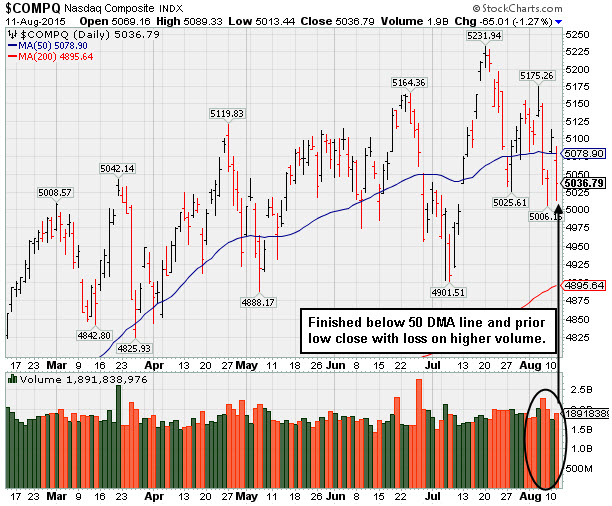
With Tuesday's big losses the Nasdaq Composite Index and the benchmark S&P 500 Index both abruptly retreated back below their respective 50-day moving average (DMA) lines, raising concerns. Technical deterioration in the charts of the major averages (M criteria) coupled with a contraction in leadership gave investors more reasons to be cautious as previously noted pressure may lead to a more substantial market "correction".
Disciplined investors always limit losses by selling any stock that falls more than -7% from their purchase price. This is precisely how the fact-based investment system prompts investors to reduce exposure in weak markets, preserving cash until another confirmed rally marked by solid leadership.
PICTURED: The NASDAQ Composite Index fell 65 points to 5,036, abruptly retreating back below its 50-day moving average (DMA) line.
Overnight, Chinese officials devalued the yuan by 1.9%, the most in two decades. Eight of the 10 S&P 500 sectors were lower as consumer discretionary and commodity-related stocks suffered the most. Ford (F -1.9%) and the new General Motors Company (GM -3.5%) both fell on speculation that Chinese demand could wane. Similarly, in the luxury space, Tiffany (TIF 2.1%) retreated. Materials were a relative laggard in sympathy with commodity prices. Freeport McMoRan (FCX -12.3%) dove and Alcoa (AA -6%) was also lower after citing demand concerns. In the energy patch, Exxon Mobil (XOM -0.7%) edged lower.
In other news, Google (GOOG +4.1%) helped lift tech stocks as it rose rose after announcing restructuring plans. Symantec (SYMC -6.9%) slumped after agreeing to sell its Veritas business to the Carlyle group for $8 billion.
Economic data showed labor productivity rose less-than-expected in the second quarter, while wholesale inventories rose more than estimated for June.
Treasuries gained amid the global equity selloff. The benchmark 10-year note advanced 25/32 to yield 2.139%.
Commodities were mixed. WTI crude retreated 3.4% to $43.45/barrel on reports of OPEC production reaching a three-year high. On the COMEX, gold rose 0.3% to $1107.60/ounce, but copper tumbled 2.5% lower to $2.33/lb.
Stocks identified as the best matches with the fact-based investment system's guidelines currently are listed to the Featured Stocks Page. It shows the most current notes with headline links where members have access to more detailed letter-by-letter analysis including price/volume graphs annotated by our experts. See the Premium Member Homepage for archives to all prior pay reports.
|
 Kenneth J. Gruneisen started out as a licensed stockbroker in August 1987, a couple of months prior to the historic stock market crash that took the Dow Jones Industrial Average down -22.6% in a single day. He has published daily fact-based fundamental and technical analysis on high-ranked stocks online for two decades. Through FACTBASEDINVESTING.COM, Kenneth provides educational articles, news, market commentary, and other information regarding proven investment systems that work in good times and bad.
Comments contained in the body of this report are technical opinions only and are not necessarily those of Gruneisen Growth Corp. The material herein has been obtained from sources believed to be reliable and accurate, however, its accuracy and completeness cannot be guaranteed. Our firm, employees, and customers may effect transactions, including transactions contrary to any recommendation herein, or have positions in the securities mentioned herein or options with respect thereto. Any recommendation contained in this report may not be suitable for all investors and it is not to be deemed an offer or solicitation on our part with respect to the purchase or sale of any securities. |
|
 |
Deterioration in Financial Indexes Hurts Broader Market Outlook
Kenneth J. Gruneisen - Passed the CAN SLIM® Master's Exam
The Broker/Dealer Index ($XBD -2.23%) and the Bank Index ($BKX -0.96%) both weighed on the major averages as they fell on Tuesday, meanwhile the Retail Index ($RLX -0.09%) finished flat. The Networking Index ($NWX -2.02%) and the Semiconductor Index ($SOX -2.27%) both fell by more than -2% and the Biotechnology Index ($BTK -0.92%) also ended lower. The Oil Services Index ($OSX -1.31%) slid, meanwhile, the Gold & Silver Index ($XAU +0.47%) and the Integrated Oil Index ($XOI +0.22%) were standout gainers as both edged higher.
PICTURED: The Broker/Dealer Index ($XBD -2.23%) met resistance at its 50-day moving average (DMA) line and has been slumping toward its 200 DMA line.
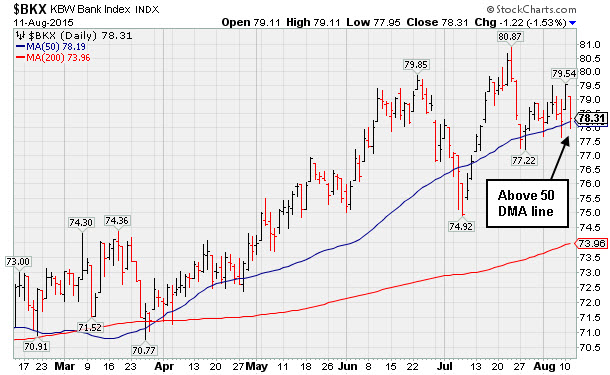
PICTURED: The Bank Index ($BKX -0.96%) remains just above its 50 DMA line. They have been reliable "leading indicators", so any further deterioration in Financial stocks would raise greater concerns regarding the broader market outlook. Historic studies have shown, and longtime readers may recall, that the market has been prone to its worst downdrafts when financial stocks are weak.
| Oil Services |
$OSX |
183.51 |
-2.44 |
-1.31% |
-12.97% |
| Integrated Oil |
$XOI |
1,212.59 |
+2.69 |
+0.22% |
-10.05% |
| Semiconductor |
$SOX |
637.85 |
-14.80 |
-2.27% |
-7.14% |
| Networking |
$NWX |
387.39 |
-7.99 |
-2.02% |
+8.23% |
| Broker/Dealer |
$XBD |
189.31 |
-4.31 |
-2.23% |
+2.53% |
| Retail |
$RLX |
1,228.24 |
-1.16 |
-0.09% |
+18.93% |
| Gold & Silver |
$XAU |
49.47 |
+0.23 |
+0.47% |
-28.08% |
| Bank |
$BKX |
78.31 |
-1.22 |
-1.53% |
+5.45% |
| Biotech |
$BTK |
4,066.36 |
-37.62 |
-0.92% |
+18.24% |
|
|
|
 |
Fundamental and Technical Concerns Hurt Outlook
Kenneth J. Gruneisen - Passed the CAN SLIM® Master's Exam
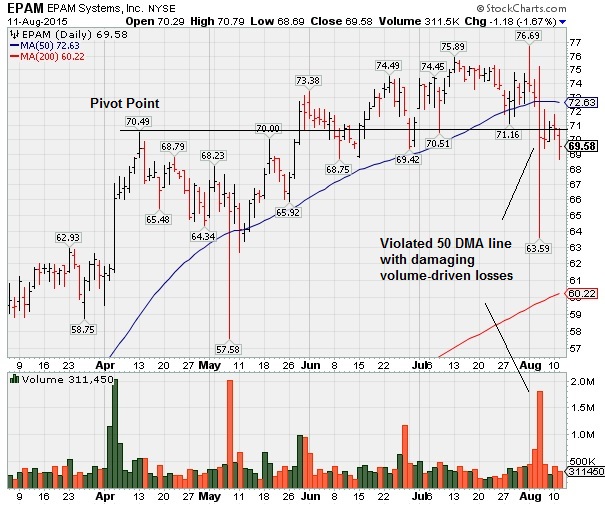
Epam Systems Inc (EPAM -$1.18 or -1.67% to $69.58) slumped further below its 50-day moving average (DMA) line. A rebound above that short-term average is needed to help its outlook improve. It will be dropped from the Featured Stocks list tonight due to fundamental and technical deterioration noted recently.
Fundamentally, it still has a strong 94 Earnings Per Share Rating, well above the 80+ minimum guideline for buy candidates. However, it reported earnings +21% on +25% sales revenues for the Jun '15 quarter, below the +25% minimum guideline (C criteria), raising fundamental concerns. It had previously reported earnings +33%, +40%, +29%, and +30% in the Jun, Sep, Dec '14 and Mar '15 quarterly comparisons versus the year ago periods, respectively. Sales revenues rose +31%, +38%, +28% and +25% during that span. Annual earnings growth (A criteria) has been strong.
The Computer - Tech Services firm violated its 50 DMA line triggering a technical sell signal with damaging losses since last shown in this FSU section on 7/23/15 with an annotated graph under the headline, "Volume Totals Cooling While Consolidating Near Highs". Its Relative Strength rating of 95 remains well above the 80+ minimum guideline for buy candidates.
It completed Secondary Offerings 8/30/13 and 9/17/13. The number of top-rated funds owning its shares rose from 254 in Dec '13 to 376 Jun '15, a reassuring sign concerning the I criteria. Its small supply of only 41.1 million shares (S criteria) in the pubic float can contribute to greater volatility in the event of institutional buying or selling.
|
|
|
Color Codes Explained :
Y - Better candidates highlighted by our
staff of experts.
G - Previously featured
in past reports as yellow but may no longer be buyable under the
guidelines.
***Last / Change / Volume data in this table is the closing quote data***
Symbol/Exchange
Company Name
Industry Group |
PRICE |
CHANGE
(%Change) |
Day High |
Volume
(% DAV)
(% 50 day avg vol) |
52 Wk Hi
% From Hi |
Featured
Date |
Price
Featured |
Pivot Featured |
|
Max Buy |
GSBC
-
NASDAQ
Great Southern Bancorp
BANKING - Savings and Loans
|
$41.44
|
-0.42
-1.00% |
$41.82
|
28,514
86.41% of 50 DAV
50 DAV is 33,000
|
$42.99
-3.60%
|
4/27/2015
|
$40.94
|
PP = $40.54
|
|
MB = $42.57
|
Most Recent Note - 8/10/2015 12:38:22 PM
G - Consolidating near its 50 DMA line ($41.51) defining near-term support. Reported earnings +8% on -11% sales revenues for the Jun '15 quarter, raising fundamental concerns, and its color code was changed to green. Below the 50 DMA line its prior low ($40.46 on 7/08/15) defines the next important support where a violation would trigger a more worrisome technical sell signal.
>>> FEATURED STOCK ARTICLE : Finding Support While Consolidating After Sub Par Quarter - 7/30/2015 |
View all notes |
Set NEW NOTE alert |
Company Profile |
SEC
News |
Chart |
Request a new note
C
A
S
I |
BOFI
-
NASDAQ
B O F I Holding Inc
BANKING - Savings andamp; Loans
|
$130.25
|
-0.23
-0.18% |
$131.30
|
180,768
78.59% of 50 DAV
50 DAV is 230,000
|
$134.79
-3.37%
|
6/10/2015
|
$101.47
|
PP = $97.78
|
|
MB = $102.67
|
Most Recent Note - 8/6/2015 12:22:10 PM
G - Perched at its all-time high following 6 consecutive gains marked by above average volume. Previously noted with caution - "It may produce more climactic gains, however it is very extended from its prior base. Its recent low ($111.43 on 7/29/15) defines near term support above its 50 DMA line."
>>> FEATURED STOCK ARTICLE : Extended and Perched Near High With Earnings News Due Soon - 7/27/2015 |
View all notes |
Set NEW NOTE alert |
Company Profile |
SEC
News |
Chart |
Request a new note
C
A
S
I |
EPAM
-
NYSE
Epam Systems Inc
COMPUTER SOFTWARE and SERVICES - Information Technology Service
|
$69.58
|
-1.18
-1.67% |
$70.79
|
311,450
79.05% of 50 DAV
50 DAV is 394,000
|
$76.69
-9.27%
|
5/18/2015
|
$67.42
|
PP = $70.59
|
|
MB = $74.12
|
 Most Recent Note - 8/11/2015 3:14:08 PM
Quietly slumping further below its 50 DMA line. A rebound above that short-term average is needed to help its outlook improve. It will be dropped from the Featured Stocks list due to fundamental and technical deterioration noted recently.
>>> FEATURED STOCK ARTICLE : Fundamental and Technical Concerns Hurt Outlook - 8/11/2015 |
View all notes |
Set NEW NOTE alert |
Company Profile |
SEC
News |
Chart |
Request a new note
C
A
S
I |
AHS
-
NYSE
A M N Healthcare Svcs
DIVERSIFIED SERVICES - Staffing and Outsourcing Service
|
$34.50
|
+0.11
0.32% |
$34.80
|
379,073
55.66% of 50 DAV
50 DAV is 681,000
|
$36.34
-5.06%
|
8/5/2015
|
$34.50
|
PP = $32.53
|
|
MB = $34.16
|
Most Recent Note - 8/10/2015 3:35:38 PM
G - Rallied above its "max buy" level and its color code is changed to green. Prior highs in the $32 area define initial support to watch above its 50 DMA line.
>>> FEATURED STOCK ARTICLE : Gap Up Gain Triggered Technical Buy Signal Following Earnings - 8/5/2015 |
View all notes |
Set NEW NOTE alert |
Company Profile |
SEC
News |
Chart |
Request a new note
C
A
S
I |
ILMN
-
NASDAQ
Illumina Inc
DRUGS - Biotechnology
|
$208.59
|
-3.18
-1.50% |
$212.55
|
1,161,676
80.78% of 50 DAV
50 DAV is 1,438,000
|
$242.37
-13.94%
|
6/8/2015
|
$209.97
|
PP = $213.43
|
|
MB = $224.10
|
Most Recent Note - 8/6/2015 6:25:16 PM
G - Color code is changed to green after slumping below its 50 DMA line with a big loss on higher volume. Damaging losses below recent lows ($207) would raise concerns and trigger a more worrisome technical sell signal.
>>> FEATURED STOCK ARTICLE : Support Found After Abrupt Pullback Following Earnings News - 7/24/2015 |
View all notes |
Set NEW NOTE alert |
Company Profile |
SEC
News |
Chart |
Request a new note
C
A
S
I |
Symbol/Exchange
Company Name
Industry Group |
PRICE |
CHANGE
(%Change) |
Day High |
Volume
(% DAV)
(% 50 day avg vol) |
52 Wk Hi
% From Hi |
Featured
Date |
Price
Featured |
Pivot Featured |
|
Max Buy |
JAZZ
-
NASDAQ
Jazz Pharmaceuticals Plc
DRUGS - Biotechnology
|
$178.80
|
-2.68
-1.48% |
$181.07
|
296,626
69.96% of 50 DAV
50 DAV is 424,000
|
$194.73
-8.18%
|
7/29/2015
|
$190.13
|
PP = $191.11
|
|
MB = $200.67
|
Most Recent Note - 8/6/2015 1:41:35 PM
G - Pulling back today for a big loss with above average volume. Color code is changed to green due to fundamental concerns. Reported earnings +19% on +15% sales revenues for the Jun '15 quarter, below the +25% minimum earnings guideline (C criteria). It stalled after highlighted in yellow with pivot point cited based on its 4/27/15 high plus 10 cents in the 7/29/15 mid-day report (read here).
>>> FEATURED STOCK ARTICLE : No Resistance Due to Overhead Supply For Drug Firm - 7/29/2015 |
View all notes |
Set NEW NOTE alert |
Company Profile |
SEC
News |
Chart |
Request a new note
C
A
S
I |
VRX
-
NYSE
Valeant Pharmaceuticals
DRUGS - Drug Manufacturers - Other
|
$245.99
|
-1.16
-0.47% |
$247.75
|
1,213,042
73.38% of 50 DAV
50 DAV is 1,653,000
|
$263.81
-6.75%
|
7/14/2015
|
$236.75
|
PP = $246.11
|
|
MB = $258.42
|
Most Recent Note - 8/6/2015 1:31:17 PM
Y - Pulling back today with higher volume, a sign of distributional pressure after wedging higher with recent gains lacking great volume conviction. Prior highs in the $246 area define initial support above the 50 DMA line. Its 7/23/15 gap up above the pivot point triggered a new (or add-on) technical buy signal.
>>> FEATURED STOCK ARTICLE : Holding Ground Following Latest Technical Breakout - 8/3/2015 |
View all notes |
Set NEW NOTE alert |
Company Profile |
SEC
News |
Chart |
Request a new note
C
A
S
I |
USNA
-
NYSE
U S A N A Health Science
DRUGS - Drug Related Products
|
$161.87
|
-2.09
-1.27% |
$164.83
|
111,135
84.19% of 50 DAV
50 DAV is 132,000
|
$176.88
-8.49%
|
8/5/2015
|
$157.22
|
PP = $145.15
|
|
MB = $152.41
|
Most Recent Note - 8/6/2015 6:18:59 PM
G - Abruptly pulled back and finished near the session low today with a big loss on heavy volume. Prior highs in the $145 area define initial support to watch. Quickly got very extended after highlighted in yellow with a pivot point based on its 7/02/15 high plus 10 cents in the 8/05/15 mid-day report (read here). A "breakaway gap" is one noted exception where buying more than +5% above a prior high is allowed under the fact-based investment system. Risk increases the further one chases a stock above prior highs. See the latest FSU analysis for more details and a new annotated graph.
>>> FEATURED STOCK ARTICLE : Abrupt Retreat Following Breakout for Stock With Small Supply - 8/6/2015 |
View all notes |
Set NEW NOTE alert |
Company Profile |
SEC
News |
Chart |
Request a new note
C
A
S
I |
AMBA
-
NASDAQ
Ambarella Inc
ELECTRONICS - Semiconductor - Specialized
|
$112.94
|
-5.27
-4.46% |
$118.80
|
2,900,120
65.99% of 50 DAV
50 DAV is 4,395,000
|
$129.19
-12.58%
|
5/1/2015
|
$75.99
|
PP = $77.49
|
|
MB = $81.36
|
Most Recent Note - 8/11/2015 3:07:31 PM
G - Slumping near prior lows and its 50 DMA line defining important support in the $109-110 area. Damaging losses leading to violations would trigger technical sell signals.
>>> FEATURED STOCK ARTICLE : Choppy Consolidation is Not a New Cup-With-Handle Base - 8/7/2015 |
View all notes |
Set NEW NOTE alert |
Company Profile |
SEC
News |
Chart |
Request a new note
C
A
S
I |
ACHC
-
NASDAQ
Acadia Healthcare Inc
HEALTH SERVICES - Specialized Health Services
|
$80.28
|
-2.17
-2.63% |
$81.08
|
846,857
113.98% of 50 DAV
50 DAV is 743,000
|
$85.62
-6.24%
|
5/27/2015
|
$73.90
|
PP = $74.19
|
|
MB = $77.90
|
Most Recent Note - 8/11/2015 3:10:25 PM
G - Gapped down today after proposing a Secondary Offering. Brief consolidation was not a sound base pattern of sufficient length. Reported strong sales and earnings increases with acceleration again for Jun '15 quarter. Its 50 DMA line and recent lows define important support.
>>> FEATURED STOCK ARTICLE : Pullback Followed Another Strong Quarter Reported With Acceleration - 8/4/2015 |
View all notes |
Set NEW NOTE alert |
Company Profile |
SEC
News |
Chart |
Request a new note
C
A
S
I |
Symbol/Exchange
Company Name
Industry Group |
PRICE |
CHANGE
(%Change) |
Day High |
Volume
(% DAV)
(% 50 day avg vol) |
52 Wk Hi
% From Hi |
Featured
Date |
Price
Featured |
Pivot Featured |
|
Max Buy |
APOG
-
NASDAQ
Apogee Enterprises
MATERIALS and CONSTRUCTION - General Building Materials
|
$53.20
|
-0.29
-0.54% |
$53.93
|
146,883
44.92% of 50 DAV
50 DAV is 327,000
|
$61.05
-12.86%
|
4/9/2015
|
$49.58
|
PP = $48.13
|
|
MB = $50.54
|
Most Recent Note - 8/6/2015 6:21:41 PM
G - Color code is changed to green while quietly slumping below its 50 DMA line. Damaging losses below recent low ($50.07 on 7/07/15) would raise greater concerns and trigger a worrisome technical sell signal.
>>> FEATURED STOCK ARTICLE : Rebound Above 50-Day Moving Average Line - 7/31/2015 |
View all notes |
Set NEW NOTE alert |
Company Profile |
SEC
News |
Chart |
Request a new note
C
A
S
I |
JLL
-
NYSE
Jones Lang Lasalle Inc
REAL ESTATE - Property Management/Developmen
|
$179.35
|
+0.44
0.25% |
$179.97
|
248,690
87.26% of 50 DAV
50 DAV is 285,000
|
$179.83
-0.27%
|
6/4/2015
|
$172.34
|
PP = $174.93
|
|
MB = $183.68
|
Most Recent Note - 8/10/2015 3:38:46 PM
Y - Posting another gain with below average volume today, poised for a best ever close. Found encouraging support at its 50 DMA line, however, recent gains above the pivot point lacked the minimum +40% above average volume necessary to trigger a new (or add-on) technical buy signal.
>>> FEATURED STOCK ARTICLE : Recent Gains Lacked Volume Conviction; Earnings Report Soon Expected - 7/22/2015 |
View all notes |
Set NEW NOTE alert |
Company Profile |
SEC
News |
Chart |
Request a new note
C
A
S
I |
RH
-
NYSE
Restoration Hardware Hld
RETAIL - Home Furnishing Stores
|
$99.72
|
-0.39
-0.39% |
$100.80
|
737,178
96.87% of 50 DAV
50 DAV is 761,000
|
$105.98
-5.91%
|
7/28/2015
|
$102.40
|
PP = $102.10
|
|
MB = $107.21
|
Most Recent Note - 8/6/2015 1:38:10 PM
Y - Pulling back near near prior highs in the $100 area defining initial support. Its 50 DMA line ($98.04) defines the next important support level to watch.
>>> FEATURED STOCK ARTICLE : Fundamental and Technical Action Improved Outlook - 7/28/2015 |
View all notes |
Set NEW NOTE alert |
Company Profile |
SEC
News |
Chart |
Request a new note
C
A
S
I |
ULTA
-
NASDAQ
Ulta Salon Cosm & Frag
SPECIALTY RETAIL - Specialty Retail, Other
|
$168.51
|
+0.15
0.09% |
$168.51
|
559,665
80.53% of 50 DAV
50 DAV is 695,000
|
$171.21
-1.58%
|
5/29/2015
|
$155.03
|
PP = $159.95
|
|
MB = $167.95
|
Most Recent Note - 8/10/2015 3:28:29 PM
Y - Small gap up today nearly challenging 52-week high. Consolidating well above prior highs in the $159 area defining initial support to watch on pullbacks.
>>> FEATURED STOCK ARTICLE : Near "Max Buy" Level, But Recent Gains Lacked Great Volume Conviction - 7/20/2015 |
View all notes |
Set NEW NOTE alert |
Company Profile |
SEC
News |
Chart |
Request a new note
C
A
S
I |
LXFT
-
NYSE
Luxoft Holding Inc Cl A
Comp Sftwr-Spec Enterprs
|
$60.04
|
-1.13
-1.85% |
$61.15
|
137,987
56.32% of 50 DAV
50 DAV is 245,000
|
$63.56
-5.54%
|
5/26/2015
|
$51.90
|
PP = $57.40
|
|
MB = $60.27
|
Most Recent Note - 8/10/2015 5:52:13 PM
G - Posted a quiet gain today. Reporting Jun '15 earnings on Wednesday. Consolidating above 50 DMA line ($58.84) and prior highs in the $57 area. Subsequent violations would trigger technical sell signals. See the latest FSU analysis for more details and a new annotated graph.
>>> FEATURED STOCK ARTICLE : Earnings News Often Leads to Greater Volume and Volatility - 8/10/2015 |
View all notes |
Set NEW NOTE alert |
Company Profile |
SEC
News |
Chart |
Request a new note
C
A
S
I |
Symbol/Exchange
Company Name
Industry Group |
PRICE |
CHANGE
(%Change) |
Day High |
Volume
(% DAV)
(% 50 day avg vol) |
52 Wk Hi
% From Hi |
Featured
Date |
Price
Featured |
Pivot Featured |
|
Max Buy |
PANW
-
NYSE
Palo Alto Networks
Computer Sftwr-Security
|
$173.93
|
-3.03
-1.71% |
$177.46
|
1,367,303
94.04% of 50 DAV
50 DAV is 1,454,000
|
$200.55
-13.27%
|
3/27/2015
|
$146.44
|
PP = $149.45
|
|
MB = $156.92
|
Most Recent Note - 8/11/2015 3:04:36 PM
G - Met resistance at its 50 DMA line when trying to rebound after a damaging loss on 8/06/15 with heavy volume triggered a technical sell signal. Subsequent losses below its prior low ($167.82 on 7/07/15) would trigger a more worrisome technical sell signal.
>>> FEATURED STOCK ARTICLE : Wedging to New Highs After Brief Consolidation - 7/21/2015 |
View all notes |
Set NEW NOTE alert |
Company Profile |
SEC
News |
Chart |
Request a new note
C
A
S
I |
|
|
|
THESE ARE NOT BUY RECOMMENDATIONS!
Comments contained in the body of this report are technical
opinions only. The material herein has been obtained
from sources believed to be reliable and accurate, however,
its accuracy and completeness cannot be guaranteed.
This site is not an investment advisor, hence it does
not endorse or recommend any securities or other investments.
Any recommendation contained in this report may not
be suitable for all investors and it is not to be deemed
an offer or solicitation on our part with respect to
the purchase or sale of any securities. All trademarks,
service marks and trade names appearing in this report
are the property of their respective owners, and are
likewise used for identification purposes only.
This report is a service available
only to active Paid Premium Members.
You may opt-out of receiving report notifications
at any time. Questions or comments may be submitted
by writing to Premium Membership Services 665 S.E. 10 Street, Suite 201 Deerfield Beach, FL 33441-5634 or by calling 1-800-965-8307
or 954-785-1121.
|
|
|