***Last / Change / Volume data in this table is the closing quote data***
Symbol/Exchange
Company Name
Industry Group |
PRICE |
CHANGE
(%Change) |
Day High |
Volume
(% DAV)
(% 50 day avg vol) |
52 Wk Hi
% From Hi |
Featured
Date |
Price
Featured |
Pivot Featured |
|
Max Buy |
 BLDR
-
NYSE
BLDR
-
NYSE
Builders Firstsource Inc
Bldg-Constr Prds/Misc
|
$76.48
|
+0.48
0.63% |
$79.02
|
3,575,937
166.94% of 50 DAV
50 DAV is 2,142,000
|
$80.95
-5.52%
|
8/12/2021
|
$52.38
|
PP = $54.09
|
|
MB = $56.79
|
 Most Recent Note - 12/8/2021 11:50:24 AM
G - Perched at its all-time high with today's 3rd consecutive volume-driven gain, very extended from any sound base. Reported Sep '21 quarterly earnings +308% on +140% sales revenues versus the year ago period. It is well above its 50 DMA line ($63.13).
>>> FEATURED STOCK ARTICLE : Earnings News Due Thursday for High-Ranked Building Products Firm - 11/2/2021 |
View all notes |
Set NEW NOTE alert |
Company Profile |
SEC
News |
Chart |
Request a new note
C
A
S
I |
KFRC
-
NASDAQ
Kforce Inc
Comml Svcs-Staffing
|
$74.73
|
+1.11
1.51% |
$74.99
|
136,643
131.39% of 50 DAV
50 DAV is 104,000
|
$81.47
-8.27%
|
9/10/2021
|
$59.53
|
PP = $64.48
|
|
MB = $67.70
|
Most Recent Note - 12/8/2021 4:45:11 PM
G - Extended from any sound base and consolidating above its 50 DMA line ($70.56) which defines important near-term support to watch. Recently reported Sep '21 quarterly earnings +8% on +10% sales revenues versus the year ago period, below the +25% minimum earnings guideline (C criteria), raising fundamental concerns.
>>> FEATURED STOCK ARTICLE : Extended From Base and Latest Quarter Earnings Growth Sub Par - 11/19/2021 |
View all notes |
Set NEW NOTE alert |
Company Profile |
SEC
News |
Chart |
Request a new note
C
A
S
I |
CAMT
-
NASDAQ
Camtek Ltd
ELECTRONICS - Scientific and Technical Instrum
|
$46.60
|
+0.75
1.64% |
$46.90
|
103,883
40.42% of 50 DAV
50 DAV is 257,000
|
$49.60
-6.05%
|
11/9/2021
|
$45.43
|
PP = $46.11
|
|
MB = $48.42
|
Most Recent Note - 12/7/2021 5:35:15 PM
Y - Gapped up today for a solid gain after testing support near its 50 DMA line ($42.12) with 5 consecutive losses. More damaging losses would raise greater concerns. Fundamentals remain strong.
>>> FEATURED STOCK ARTICLE : Rebound Above 50-Day Moving Average Helped Outlook - 11/5/2021 |
View all notes |
Set NEW NOTE alert |
Company Profile |
SEC
News |
Chart |
Request a new note
C
A
S
I |
AMD
-
NASDAQ
Advanced Micro Devices
ELECTRONICS - Semiconductor - Broad Line
|
$145.24
|
+0.39
0.27% |
$147.04
|
40,810,970
73.02% of 50 DAV
50 DAV is 55,890,000
|
$164.46
-11.69%
|
10/27/2021
|
$124.91
|
PP = $122.59
|
|
MB = $128.72
|
Most Recent Note - 12/7/2021 5:29:31 PM
G - Posted a gain today with below average volume after 4 volume-driven losses in the prior 5 sessions, retreating from record high territory. Its 50 DMA line ($129.57) and prior high in the $122 area define important support to watch on pullbacks. Fundamentals remain strong after it reported Sep '21 quarterly earnings +78% on +54% sales revenues versus the year ago period.
>>> FEATURED STOCK ARTICLE : AMD Pulling Back After Considerable Rally - 12/1/2021 |
View all notes |
Set NEW NOTE alert |
Company Profile |
SEC
News |
Chart |
Request a new note
C
A
S
I |
UMC
-
NYSE
United Microelectrnc Adr
ELECTRONICS - Semiconductor - Integrated Cir
|
$11.69
|
-0.85
-6.78% |
$11.92
|
12,989,046
160.10% of 50 DAV
50 DAV is 8,113,000
|
$12.68
-7.81%
|
12/1/2021
|
$12.60
|
PP = $12.72
|
|
MB = $13.36
|
Most Recent Note - 12/8/2021 12:17:38 PM
Y - Gapped down today pulling back with volume running at an above average pace. New pivot point cited was based on its 9/03/21 high plus 10 cents. Its 50 DMA line ($11.05) defines near-term support. A gain and solid close above the pivot point may clinch a new (or add-on) technical buy signal. Reported Sep '21 quarterly earnings +100% on +30% sales revenues versus the year ago period. Recently found support above its 200 DMA line ($10.13).
>>> FEATURED STOCK ARTICLE : Rebound Above 50-Day Moving Average Showed Resilience - 11/30/2021 |
View all notes |
Set NEW NOTE alert |
Company Profile |
SEC
News |
Chart |
Request a new note
C
A
S
I |
Symbol/Exchange
Company Name
Industry Group |
PRICE |
CHANGE
(%Change) |
Day High |
Volume
(% DAV)
(% 50 day avg vol) |
52 Wk Hi
% From Hi |
Featured
Date |
Price
Featured |
Pivot Featured |
|
Max Buy |
ENTG
-
NASDAQ
Entegris Inc
ELECTRONICS - Semiconductor Equipment and Mate
|
$152.96
|
-0.24
-0.16% |
$153.99
|
871,543
82.07% of 50 DAV
50 DAV is 1,062,000
|
$158.00
-3.19%
|
8/4/2021
|
$125.33
|
PP = $126.51
|
|
MB = $132.84
|
Most Recent Note - 12/7/2021 5:41:31 PM
G - Posted a big gain today with below average volume. Very extended from any sound base, its 50 DMA line ($139.12) and prior high ($139) define important near-term support to watch. Fundamentals remain strong after it recently reported Sep '21 quarterly earnings +37% on +20% sales revenues versus the year ago period.
>>> FEATURED STOCK ARTICLE : Best Ever Close After Volume-Driven Gain - 11/29/2021 |
View all notes |
Set NEW NOTE alert |
Company Profile |
SEC
News |
Chart |
Request a new note
C
A
S
I |
SKY
-
NYSE
Skyline Champion Corp
Bldg-Mobile/Mfg andamp; RV
|
$83.90
|
+0.11
0.13% |
$85.92
|
520,547
131.45% of 50 DAV
50 DAV is 396,000
|
$85.33
-1.68%
|
11/3/2021
|
$72.19
|
PP = $66.92
|
|
MB = $70.27
|
Most Recent Note - 12/6/2021 5:33:47 PM
G - Posted a volume-driven gain today for a best-ever close. Its 50 DMA line ($69.39) and prior highs in the $66 area define important near-term support to watch. Reported very strong Mar, Jun and Sep '21 quarterly results versus the year ago periods well above the +25% minimum earnings guideline (C criteria). Annual earnings (A criteria) history has been strong.
>>> FEATURED STOCK ARTICLE : Breakaway Gap After 10-Week Flat Base - 11/3/2021 |
View all notes |
Set NEW NOTE alert |
Company Profile |
SEC
News |
Chart |
Request a new note
C
A
S
I |
DHI
-
NYSE
D R Horton Inc
MATERIALS and CONSTRUCTION - Residential Construction
|
$106.98
|
+0.82
0.77% |
$108.09
|
2,342,502
94.23% of 50 DAV
50 DAV is 2,486,000
|
$107.03
-0.05%
|
12/6/2021
|
$104.40
|
PP = $106.99
|
|
MB = $112.34
|
Most Recent Note - 12/6/2021 5:24:53 PM
Y - Managed a best ever close today after highlighted in yellow with pivot point cited based on its 5/10/21 high plus 10 cents in the earlier mid-day report. Challenged its all-time high and no resistance remains due to overhead supply. Recently rallied from a double bottom. Reported Sep '21 earnings +68% on +27% sales revenues versus the year-ago period, its 8th strong quarterly comparison above the +25% minimum guideline (C criteria). Annual earnings growth (A criteria) has been strong. The market direction (M criteria) remains a concern regarding any new buying until a new confirmed rally with a follow-through day. See the latest FSU analysis for more details and a new annotated graph.
>>> FEATURED STOCK ARTICLE : Builder Built a Solid Base And Challenged Prior High - 12/6/2021 |
View all notes |
Set NEW NOTE alert |
Company Profile |
SEC
News |
Chart |
Request a new note
C
A
S
I |
WSM
-
NYSE
Williams Sonoma Inc
RETAIL - Home Furnishing Stores
|
$182.66
|
-0.26
-0.14% |
$184.43
|
610,079
65.32% of 50 DAV
50 DAV is 934,000
|
$223.32
-18.21%
|
11/3/2021
|
$205.00
|
PP = $195.09
|
|
MB = $204.84
|
Most Recent Note - 12/7/2021 5:52:22 PM
G - Posted a gain today with lighter volume halting a streak of 5 consecutive damaging volume-driven losses. A rebound above its 50 DMA line ($191) is needed for its outlook to improve. Fundamental remain strong after it reported Oct '21 quarterly earnings +30% on +16% sales revenues versus the year ago period.
>>> FEATURED STOCK ARTICLE : Volume-Driven Gains May Signal a New Meaningful Leg Up - 11/4/2021 |
View all notes |
Set NEW NOTE alert |
Company Profile |
SEC
News |
Chart |
Request a new note
C
A
S
I |
TITN
-
NASDAQ
Titan Machinery Inc
SPECIALTY RETAIL
|
$33.94
|
+0.18
0.53% |
$34.68
|
97,620
61.78% of 50 DAV
50 DAV is 158,000
|
$38.58
-12.03%
|
11/23/2021
|
$36.22
|
PP = $35.34
|
|
MB = $37.11
|
Most Recent Note - 12/6/2021 5:39:22 PM
G - Showing resilience but gains have lacked great volume after slumping back into the prior base with volume-driven losses. Reported Oct '21 quarterly earnings +81% on +26% sales revenues over the year ago period, its 4th strong quarterly comparison.
>>> FEATURED STOCK ARTICLE : Strong Close With Gain Backed by +467% Above Average Volume - 11/23/2021 |
View all notes |
Set NEW NOTE alert |
Company Profile |
SEC
News |
Chart |
Request a new note
C
A
S
I |
Symbol/Exchange
Company Name
Industry Group |
PRICE |
CHANGE
(%Change) |
Day High |
Volume
(% DAV)
(% 50 day avg vol) |
52 Wk Hi
% From Hi |
Featured
Date |
Price
Featured |
Pivot Featured |
|
Max Buy |
CLFD
-
NASDAQ
Clearfield Inc
TELECOMMUNICATIONS - Cables / Satalite Equipment
|
$66.30
|
+0.59
0.90% |
$67.15
|
83,459
65.20% of 50 DAV
50 DAV is 128,000
|
$72.00
-7.92%
|
7/23/2021
|
$40.23
|
PP = $43.74
|
|
MB = $45.93
|
Most Recent Note - 12/7/2021 5:37:07 PM
G - Posted a solid gain on below average volume today. Still extended from the previously noted base, consolidating above its 50 DMA line ($57.95) which defines near-term support to watch on pullbacks. Reported Sep '21 quarterly earnings +141% on +66% sales revenues above the year ago period.
>>> FEATURED STOCK ARTICLE : Perched Near High Extended From Any Sound Base - 11/22/2021 |
View all notes |
Set NEW NOTE alert |
Company Profile |
SEC
News |
Chart |
Request a new note
C
A
S
I |
ODFL
-
NASDAQ
Old Dominion Fght Line
TRANSPORTATION - Trucking
|
$356.81
|
-7.19
-1.98% |
$370.28
|
765,029
133.05% of 50 DAV
50 DAV is 575,000
|
$373.58
-4.49%
|
12/7/2021
|
$365.61
|
PP = $364.17
|
|
MB = $382.38
|
Most Recent Note - 12/7/2021 5:27:33 PM
Y - Finished in the middle of its intra-day range after hitting a new high today. Color code was changed to yellow after more than 3 weeks tight. Subsequent volume-driven gains are needed to clinch a buy signal, and the broader market direction (M criteria) remains a concern until a follow-through day. Reported earnings +44% on +32% sales revenues for the Sep '21 quarter, its 5th consecutive comparison above the +25% minimum guideline (C criteria). See the latest FSU analysis for more details and a new annotated graph.
>>> FEATURED STOCK ARTICLE : Perched at All Time High After Tight Consolidation Several Weeks - 12/7/2021 |
View all notes |
Set NEW NOTE alert |
Company Profile |
SEC
News |
Chart |
Request a new note
C
A
S
I |
ENPH
-
NASDAQ
Enphase Energy Inc
Energy-Solar
|
$225.61
|
+3.05
1.37% |
$227.48
|
1,632,890
67.20% of 50 DAV
50 DAV is 2,430,000
|
$282.46
-20.13%
|
10/28/2021
|
$218.00
|
PP = $229.14
|
|
MB = $240.60
|
Most Recent Note - 12/7/2021 5:40:14 PM
G - Halted its slide at its 50 DMA line ($209) with today's gain on lighter volume following 5 consecutive losses. More damaging losses would raise serious concerns and trigger a technical sell signal. Undercut the prior high ($229) raising concerns while recently slumping back into the prior base.
>>> FEATURED STOCK ARTICLE : Pullback Testing Near Prior High - 12/2/2021 |
View all notes |
Set NEW NOTE alert |
Company Profile |
SEC
News |
Chart |
Request a new note
C
A
S
I |
SMPL
-
NASDAQ
Simply Good Foods Co
Food-Confectionery
|
$37.94
|
-0.19
-0.50% |
$38.28
|
285,526
78.01% of 50 DAV
50 DAV is 366,000
|
$41.35
-8.25%
|
10/25/2021
|
$38.30
|
PP = $38.60
|
|
MB = $40.53
|
Most Recent Note - 12/7/2021 5:54:07 PM
Y - Color code is changed to yellow after today's 4th consecutive gain, rebounding above its 50 DMA line ($37.57) helping its outlook improve.
>>> FEATURED STOCK ARTICLE : Consolidating Above Prior High Following Recent Technical Breakout - 11/15/2021 |
View all notes |
Set NEW NOTE alert |
Company Profile |
SEC
News |
Chart |
Request a new note
C
A
S
I |
WDAY
-
NYSE
Workday Inc Cl A
Computer Sftwr-Enterprse
|
$282.30
|
+2.06
0.74% |
$284.39
|
922,230
56.68% of 50 DAV
50 DAV is 1,627,000
|
$307.81
-8.29%
|
9/7/2021
|
$275.69
|
PP = $282.87
|
|
MB = $297.01
|
Most Recent Note - 12/7/2021 5:50:23 PM
Y - Color code is changed to yellow after rebounding above its 50 DMA line with today's 4th consecutive gain helping its outlook improve. Its Relative Strength Rating has improved to 81, above the 80+ minimum guideline for buy candidates. Reported Oct '21 quarterly earnings +28% on +20% sales revenues versus the year ago period. Fundamentals remain strong.
>>> FEATURED STOCK ARTICLE : Getting Extended From Previously Noted Base - 11/16/2021 |
View all notes |
Set NEW NOTE alert |
Company Profile |
SEC
News |
Chart |
Request a new note
C
A
S
I |
Symbol/Exchange
Company Name
Industry Group |
PRICE |
CHANGE
(%Change) |
Day High |
Volume
(% DAV)
(% 50 day avg vol) |
52 Wk Hi
% From Hi |
Featured
Date |
Price
Featured |
Pivot Featured |
|
Max Buy |
CTLT
-
NYSE
"Catalent, Inc"
DRUGS - Biotechnology
|
$127.46
|
+3.97
3.21% |
$128.18
|
938,824
101.02% of 50 DAV
50 DAV is 929,300
|
$142.64
-10.64%
|
8/25/2021
|
$128.72
|
PP = $127.78
|
|
MB = $134.17
|
Most Recent Note - 12/8/2021 4:40:13 PM
G - Rebounded near its 50 DMA line ($129.77) with today's 2nd consecutive gain. Tested near the prior low ($119) and 200 DMA line ($118) which define important near-term support to watch. More damaging losses would raise greater concerns. Its Relative Strength Rating is 75, above the 80+ minimum guideline for buy candidates. Fundamentals remain strong after it reported Sep '21 quarterly earnings +65% on +21% sales revenues versus the year ago period, continuing its strong earnings track record.
>>> FEATURED STOCK ARTICLE : Recent Violation of 50-Day Moving Average Triggered Sell Signal - 11/11/2021 |
View all notes |
Set NEW NOTE alert |
Company Profile |
SEC
News |
Chart |
Request a new note
C
A
S
I |
TTD
-
NASDAQ
The Trade Desk Inc Cl A
Comml Svcs-Advertising
|
$97.90
|
+2.18
2.28% |
$99.00
|
2,597,025
48.16% of 50 DAV
50 DAV is 5,392,000
|
$114.09
-14.19%
|
11/9/2021
|
$95.16
|
PP = $90.00
|
|
MB = $94.50
|
Most Recent Note - 12/7/2021 5:46:04 PM
G - Color code is changed to green after rising above its "max buy" level again with today's gain on light volume. Found support after falling near the prior high ($90). More damaging losses would raise serious concerns and its 50 DMA line ($84.70) defines additional support to watch.
>>> FEATURED STOCK ARTICLE : Powerful Volume-Driven Gains for New Highs - 11/9/2021 |
View all notes |
Set NEW NOTE alert |
Company Profile |
SEC
News |
Chart |
Request a new note
C
A
S
I |
MEDP
-
NASDAQ
Medpace Holdings Inc
Medical-Research Eqp/Svc
|
$213.65
|
-0.03
-0.01% |
$214.08
|
142,157
87.21% of 50 DAV
50 DAV is 163,000
|
$231.00
-7.51%
|
9/10/2021
|
$196.32
|
PP = $196.22
|
|
MB = $206.03
|
Most Recent Note - 12/7/2021 5:43:49 PM
G - Posted a gain today with lighter volume after testing its 50 DMA line ($206). More damaging losses may trigger a technical sell signal. Below its 50 DMA line the prior highs in the $199 area define important near-term support to watch. Recently noted repeatedly - "Sep '21 earnings rose +18% on +28% sales revenues versus the year ago period, below the +25% minimum earnings guideline (C criteria), raising fundamental concerns.
>>> FEATURED STOCK ARTICLE : Medpace Hovering at High With Volume Totals Cooling - 11/17/2021 |
View all notes |
Set NEW NOTE alert |
Company Profile |
SEC
News |
Chart |
Request a new note
C
A
S
I |
JEF
-
NYSE
Jefferies Financial Grp
Finance-Invest Bnk/Bkrs
|
$38.58
|
-0.92
-2.33% |
$39.66
|
695,814
41.74% of 50 DAV
50 DAV is 1,667,000
|
$44.47
-13.24%
|
6/28/2021
|
$31.81
|
PP = $34.42
|
|
MB = $36.14
|
Most Recent Note - 12/8/2021 4:43:10 PM
G - Still sputtering with volume totals cooling, meanwhile, a rebound above the 50 DMA line ($40.81) is needed for its outlook to improve. Reported Aug '21 quarterly earnings +40% on +20% sales revenues versus the year ago period.
>>> FEATURED STOCK ARTICLE : Extended From Prior Highs and Stubbornly Holding Ground - 11/1/2021 |
View all notes |
Set NEW NOTE alert |
Company Profile |
SEC
News |
Chart |
Request a new note
C
A
S
I |
AVTR
-
NYSE
Avantor Inc
Medical-Research Eqp/Svc
|
$39.95
|
+0.44
1.11% |
$40.01
|
3,110,551
80.50% of 50 DAV
50 DAV is 3,864,000
|
$44.37
-9.96%
|
6/10/2021
|
$32.94
|
PP = $34.09
|
|
MB = $35.79
|
Most Recent Note - 12/7/2021 5:32:10 PM
G - Posted a gain today rebounding above its 50 DMA line ($39.14) helping its technical stance improve. Faces overhead supply up to the $44 level. Prior lows in the high $36 area define important near-term support. Reported Sep '21 quarterly earnings +46% above the year ago period. Completed a Secondary Offering on 9/13/21.
>>> FEATURED STOCK ARTICLE : Faces Resistance While Sputtering Below 50 DMA Line - 11/12/2021 |
View all notes |
Set NEW NOTE alert |
Company Profile |
SEC
News |
Chart |
Request a new note
C
A
S
I |
Symbol/Exchange
Company Name
Industry Group |
PRICE |
CHANGE
(%Change) |
Day High |
Volume
(% DAV)
(% 50 day avg vol) |
52 Wk Hi
% From Hi |
Featured
Date |
Price
Featured |
Pivot Featured |
|
Max Buy |
MIME
-
NASDAQ
Mimecast Limited
Computer Sftwr-Security
|
$79.13
|
-0.27
-0.34% |
$79.65
|
3,949,077
532.94% of 50 DAV
50 DAV is 741,000
|
$85.48
-7.43%
|
10/18/2021
|
$68.17
|
PP = $71.55
|
|
MB = $75.13
|
Most Recent Note - 12/8/2021 12:05:48 PM
G - Holding its ground today after gapping up on M&A news on the prior session. Found prompt support at its 50 DMA line ($73.61) and prior highs in the $71 area. More damaging losses would raise concerns and trigger technical sell signals.
>>> FEATURED STOCK ARTICLE : Extended From Latest Base While Fundamentals Remain Strong - 11/26/2021 |
View all notes |
Set NEW NOTE alert |
Company Profile |
SEC
News |
Chart |
Request a new note
C
A
S
I |
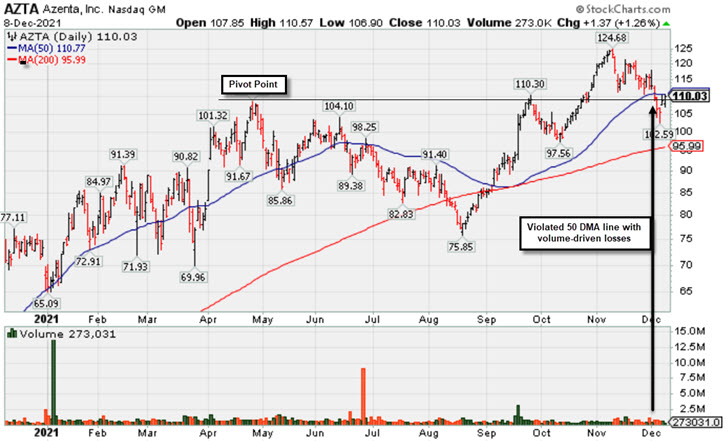
AZTA
-
NASDAQ
"Azenta, Inc."
ELECTRONICS - Semiconductor Equipment
|
$110.03
|
+1.37
1.26% |
$110.57
|
273,031
49.66% of 50 DAV
50 DAV is 549,800
|
$124.79
-11.83%
|
9/20/2021
|
$101.21
|
PP = $108.82
|
|
MB = $114.26
|
Most Recent Note - 12/8/2021 5:32:56 PM
G - Posted a quiet gain today rebounding near its 50 DMA line after damaging volume-driven losses triggering technical sell signals. A prompt rebound above the 50 DMA line ($110.86) would help its outlook improve. See the latest FSU analysis for more details and a new annotated graph.
>>> FEATURED STOCK ARTICLE : Recently Undercut Prior High and 50-Day Moving Average - 12/8/2021 |
View all notes |
Set NEW NOTE alert |
Company Profile |
SEC
News |
Chart |
Request a new note
C
A
S
I |