You are not logged in.
This means you
CAN ONLY VIEW reports that were published prior to Monday, March 31, 2025.
You
MUST UPGRADE YOUR MEMBERSHIP if you want to see any current reports.
AFTER MARKET UPDATE - THURSDAY, DECEMBER 2ND, 2021
Previous After Market Report Next After Market Report >>>
|
|
|
|
DOW |
+617.75 |
34,639.79 |
+1.82% |
|
Volume |
1,127,140,595 |
-1% |
|
Volume |
5,352,398,600 |
-14% |
|
NASDAQ |
+127.27 |
15,381.32 |
+0.83% |
|
Advancers |
2,434 |
74% |
|
Advancers |
2,790 |
64% |
|
S&P 500 |
+64.06 |
4,577.10 |
+1.42% |
|
Decliners |
836 |
26% |
|
Decliners |
1,591 |
36% |
|
Russell 2000 |
+58.91 |
2,206.33 |
+2.74% |
|
52 Wk Highs |
17 |
|
|
52 Wk Highs |
31 |
|
|
S&P 600 |
+37.39 |
1,360.01 |
+2.83% |
|
52 Wk Lows |
188 |
|
|
52 Wk Lows |
619 |
|
|
Concerns rose as damaging losses on volume, coupled with waning leadership, showed the major indices' uptrend coming under pressure (M criteria). A healthy crop of leaders is necessary for any rally to be maintained. Without improvement in the market internals in the near term the chances grow even greater for a more severe market correction.
|
 |
Major Indices Rebounded With Lighter Volume and Less Leadership
Kenneth J. Gruneisen - Passed the CAN SLIM® Master's Exam
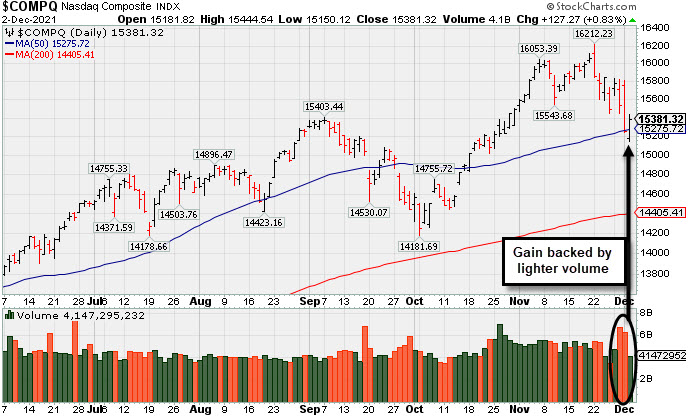
The Dow rallied 617 points, notching its best one-day performance since March. The S&P 500 saw its best session in nearly two months, climbing 1.4% on the heels of its biggest two-day decline since October 2020 (-3.1%). The Nasdaq Composite rose 0.8%, while the Russell 2000 rebounded out of correction territory (defined as a 10% drawdown from a recent peak). The volume totals were reported lower than the prior session on the NYSE and on the Nasdaq exchange. Breadth was clearly positive as advancers led decliners by almost a 3-1 margin on the NYSE and by nearly 2-1 on the Nasdaq exchange. There were 4 high-ranked companies from the Leaders List that hit new 52-week highs and were listed on the BreakOuts Page versus 16 on the prior session. New 52-week lows totals solidly outnumbered still shrinking new 52-week highs totals on the NYSE and on the Nasdaq exchange. The major indices' uptrend is under pressure (M criteria). Investors are reminded to sell stocks that weaken on a case-by-case basis as dictated by the rules of the fact-based investment system.
PICTURED: The Nasdaq Composite found support at its 50-day moving average (DMA) line as it posted a gain backed by lighter volume after damaging volume-driven losses.
U.S. stocks finished firmly higher on Thursday, extending the week’s bout of volatility as investors monitored COVID-19 headlines. Pandemic uncertainty sparked a perceived “risk off” tone yesterday afternoon following the first confirmed U.S. Omicron coronavirus case in California. Today, headlines appeared more upbeat, with an executive from Pfizer suggesting the company’s COVID-19 vaccine should be able to offer protection against the newest strain.
All 11 S&P 500 sectors closed in positive territory, with the more cyclical and value-oriented groups outperforming. Industrials paced the gains with Boeing (BA + 7.4%) rising after China’s aviation regulator approved the company’s 737-MAX aircraft to return to flying. Technology stocks underperformed on a relative basis, with Apple (AAPL -0.8%) fell after warning its component suppliers that demand for its latest iPhone was softer than previously forecasted.
On the data front, weekly initial jobless claims came in at a better-than-anticipated 222,000. Treasuries were lower, with the yield on the 10-year note up two basis points (0.02%) to 1.43%. In commodities, WTI crude advanced 2.1% to $66.93/barrel despite OPEC+ (Organization of the Petroleum Exporting Countries plus others) planning to proceed with January’s production increase, as the cartel said the decision could be revised depending on additional information surrounding the Omicron COVID-19 variant. |
 Kenneth J. Gruneisen started out as a licensed stockbroker in August 1987, a couple of months prior to the historic stock market crash that took the Dow Jones Industrial Average down -22.6% in a single day. He has published daily fact-based fundamental and technical analysis on high-ranked stocks online for two decades. Through FACTBASEDINVESTING.COM, Kenneth provides educational articles, news, market commentary, and other information regarding proven investment systems that work in good times and bad.
Comments contained in the body of this report are technical opinions only and are not necessarily those of Gruneisen Growth Corp. The material herein has been obtained from sources believed to be reliable and accurate, however, its accuracy and completeness cannot be guaranteed. Our firm, employees, and customers may effect transactions, including transactions contrary to any recommendation herein, or have positions in the securities mentioned herein or options with respect thereto. Any recommendation contained in this report may not be suitable for all investors and it is not to be deemed an offer or solicitation on our part with respect to the purchase or sale of any securities. |
|
 |
Financial, Energy, Networking, Biotech, and Retail Indexes Rose
Kenneth J. Gruneisen - Passed the CAN SLIM® Master's Exam
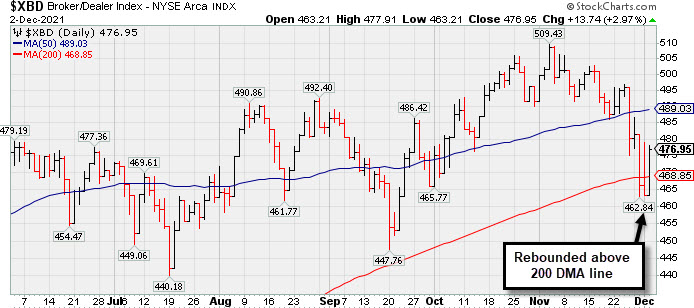
The Broker/Dealer Index ($XBD +2.97%) and Bank Index ($BKX +3.42%) both posted solid gains while the Retail Index ($RLX +0.78%) posted a smaller gain. The Biotech Index ($BTK +1.31%) and Networking Index ($NWX +1.93%) both posted solid gains while the Semiconductor Index ($SOX +0.00%) was unchanged. The Oil Services Index ($OSX +3.41%) and Integrated Oil Index ($XOI +3.20%) both posted solid gains while the Gold & Silver Index ($XAU -0.61%) edged lower.
PICTURED: The Broker/Dealer Index ($XBD +2.97%) rebounded above its 200-day moving average (DMA) line after slumping below its 50 and 200 DMA lines with 3 big losses in the prior 4 sessions.
| Oil Services |
$OSX |
50.82 |
+1.67 |
+3.41% |
+14.64% |
| Integrated Oil |
$XOI |
1,151.91 |
+35.74 |
+3.20% |
+45.36% |
| Semiconductor |
$SOX |
3,810.81 |
+0.07 |
+0.00% |
+36.32% |
| Networking |
$NWX |
866.84 |
+16.39 |
+1.93% |
+20.88% |
| Broker/Dealer |
$XBD |
476.96 |
+13.75 |
+2.97% |
+26.31% |
| Retail |
$RLX |
4,254.96 |
+32.74 |
+0.78% |
+19.41% |
| Gold & Silver |
$XAU |
125.20 |
-0.76 |
-0.61% |
-13.17% |
| Bank |
$BKX |
133.75 |
+4.42 |
+3.42% |
+36.61% |
| Biotech |
$BTK |
5,327.22 |
+68.89 |
+1.31% |
-7.18% |
|
|
|
 |
Pullback Testing Near Prior High
Kenneth J. Gruneisen - Passed the CAN SLIM® Master's Exam
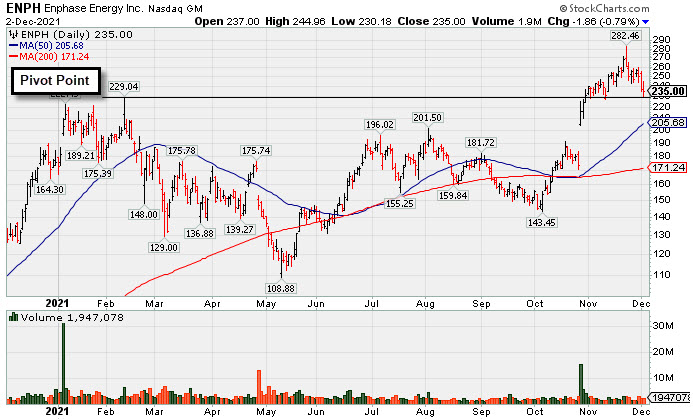
Enphase Energy Inc (ENPH -$1.86 or -0.79% to $235.00) has been consolidating back below its "max buy" level. The prior high ($229) defines initial support to watch above its 50-day moving average (DMA) line ($205.68).
ENPH was highlighted in yellow in the 10/28/21 mid-day report (read here) with pivot point cited based on its 2/10/21 high plus 10 cents. and last shown with an annotated graph that evening under the headline, "Enphase is Challenging its All-Time High With Volume-Driven Gains". Subsequent gains above the pivot point backed by at least +40% above average volume triggered a technical buy signal.
ENPH has an Earnings Per Share Rating of 99. It reported very strong sales revenues and earnings increases in quarterly comparisons through Sep '21 versus the year ago periods, above the +25% minimum guideline (C criteria). It has a strong annual earnings (A criteria) history since FY '18 after years of losses.
The company hails from the Energy-Solar group which is currently ranked 7th of the 197 Industry Groups (L criteria). The number of top-rated funds owning its shares rose from 1,068 in Dec '20 to 1,508 in Sep '21, a reassuring sign concerning the I criteria.
|
|
|
Color Codes Explained :
Y - Better candidates highlighted by our
staff of experts.
G - Previously featured
in past reports as yellow but may no longer be buyable under the
guidelines.
***Last / Change / Volume data in this table is the closing quote data***
Symbol/Exchange
Company Name
Industry Group |
PRICE |
CHANGE
(%Change) |
Day High |
Volume
(% DAV)
(% 50 day avg vol) |
52 Wk Hi
% From Hi |
Featured
Date |
Price
Featured |
Pivot Featured |
|
Max Buy |
 SIVB
-
NASDAQ
SIVB
-
NASDAQ
S V B Financial Group
BANKING - Regional - Pacific Banks
|
$712.20
|
+36.61
5.42% |
$716.01
|
372,552
110.55% of 50 DAV
50 DAV is 337,000
|
$763.22
-6.68%
|
8/6/2021
|
$589.70
|
PP = $608.94
|
|
MB = $639.39
|
 Most Recent Note - 12/2/2021 5:27:31 PM
G - Today's big gain and prompt rebound above the 50 DMA line ($707) helped its technical stance improve. Recently reported Sep '21 quarterly earnings -14% on +43% sales revenues versus the year ago period, below the +25% minimum earnings guideline (C criteria), raising fundamental concerns. Completed a new Public Offering on 8/11/21.
>>> FEATURED STOCK ARTICLE : Latest Quarter Raised Fundamental Concerns - 10/29/2021 |
View all notes |
Set NEW NOTE alert |
Company Profile |
SEC
News |
Chart |
Request a new note
C
A
S
I |
BLDR
-
NYSE
Builders Firstsource Inc
Bldg-Constr Prds/Misc
|
$73.32
|
+3.10
4.41% |
$74.20
|
2,626,182
130.20% of 50 DAV
50 DAV is 2,017,000
|
$74.15
-1.12%
|
8/12/2021
|
$52.38
|
PP = $54.09
|
|
MB = $56.79
|
Most Recent Note - 12/2/2021 5:31:23 PM
G - Posted a solid gain today for its second-best ever close, getting very extended from any sound base. Reported Sep '21 quarterly earnings +308% on +140% sales revenues versus the year ago period. Its 50 DMA line ($61.54) and prior highs in the $55 area define important near-term support to watch on pullbacks.
>>> FEATURED STOCK ARTICLE : Earnings News Due Thursday for High-Ranked Building Products Firm - 11/2/2021 |
View all notes |
Set NEW NOTE alert |
Company Profile |
SEC
News |
Chart |
Request a new note
C
A
S
I |
DSGX
-
NASDAQ
Descartes Systems Group
COMPUTER SOFTWARE and SERVICES - Business Software and Services
|
$80.74
|
+2.36
3.01% |
$81.17
|
237,088
269.42% of 50 DAV
50 DAV is 88,000
|
$91.39
-11.65%
|
11/18/2021
|
$90.77
|
PP = $87.56
|
|
MB = $91.94
|
Most Recent Note - 12/2/2021 12:25:24 PM
G - A rebound above the 50 DMA line ($83) is needed for its outlook to improve. Reported Oct '21 quarterly earnings +100% on +24% sales revenues versus the year ago period. Its 50 DMA line may act as resistance after a spurt of damaging volume-driven losses.
>>> FEATURED STOCK ARTICLE : Reversed After Wedging to New Highs - 11/18/2021 |
View all notes |
Set NEW NOTE alert |
Company Profile |
SEC
News |
Chart |
Request a new note
C
A
S
I |
KFRC
-
NASDAQ
Kforce Inc
Comml Svcs-Staffing
|
$75.15
|
+1.83
2.50% |
$75.55
|
118,574
108.78% of 50 DAV
50 DAV is 109,000
|
$81.47
-7.76%
|
9/10/2021
|
$59.53
|
PP = $64.48
|
|
MB = $67.70
|
Most Recent Note - 11/29/2021 12:59:55 PM
G - Still hovering near its all-time high. Its prior high and 50 DMA line ($68.66) define important near-term support to watch on pullbacks. Recently reported Sep '21 quarterly earnings +8% on +10% sales revenues versus the year ago period, below the +25% minimum earnings guideline (C criteria), raising fundamental concerns.
>>> FEATURED STOCK ARTICLE : Extended From Base and Latest Quarter Earnings Growth Sub Par - 11/19/2021 |
View all notes |
Set NEW NOTE alert |
Company Profile |
SEC
News |
Chart |
Request a new note
C
A
S
I |
CAMT
-
NASDAQ
Camtek Ltd
ELECTRONICS - Scientific and Technical Instrum
|
$44.55
|
-1.27
-2.77% |
$46.01
|
226,952
90.42% of 50 DAV
50 DAV is 251,000
|
$49.60
-10.18%
|
11/9/2021
|
$45.43
|
PP = $46.11
|
|
MB = $48.42
|
Most Recent Note - 11/29/2021 5:02:51 PM
Y - Posted a solid gain today with higher volume, finding prompt support near the prior high. Weak action came after recently proposing a new $140 Million note offering. Fundamentals remain strong.
>>> FEATURED STOCK ARTICLE : Rebound Above 50-Day Moving Average Helped Outlook - 11/5/2021 |
View all notes |
Set NEW NOTE alert |
Company Profile |
SEC
News |
Chart |
Request a new note
C
A
S
I |
Symbol/Exchange
Company Name
Industry Group |
PRICE |
CHANGE
(%Change) |
Day High |
Volume
(% DAV)
(% 50 day avg vol) |
52 Wk Hi
% From Hi |
Featured
Date |
Price
Featured |
Pivot Featured |
|
Max Buy |
AMD
-
NASDAQ
Advanced Micro Devices
ELECTRONICS - Semiconductor - Broad Line
|
$150.68
|
+1.57
1.05% |
$152.53
|
55,938,096
103.68% of 50 DAV
50 DAV is 53,953,000
|
$164.46
-8.38%
|
10/27/2021
|
$124.91
|
PP = $122.59
|
|
MB = $128.72
|
Most Recent Note - 12/1/2021 5:16:48 PM
G - Pulled back today for a 2nd big volume-driven loss, retreating from record high territory. Very extended from the previously noted base. Its 50 DMA line ($126.49) and prior high in the $122 area define important support to watch on pullbacks. Fundamentals remain strong after it reported Sep '21 quarterly earnings +78% on +54% sales revenues versus the year ago period. See the latest FSU analysis for more details and a new annotated graph.
>>> FEATURED STOCK ARTICLE : AMD Pulling Back After Considerable Rally - 12/1/2021 |
View all notes |
Set NEW NOTE alert |
Company Profile |
SEC
News |
Chart |
Request a new note
C
A
S
I |
UMC
-
NYSE
United Microelectrnc Adr
ELECTRONICS - Semiconductor - Integrated Cir
|
$12.15
|
-0.08
-0.65% |
$12.33
|
6,561,459
83.25% of 50 DAV
50 DAV is 7,882,000
|
$12.68
-4.18%
|
12/1/2021
|
$12.60
|
PP = $12.72
|
|
MB = $13.36
|
Most Recent Note - 12/1/2021 12:58:01 PM
Y - Color code is changed to yellow with new pivot point cited based on its 9/03/21 high plus 10 cents. Hitting a new all-time high while posting a 3rd consecutive gain today with ever increasing volume after consolidating above its 50 DMA line ($11.03). A gain and solid close above the pivot point may clinch a new (or add-on) technical buy signal. Reported Sep '21 quarterly earnings +100% on +30% sales revenues versus the year ago period. Recently found support above its 200 DMA line ($10.08).
>>> FEATURED STOCK ARTICLE : Rebound Above 50-Day Moving Average Showed Resilience - 11/30/2021 |
View all notes |
Set NEW NOTE alert |
Company Profile |
SEC
News |
Chart |
Request a new note
C
A
S
I |
BRKS
-
NASDAQ
Brooks Automation
ELECTRONICS - Semiconductor Equipment and Mate
|
$109.38
|
-3.62
-3.20% |
$113.04
|
794,539
139.30% of 50 DAV
50 DAV is 570,400
|
$124.79
-12.35%
|
9/20/2021
|
$101.21
|
PP = $108.82
|
|
MB = $114.26
|
Most Recent Note - 12/2/2021 11:11:39 AM
Azenta Inc. (AZTA), formerly Brooks Automation Inc., is now trading under a new ticker. The previous ticker was "BRKS." The company had said on Nov. 16 that it was changing its name to Azenta, following the launch of the Azenta Life Sciences brand, and after announcing in September that it was selling its semiconductor automation business to Thomas H. Lee Partners. Consolidating above the prior high ($110) and its 50 DMA line which define important near-term support to watch where violations may trigger technical sell signals. Reported Sep 21 quarterly earnings +33% on +27% sales revenues versus the year ago period.
>>> FEATURED STOCK ARTICLE : Consolidating Still Well Above Prior High and 50 DMA Line - 11/24/2021 |
View all notes |
Set NEW NOTE alert |
Company Profile |
SEC
News |
Chart |
Request a new note
C
A
S
I |
ENTG
-
NASDAQ
Entegris Inc
ELECTRONICS - Semiconductor Equipment and Mate
|
$153.25
|
+4.59
3.09% |
$154.48
|
1,469,651
141.72% of 50 DAV
50 DAV is 1,037,000
|
$158.00
-3.01%
|
8/4/2021
|
$125.33
|
PP = $126.51
|
|
MB = $132.84
|
Most Recent Note - 11/30/2021 5:38:31 PM
G - Suffered a big volume-driven loss today. Very extended from any sound base, its 50 DMA line ($137) and prior high ($136) define important near-term support to watch. Fundamentals remain strong after it recently reported Sep '21 quarterly earnings +37% on +20% sales revenues versus the year ago period. See the latest FSU analysis for more details and an annotated graph.
>>> FEATURED STOCK ARTICLE : Best Ever Close After Volume-Driven Gain - 11/29/2021 |
View all notes |
Set NEW NOTE alert |
Company Profile |
SEC
News |
Chart |
Request a new note
C
A
S
I |
SKY
-
NYSE
Skyline Champion Corp
Bldg-Mobile/Mfg andamp; RV
|
$81.94
|
+5.13
6.68% |
$82.37
|
598,115
162.09% of 50 DAV
50 DAV is 369,000
|
$82.73
-0.95%
|
11/3/2021
|
$72.19
|
PP = $66.92
|
|
MB = $70.27
|
Most Recent Note - 12/2/2021 5:28:52 PM
G - Posted a solid volume-driven gain today for a best-ever close, getting very extended from the previously noted flat base. Its 50 DMA line ($68.72) and prior highs in the $66 area define important near-term support to watch. Reported very strong Mar, Jun and Sep '21 quarterly results versus the year ago periods well above the +25% minimum earnings guideline (C criteria). Annual earnings (A criteria) history has been strong.
>>> FEATURED STOCK ARTICLE : Breakaway Gap After 10-Week Flat Base - 11/3/2021 |
View all notes |
Set NEW NOTE alert |
Company Profile |
SEC
News |
Chart |
Request a new note
C
A
S
I |
Symbol/Exchange
Company Name
Industry Group |
PRICE |
CHANGE
(%Change) |
Day High |
Volume
(% DAV)
(% 50 day avg vol) |
52 Wk Hi
% From Hi |
Featured
Date |
Price
Featured |
Pivot Featured |
|
Max Buy |
WSM
-
NYSE
Williams Sonoma Inc
RETAIL - Home Furnishing Stores
|
$184.66
|
-2.03
-1.09% |
$190.22
|
1,190,014
133.11% of 50 DAV
50 DAV is 894,000
|
$223.32
-17.31%
|
11/3/2021
|
$205.00
|
PP = $195.09
|
|
MB = $204.84
|
Most Recent Note - 11/30/2021 5:40:16 PM
Y - Color code is changed to yellow after slumping below its "max buy" level with a big loss today. Near-term support to watch is its 50 DMA line ($192.40). Fundamental remain strong after it reported Oct '21 quarterly earnings +30% on +16% sales revenues versus the year ago period.
>>> FEATURED STOCK ARTICLE : Volume-Driven Gains May Signal a New Meaningful Leg Up - 11/4/2021 |
View all notes |
Set NEW NOTE alert |
Company Profile |
SEC
News |
Chart |
Request a new note
C
A
S
I |
TITN
-
NASDAQ
Titan Machinery Inc
SPECIALTY RETAIL
|
$32.95
|
+1.56
4.97% |
$33.20
|
137,231
86.31% of 50 DAV
50 DAV is 159,000
|
$38.58
-14.59%
|
11/23/2021
|
$36.22
|
PP = $35.34
|
|
MB = $37.11
|
Most Recent Note - 12/2/2021 5:32:47 PM
G - Posted a gain today with lighter volume after slumping below the prior high with 5 consecutive losses marked by above average volume. Reported Oct '21 quarterly earnings +81% on +26% sales revenues over the year ago period, its 4th strong quarterly comparison.
>>> FEATURED STOCK ARTICLE : Strong Close With Gain Backed by +467% Above Average Volume - 11/23/2021 |
View all notes |
Set NEW NOTE alert |
Company Profile |
SEC
News |
Chart |
Request a new note
C
A
S
I |
CLFD
-
NASDAQ
Clearfield Inc
TELECOMMUNICATIONS - Cables / Satalite Equipment
|
$64.31
|
+1.23
1.95% |
$64.97
|
98,717
78.97% of 50 DAV
50 DAV is 125,000
|
$72.00
-10.68%
|
7/23/2021
|
$40.23
|
PP = $43.74
|
|
MB = $45.93
|
Most Recent Note - 11/29/2021 4:59:19 PM
G - Still hovering near its all-time high, very extended from the previously noted base. Its 50 DMA line ($55.68) defines near-term support to watch on pullbacks. Reported Sep '21 quarterly earnings +141% on +66% sales revenues above the year ago period.
>>> FEATURED STOCK ARTICLE : Perched Near High Extended From Any Sound Base - 11/22/2021 |
View all notes |
Set NEW NOTE alert |
Company Profile |
SEC
News |
Chart |
Request a new note
C
A
S
I |
ENPH
-
NASDAQ
Enphase Energy Inc
Energy-Solar
|
$235.00
|
-1.86
-0.79% |
$244.96
|
1,933,705
82.60% of 50 DAV
50 DAV is 2,341,000
|
$282.46
-16.80%
|
10/28/2021
|
$218.00
|
PP = $229.14
|
|
MB = $240.60
|
Most Recent Note - 12/2/2021 5:24:04 PM
Y - Pulled back testing near the prior high with today's 3rd consecutive loss. Prior high ($229) defines initial support to watch above its 50 DMA line ($205.68). See the latest FSU analysis for more details and a new annotated graph.
>>> FEATURED STOCK ARTICLE : Pullback Testing Near Prior High - 12/2/2021 |
View all notes |
Set NEW NOTE alert |
Company Profile |
SEC
News |
Chart |
Request a new note
C
A
S
I |
SMPL
-
NASDAQ
Simply Good Foods Co
Food-Confectionery
|
$36.56
|
+0.82
2.29% |
$36.64
|
447,358
123.24% of 50 DAV
50 DAV is 363,000
|
$41.35
-11.58%
|
10/25/2021
|
$38.30
|
PP = $38.60
|
|
MB = $40.53
|
Most Recent Note - 12/1/2021 4:44:41 PM
G - Color code is changed to green after today's 4th consecutive loss, slumping below prior highs in the $38 area and violating its 50 DMA line ($37.43) triggering technical sell signals. Only a prompt rebound above the 50 DMA line would help its outlook improve.
>>> FEATURED STOCK ARTICLE : Consolidating Above Prior High Following Recent Technical Breakout - 11/15/2021 |
View all notes |
Set NEW NOTE alert |
Company Profile |
SEC
News |
Chart |
Request a new note
C
A
S
I |
Symbol/Exchange
Company Name
Industry Group |
PRICE |
CHANGE
(%Change) |
Day High |
Volume
(% DAV)
(% 50 day avg vol) |
52 Wk Hi
% From Hi |
Featured
Date |
Price
Featured |
Pivot Featured |
|
Max Buy |
WDAY
-
NYSE
Workday Inc Cl A
Computer Sftwr-Enterprse
|
$266.66
|
+5.80
2.22% |
$268.37
|
1,877,558
117.38% of 50 DAV
50 DAV is 1,599,500
|
$307.81
-13.37%
|
9/7/2021
|
$275.69
|
PP = $282.87
|
|
MB = $297.01
|
Most Recent Note - 11/29/2021 5:13:06 PM
Y - Color code is changed to yellow after finding prompt support near prior highs in the $278-282 area and its 50 DMA line following recent damaging losses that triggered a technical sell signal. Reported Oct '21 quarterly earnings +28% on +20% sales revenues versus the year ago period. Fundamentals remain strong.
>>> FEATURED STOCK ARTICLE : Getting Extended From Previously Noted Base - 11/16/2021 |
View all notes |
Set NEW NOTE alert |
Company Profile |
SEC
News |
Chart |
Request a new note
C
A
S
I |
CTLT
-
NYSE
Catalent Inc
DRUGS - Biotechnology
|
$127.65
|
+0.34
0.27% |
$127.85
|
1,052,996
118.45% of 50 DAV
50 DAV is 889,000
|
$142.64
-10.51%
|
8/25/2021
|
$128.72
|
PP = $127.78
|
|
MB = $134.17
|
Most Recent Note - 11/30/2021 12:00:41 PM
G - After some encouraging gains today's loss has it pulling back below its 50 DMA line ($131) which recently acted as resistance. Its prior low ($119) and 200 DMA line ($117.73) define important near-term support to watch. More damaging losses would raise greater concerns. Its Relative Strength Rating is 84, above the 80+ minimum guideline for buy candidates. Fundamentals remain strong after it reported Sep '21 quarterly earnings +65% on +21% sales revenues versus the year ago period, continuing its strong earnings track record.
>>> FEATURED STOCK ARTICLE : Recent Violation of 50-Day Moving Average Triggered Sell Signal - 11/11/2021 |
View all notes |
Set NEW NOTE alert |
Company Profile |
SEC
News |
Chart |
Request a new note
C
A
S
I |
TTD
-
NASDAQ
The Trade Desk Inc Cl A
Comml Svcs-Advertising
|
$95.89
|
+0.67
0.70% |
$98.78
|
5,184,435
99.30% of 50 DAV
50 DAV is 5,221,000
|
$114.09
-15.95%
|
11/9/2021
|
$95.16
|
PP = $90.00
|
|
MB = $94.50
|
Most Recent Note - 12/1/2021 4:47:00 PM
G - There was another big loss today after a "negative reversal" on the prior session. It is still extended from the prior high ($90). Its 50 DMA line ($83.37) defines additional support to watch.
>>> FEATURED STOCK ARTICLE : Powerful Volume-Driven Gains for New Highs - 11/9/2021 |
View all notes |
Set NEW NOTE alert |
Company Profile |
SEC
News |
Chart |
Request a new note
C
A
S
I |
MEDP
-
NASDAQ
Medpace Holdings Inc
Medical-Research Eqp/Svc
|
$211.23
|
+2.16
1.03% |
$211.53
|
123,762
75.46% of 50 DAV
50 DAV is 164,000
|
$231.00
-8.56%
|
9/10/2021
|
$196.32
|
PP = $196.22
|
|
MB = $206.03
|
Most Recent Note - 11/30/2021 5:31:35 PM
G - Pulled back near its "max buy" level while testing its 50 DMA line ($204.67) with today's 3rd consecutive loss. More damaging losses may trigger a technical sell signal. As recently noted, Sep '21 earnings rose +18% on +28% sales revenues versus the year ago period, below the +25% minimum earnings guideline (C criteria), raising fundamental concerns. Below its 50 DMA line the prior highs in the $199 area define important near-term support to watch.
>>> FEATURED STOCK ARTICLE : Medpace Hovering at High With Volume Totals Cooling - 11/17/2021 |
View all notes |
Set NEW NOTE alert |
Company Profile |
SEC
News |
Chart |
Request a new note
C
A
S
I |
JEF
-
NYSE
Jefferies Financial Grp
Finance-Invest Bnk/Bkrs
|
$38.94
|
+1.41
3.76% |
$39.31
|
1,326,323
76.84% of 50 DAV
50 DAV is 1,726,000
|
$44.47
-12.44%
|
6/28/2021
|
$31.81
|
PP = $34.42
|
|
MB = $36.14
|
Most Recent Note - 12/2/2021 5:29:53 PM
G - Today's gain was backed by lighter volume. Only a rebound above the 50 DMA line ($40.72) would help its outlook improve. Reported Aug '21 quarterly earnings +40% on +20% sales revenues versus the year ago period.
>>> FEATURED STOCK ARTICLE : Extended From Prior Highs and Stubbornly Holding Ground - 11/1/2021 |
View all notes |
Set NEW NOTE alert |
Company Profile |
SEC
News |
Chart |
Request a new note
C
A
S
I |
Symbol/Exchange
Company Name
Industry Group |
PRICE |
CHANGE
(%Change) |
Day High |
Volume
(% DAV)
(% 50 day avg vol) |
52 Wk Hi
% From Hi |
Featured
Date |
Price
Featured |
Pivot Featured |
|
Max Buy |
AVTR
-
NYSE
Avantor Inc
Medical-Research Eqp/Svc
|
$38.89
|
+0.60
1.57% |
$39.13
|
3,284,013
82.91% of 50 DAV
50 DAV is 3,961,000
|
$44.37
-12.35%
|
6/10/2021
|
$32.94
|
PP = $34.09
|
|
MB = $35.79
|
Most Recent Note - 12/1/2021 4:42:05 PM
G - Suffered a 2nd loss with average volume and ended near the session low today, slumping well below its 50 DMA line ($39.52). A rebound above the 50 DMA line is needed for its outlook to improve, and it faces overhead supply up to the $44 level. Reported Sep '21 quarterly earnings +46% above the year ago period. Completed a Secondary Offering on 9/13/21.
>>> FEATURED STOCK ARTICLE : Faces Resistance While Sputtering Below 50 DMA Line - 11/12/2021 |
View all notes |
Set NEW NOTE alert |
Company Profile |
SEC
News |
Chart |
Request a new note
C
A
S
I |
MIME
-
NASDAQ
Mimecast Limited
Computer Sftwr-Security
|
$78.31
|
+1.97
2.58% |
$78.52
|
699,491
124.02% of 50 DAV
50 DAV is 564,000
|
$85.48
-8.39%
|
10/18/2021
|
$68.17
|
PP = $71.55
|
|
MB = $75.13
|
Most Recent Note - 12/1/2021 4:53:59 PM
G - Pulled back with higher volume today but it remains extended from prior highs and above its "max buy" level. Its 50 DMA line ($72.49) and prior highs in the $71 area define important near-term support to watch.
>>> FEATURED STOCK ARTICLE : Extended From Latest Base While Fundamentals Remain Strong - 11/26/2021 |
View all notes |
Set NEW NOTE alert |
Company Profile |
SEC
News |
Chart |
Request a new note
C
A
S
I |
AZTA
-
NASDAQ
"Azenta, Inc."
ELECTRONICS - Semiconductor Equipment
|
$109.38
|
-3.62
-3.20% |
$113.04
|
794,539
139.30% of 50 DAV
50 DAV is 570,400
|
$124.79
-12.35%
|
9/20/2021
|
$101.21
|
PP = $108.82
|
|
MB = $114.26
|
Most Recent Note - 12/2/2021 5:25:56 PM
Y - Suffered a loss today with above average volume. Azenta Inc. (AZTA), formerly was Brooks Automation Inc., (BRKS). The company had said on Nov. 16 that it was changing its name to Azenta, following the launch of the Azenta Life Sciences brand, and after announcing in September that it was selling its semiconductor automation business to Thomas H. Lee Partners. Consolidating above the prior high ($110) and its 50 DMA line which define important near-term support to watch where violations may trigger technical sell signals. Reported Sep 21 quarterly earnings +33% on +27% sales revenues versus the year ago period.
There are no Featured Stock Updates™ available for this stock at this time. You may request one by clicking the Request a New Note link below |
View all notes |
Set NEW NOTE alert |
Company Profile |
SEC
News |
Chart |
Request a new note
C
A
S
I |
|
|
|
THESE ARE NOT BUY RECOMMENDATIONS!
Comments contained in the body of this report are technical
opinions only. The material herein has been obtained
from sources believed to be reliable and accurate, however,
its accuracy and completeness cannot be guaranteed.
This site is not an investment advisor, hence it does
not endorse or recommend any securities or other investments.
Any recommendation contained in this report may not
be suitable for all investors and it is not to be deemed
an offer or solicitation on our part with respect to
the purchase or sale of any securities. All trademarks,
service marks and trade names appearing in this report
are the property of their respective owners, and are
likewise used for identification purposes only.
This report is a service available
only to active Paid Premium Members.
You may opt-out of receiving report notifications
at any time. Questions or comments may be submitted
by writing to Premium Membership Services 665 S.E. 10 Street, Suite 201 Deerfield Beach, FL 33441-5634 or by calling 1-800-965-8307
or 954-785-1121.
|
|
|