You are not logged in.
This means you
CAN ONLY VIEW reports that were published prior to Thursday, March 20, 2025.
You
MUST UPGRADE YOUR MEMBERSHIP if you want to see any current reports.
AFTER MARKET UPDATE - THURSDAY, NOVEMBER 30TH, 2017
Previous After Market Report Next After Market Report >>>
|
|
|
|
DOW |
+331.67 |
24,272.35 |
+1.39% |
|
Volume |
1,513,271,470 |
+64% |
|
Volume |
2,468,290,010 |
+1% |
|
NASDAQ |
+49.58 |
6,873.97 |
+0.73% |
|
Advancers |
1,767 |
59% |
|
Advancers |
862 |
39% |
|
S&P 500 |
+21.51 |
2,647.58 |
+0.82% |
|
Decliners |
1,213 |
41% |
|
Decliners |
1,325 |
61% |
|
Russell 2000 |
+1.84 |
1,544.14 |
+0.12% |
|
52 Wk Highs |
298 |
|
|
52 Wk Highs |
282 |
|
|
S&P 600 |
-1.16 |
942.94 |
-0.12% |
|
52 Wk Lows |
33 |
|
|
52 Wk Lows |
34 |
|
|
 |
Dow Jones Industrial Average Leads Major Indices Higher
Kenneth J. Gruneisen - Passed the CAN SLIM® Master's Exam
Stocks climbed higher Thursday. The Dow was up 331 points to 24272. The S&P 500 added 21 points to 2647 and the Nasdaq Composite gained 49 points to 6873. Volume totals reported were much higher than the prior session totals on the NYSE and slightly higher on the Nasdaq exchange. Advancers led decliners by a 3-2 margin on the NYSE, meanwhile the mix negative as decliners led advancers by a 3-2 margin on the Nasdaq exchange. There were 127 high-ranked companies from the Leaders List that made new 52-week highs and were listed on the BreakOuts Page, versus the total of 130 on the prior session. New 52-week highs totals solidly outnumbered new 52-week lows on both the NYSE and the Nasdaq exchange. The Featured Stocks Page provides the latest analysis on noteworthy high-ranked leaders. Charts used courtesy of www.stockcharts.com
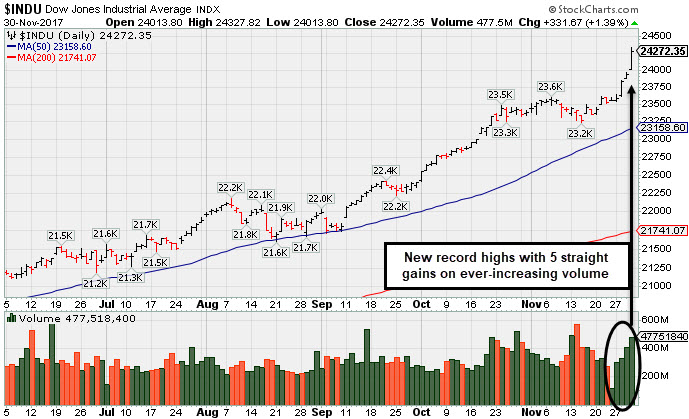 PICTURED: The Dow Jones Industrial Average hit another new record high Thursday with a 5th consecutive gain on ever-increasing volume.
The major averages (M criteria) are in a confirmed uptrend. Investors should only consider stocks meeting all key criteria of the fact-based investment system as they trigger technical buy signals.
The major averages closed out November on a positive note as the possibility of the Senate passing its tax reform plan increased. On Thursday morning, Republican Senator John McCain stated he would support the tax bill as it moved to the floor for debate. On the economic front, Personal consumption expenditures, the Fed’s preferred measure of inflation, rose 0.2%, in line with consensus estimates. An additional release revealed consumer spending grew 0.3% in October while income increased 0.4%.
All 11 S&P 500 sectors finished higher. Technology shares rebounded from their recent sell off as Apple (AAPL +1.40%) and Nvidia (NVDA +2.18%) rose. In M&A news, CVS (CVS +4.36%) rose on reports they were close to finalizing the acquisition of insurer Aetna (AET +0.34%). The Energy sector helped pace gains as Exxon Mobil (XOM +1.24%) and Chevron (CVX +1.54%) rose on reports OPEC and Russia agreed to extend production cuts through the end of 2018.
Treasuries were lower with the yield on the 10-year note up four basis points to 2.42%. In commodities, NYMEX WTI crude was off less than 0.1% to $57.64/barrel. COMEX gold fell 0.7% to $1277.60/ounce. For the month the Dow added 3.8 %, the S&P 500 climbed 2.8%, and the Nasdaq gained 2.2 %. |
 Kenneth J. Gruneisen started out as a licensed stockbroker in August 1987, a couple of months prior to the historic stock market crash that took the Dow Jones Industrial Average down -22.6% in a single day. He has published daily fact-based fundamental and technical analysis on high-ranked stocks online for two decades. Through FACTBASEDINVESTING.COM, Kenneth provides educational articles, news, market commentary, and other information regarding proven investment systems that work in good times and bad.
Comments contained in the body of this report are technical opinions only and are not necessarily those of Gruneisen Growth Corp. The material herein has been obtained from sources believed to be reliable and accurate, however, its accuracy and completeness cannot be guaranteed. Our firm, employees, and customers may effect transactions, including transactions contrary to any recommendation herein, or have positions in the securities mentioned herein or options with respect thereto. Any recommendation contained in this report may not be suitable for all investors and it is not to be deemed an offer or solicitation on our part with respect to the purchase or sale of any securities. |
|
 |
Retail, Financial, Tech, and Energy Linked Groups Rose
Kenneth J. Gruneisen - Passed the CAN SLIM® Master's Exam
The Retail Index ($RLX +0.75%) rallied and outpaced the Broker/Dealer Index ($XBD +0.35%) and the Bank Index ($BKX +0.18%) on Thursday. The tech sector was led by the Biotechnology Index ($BTK +1.82%) as the Semiconductor Index ($SOX +0.60%) and Networking Index ($NWX +0.21%) both edged higher. Commodity-linked groups were mixed as the Integrated Oil Index ($XOI +1.33%) and the Oil Services Index ($OSX +1.83%) rose while the Gold & Silver Index ($XAU -0.29%) again edged lower. Charts courtesy www.stockcharts.com
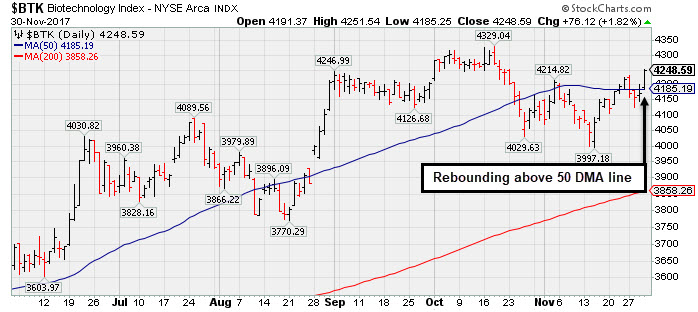 PICTURED: The Biotechnology Index ($BTK +1.82%) rebounded above its 50-day moving average (DMA) line.
| Oil Services |
$OSX |
133.55 |
+2.40 |
+1.83% |
-27.34% |
| Integrated Oil |
$XOI |
1,270.19 |
+16.63 |
+1.33% |
+0.17% |
| Semiconductor |
$SOX |
1,272.55 |
+7.54 |
+0.60% |
+40.39% |
| Networking |
$NWX |
496.96 |
+1.04 |
+0.21% |
+11.40% |
| Broker/Dealer |
$XBD |
258.06 |
+0.91 |
+0.35% |
+25.71% |
| Retail |
$RLX |
1,688.40 |
+12.80 |
+0.76% |
+25.72% |
| Gold & Silver |
$XAU |
79.42 |
-0.23 |
-0.29% |
+0.71% |
| Bank |
$BKX |
104.57 |
+0.19 |
+0.18% |
+13.92% |
| Biotech |
$BTK |
4,248.59 |
+76.12 |
+1.82% |
+38.16% |
|
|
|
 |
Damaging Losses Undercutting 50-Day Average Hurt Outlook
Kenneth J. Gruneisen - Passed the CAN SLIM® Master's Exam
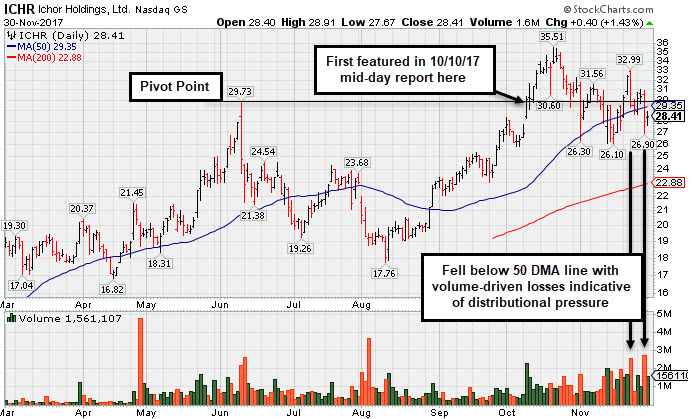
Ichor Holdings Ltd (ICHR +$0.40 or +1.43% to $28.41) fell below its 50-day moving average (DMA) line ($29.35) with recent volume-driven losses indicative of distributional pressure, raising concerns. Recent lows in the $26.00 area define the next important support level to watch where a damaging violation would trigger a technical sell signal. A prompt rebound above its 50-day moving average (DMA) line is needed for its outlook to improve.
ICHR was last shown in this FSU section on 11/03/17 with an annotated graph under the headline "Undercut Prior Highs and Tested 50-Day Moving Average Line". It was highlighted in yellow with pivot point cited based on its 10/02/17 high in the 10/10/17 mid-day report (read here). Volume was more than 3 times averages as it gapped up and hit a new all-time high, rising from a cup-with-handle base.
It currently has a Timeliness rating of A and a Sponsorship rating of C. It has reported great earnings increases, above the +25% minimum guideline (C criteria) for the past 6 quarterly comparisons through Sep '17, helping it match the fact-based investment system's fundamental guidelines. Its limited annual history (A criteria) is a concern, and it is up considerably from its $9 IPO on 12/09/16.
The number of top-rated funds owning its shares rose from 29 on Dec '16 to 177 in Sep '17, a very reassuring sign concerning the I criteria. Its small supply of only 17.9 million shares in the public float (S criteria) can contribute to greater price volatility in the event of institutional buying or selling. Its current Up/Down Volume ratio of 1.2 is an unbiased indication its shares have been under accumulation over the past 50 days. |
|
|
Color Codes Explained :
Y - Better candidates highlighted by our
staff of experts.
G - Previously featured
in past reports as yellow but may no longer be buyable under the
guidelines.
***Last / Change / Volume data in this table is the closing quote data***
Symbol/Exchange
Company Name
Industry Group |
PRICE |
CHANGE
(%Change) |
Day High |
Volume
(% DAV)
(% 50 day avg vol) |
52 Wk Hi
% From Hi |
Featured
Date |
Price
Featured |
Pivot Featured |
|
Max Buy |
THO
-
NYSE
Thor Industries Inc
AUTOMOTIVE - Recreational Vehicles
|
$153.55
|
-1.70
-1.10% |
$156.56
|
875,881
114.95% of 50 DAV
50 DAV is 762,000
|
$156.86
-2.11%
|
8/14/2017
|
$106.67
|
PP = $110.01
|
|
MB = $115.51
|
Most Recent Note - 11/28/2017 12:49:59 PM
G - Reported earnings +63% on +31% sales revenues for the Oct '17 quarter, continuing its strong earnings track record. Gapped up today and hit a new all-time high, getting more extended from the previously noted base. Its 50 DMA line ($129) and recent low ($127.29 on 11/08/17) define near-term support to watch.
>>> FEATURED STOCK ARTICLE : Encountered Distributional Pressure After Getting Extended From Base - 11/10/2017 |
View all notes |
Set NEW NOTE alert |
Company Profile |
SEC
News |
Chart |
Request a new note
C
A
S
I |
PFBC
-
NASDAQ
Preferred Bank Los Angls
BANKING - Regional - Pacific Banks
|
$62.60
|
-1.64
-2.55% |
$64.75
|
123,649
162.70% of 50 DAV
50 DAV is 76,000
|
$66.58
-5.98%
|
10/10/2017
|
$59.38
|
PP = $59.08
|
|
MB = $62.03
|
Most Recent Note - 11/28/2017 5:53:46 PM
Y - Posted a gain today with higher (near average) volume while consolidating above its 50 DMA line ($59.43) after finding prompt support near that important short-term average.
>>> FEATURED STOCK ARTICLE : Slump Back Into Prior Base Raised Concerns - 11/8/2017 |
View all notes |
Set NEW NOTE alert |
Company Profile |
SEC
News |
Chart |
Request a new note
C
A
S
I |
AVGO
-
NASDAQ
Broadcom Limited
ELECTRONICS - Semiconductor - Broad Line
|
$277.94
|
+6.44
2.37% |
$278.35
|
3,137,027
103.98% of 50 DAV
50 DAV is 3,017,000
|
$285.68
-2.71%
|
10/30/2017
|
$261.19
|
PP = $259.46
|
|
MB = $272.43
|
Most Recent Note - 11/27/2017 3:33:31 PM
G - Quietly hitting another new high today, getting more extended from its prior base. Found support while quietly consolidating above prior highs in the $259 area and above its 50 DMA line ($254). Fundamentals remain strong. Recently made bids to acquire Qualcomm Inc (QCOM).
>>> FEATURED STOCK ARTICLE : Consolidating Near Record High Following Volume-Driven Gains - 11/13/2017 |
View all notes |
Set NEW NOTE alert |
Company Profile |
SEC
News |
Chart |
Request a new note
C
A
S
I |
YY
-
NASDAQ
YY Inc Ads
INTERNET - Internet Service Providers
|
$103.19
|
-0.39
-0.38% |
$107.66
|
1,571,587
94.56% of 50 DAV
50 DAV is 1,662,000
|
$123.48
-16.43%
|
9/25/2017
|
$80.26
|
PP = $83.10
|
|
MB = $87.26
|
Most Recent Note - 11/29/2017 1:30:23 PM
G - Prior high in the $97.59 area defines near-term support along with its 50 DMA line ($93.78). Abruptly retreating from its all-time high after getting very extended from any sound base. Fundamentals remain strong.
>>> FEATURED STOCK ARTICLE : Chinese Social Media Firm Reported Earnings - 11/14/2017 |
View all notes |
Set NEW NOTE alert |
Company Profile |
SEC
News |
Chart |
Request a new note
C
A
S
I |
STMP
-
NASDAQ
Stamps.com Inc
INTERNET - Internet Software and Services
|
$168.40
|
-8.30
-4.70% |
$176.50
|
1,197,748
266.17% of 50 DAV
50 DAV is 450,000
|
$233.13
-27.76%
|
9/11/2017
|
$193.65
|
PP = $220.35
|
|
MB = $231.37
|
 Most Recent Note - 11/30/2017 3:10:10 PM
Loss on higher volume today retested support at its 200 DMA line ($160) and low since the gap down on 11/03/17 for a damaging volume-driven loss. A rebound above the 50 DMA line ($201) is needed for its outlook to improve. Fundamentals remain strong. It will be dropped from the Featured Stocks list tonight.
>>> FEATURED STOCK ARTICLE : Halted Slide Above 200 DMA Line, But Additional Rebound Needed - 11/28/2017 |
View all notes |
Set NEW NOTE alert |
Company Profile |
SEC
News |
Chart |
Request a new note
C
A
S
I |
Symbol/Exchange
Company Name
Industry Group |
PRICE |
CHANGE
(%Change) |
Day High |
Volume
(% DAV)
(% 50 day avg vol) |
52 Wk Hi
% From Hi |
Featured
Date |
Price
Featured |
Pivot Featured |
|
Max Buy |
HTHT
-
NASDAQ
China Lodging Group Ads
LEISURE - Lodging
|
$106.71
|
+3.91
3.80% |
$112.39
|
1,279,334
274.54% of 50 DAV
50 DAV is 466,000
|
$142.80
-25.27%
|
9/29/2016
|
$46.12
|
PP = $47.82
|
|
MB = $50.21
|
Most Recent Note - 11/29/2017 1:28:38 PM
G - Damaging volume-driven losses triggered technical sell signals as it slumped well below its 50 DMA line ($126). Reported Sep '17 quarterly earnings +58% on +34% sales revenues versus the year ago period, above the +25% minimum earnings guideline (C criteria). Sequential quarterly comparisons have shown encouraging sales revenues growth acceleration.
>>> FEATURED STOCK ARTICLE : Weak Technical Action Raises Concerns Despite Strong Fundamentals - 11/29/2017 |
View all notes |
Set NEW NOTE alert |
Company Profile |
SEC
News |
Chart |
Request a new note
C
A
S
I |
LMAT
-
NASDAQ
Lemaitre Vascular Inc
Medical-Products
|
$32.93
|
-0.48
-1.44% |
$33.65
|
178,833
91.06% of 50 DAV
50 DAV is 196,400
|
$39.88
-17.43%
|
7/28/2017
|
$33.50
|
PP = $33.32
|
|
MB = $34.99
|
Most Recent Note - 11/27/2017 3:30:58 PM
G - Still consolidating below its 50 DMA line. A rebound above the 50 DMA line ($35.90) is needed for its outlook to improve. Its Relative Strength rating of 85 is above the 80+ minimum guideline for buy candidates. Losses below the 200 DMA line and recent low would raise greater concerns.
>>> FEATURED STOCK ARTICLE : Halted Slide After Damaging 50-Day Moving Average Breach - 11/15/2017 |
View all notes |
Set NEW NOTE alert |
Company Profile |
SEC
News |
Chart |
Request a new note
C
A
S
I |
PATK
-
NASDAQ
Patrick Industries Inc
Bldg-Mobile/Mfg and RV
|
$101.20
|
+2.65
2.69% |
$101.45
|
98,810
117.63% of 50 DAV
50 DAV is 84,000
|
$99.00
2.22%
|
10/26/2017
|
$90.90
|
PP = $87.90
|
|
MB = $92.30
|
Most Recent Note - 11/28/2017 12:43:11 PM
G - Rallying to a new all-time high and its color code is changed to green after getting extended from its prior base. Prior highs and its 50 DMA line ($87.02) define important near-term support to watch. Fundamentals remain strong.
>>> FEATURED STOCK ARTICLE : Best Ever Close After Pullback Found Support Near Prior High - 11/21/2017 |
View all notes |
Set NEW NOTE alert |
Company Profile |
SEC
News |
Chart |
Request a new note
C
A
S
I |
ESNT
-
NYSE
Essent Group Ltd
Finance-MrtgandRel Svc
|
$44.25
|
-0.49
-1.10% |
$45.00
|
878,879
97.65% of 50 DAV
50 DAV is 900,000
|
$45.55
-2.85%
|
10/9/2017
|
$39.75
|
PP = $41.54
|
|
MB = $43.62
|
Most Recent Note - 11/27/2017 3:34:33 PM
G - Its 50 DMA line ($42) and recent low ($39.79 on 11/03/17) define important near-term support to watch on pullbacks. Recent consolidation was too brief to be recognized as a valid new base. Fundamentals remain strong.
>>> FEATURED STOCK ARTICLE : Recent Consolidation Was Not a Sufficient Length New Base - 11/20/2017 |
View all notes |
Set NEW NOTE alert |
Company Profile |
SEC
News |
Chart |
Request a new note
C
A
S
I |
FIVE
-
NASDAQ
Five Below Inc
Retail-DiscountandVariety
|
$61.80
|
+0.56
0.91% |
$63.34
|
3,421,678
440.94% of 50 DAV
50 DAV is 776,000
|
$62.25
-0.72%
|
10/6/2017
|
$57.13
|
PP = $54.23
|
|
MB = $56.94
|
Most Recent Note - 11/30/2017 12:47:38 PM
G - Hitting another new all-time high with today's 3rd consecutive volume-driven gain, getting more extended from its prior base. Due to report earnings after the close today. Volume and volatility often increase near earnings news. Its 50 DMA line ($56.61) defines near-term support to watch on pullbacks.
>>> FEATURED STOCK ARTICLE : Getting Extended From Prior Base With Earnings News Due - 11/24/2017 |
View all notes |
Set NEW NOTE alert |
Company Profile |
SEC
News |
Chart |
Request a new note
C
A
S
I |
Symbol/Exchange
Company Name
Industry Group |
PRICE |
CHANGE
(%Change) |
Day High |
Volume
(% DAV)
(% 50 day avg vol) |
52 Wk Hi
% From Hi |
Featured
Date |
Price
Featured |
Pivot Featured |
|
Max Buy |
OLED
-
NASDAQ
Universal Display Corp
Elec-Misc Products
|
$181.00
|
+1.35
0.75% |
$185.20
|
1,040,804
116.81% of 50 DAV
50 DAV is 891,000
|
$192.75
-6.10%
|
8/31/2017
|
$128.22
|
PP = $127.78
|
|
MB = $134.17
|
Most Recent Note - 11/29/2017 1:00:46 PM
G - Retreating from its all-time high with today's loss on higher volume indicative of distributional pressure. Very extended from any sound base pattern. Its 50 DMA line ($149.10) and prior high in the $145 area define important near-term support to watch on pullbacks.
>>> FEATURED STOCK ARTICLE : Electronic Products Firm Perched at Record High - 11/17/2017 |
View all notes |
Set NEW NOTE alert |
Company Profile |
SEC
News |
Chart |
Request a new note
C
A
S
I |
ANET
-
NYSE
Arista Networks Inc
TELECOMMUNICATIONS - Communication Equipment
|
$233.12
|
-1.09
-0.47% |
$238.03
|
838,388
110.31% of 50 DAV
50 DAV is 760,000
|
$245.65
-5.10%
|
10/27/2017
|
$195.65
|
PP = $196.37
|
|
MB = $206.19
|
Most Recent Note - 11/29/2017 1:31:28 PM
G - Pulling back on higher volume today after getting very extended from the previously noted base. Its 50 DMA line ($203.71) and prior highs in the $196 area define near-term support to watch on pullbacks.
>>> FEATURED STOCK ARTICLE : Perched at Record High Following Volume-Driven Gains - 11/9/2017 |
View all notes |
Set NEW NOTE alert |
Company Profile |
SEC
News |
Chart |
Request a new note
C
A
S
I |
GRUB
-
NYSE
Grubhub Inc
COMPUTER SOFTWARE and SERVICES - Technical and System Software
|
$67.56
|
+1.36
2.05% |
$67.68
|
1,427,417
94.09% of 50 DAV
50 DAV is 1,517,000
|
$69.82
-3.24%
|
6/21/2017
|
$47.33
|
PP = $46.94
|
|
MB = $49.29
|
Most Recent Note - 11/28/2017 5:58:22 PM
G - It is very extended from any sound base after wedging higher with gains lacking great volume conviction. Prior highs and its 50 DMA line define support near $57. Reported Sep '17 quarterly earnings +22% on +32% sales revenues. The 2 latest quarters were below the +25% minimum earnings guideline (C criteria), raising fundamental concerns with regard to the fact-based investment system.
>>> FEATURED STOCK ARTICLE : Extended From Prior Highs After Gains on Light Volume - 11/22/2017 |
View all notes |
Set NEW NOTE alert |
Company Profile |
SEC
News |
Chart |
Request a new note
C
A
S
I |
IBP
-
NYSE
Installed Building Prod
DIVERSIFIED SERVICES - Business/Management Services
|
$77.05
|
-0.35
-0.45% |
$78.20
|
204,734
110.67% of 50 DAV
50 DAV is 185,000
|
$78.04
-1.27%
|
9/19/2017
|
$59.15
|
PP = $60.10
|
|
MB = $63.11
|
Most Recent Note - 11/27/2017 3:37:06 PM
G - Quietly perched near its all-time high, extended from any sound base. The 50 DMA line ($65) and recent low ($59.84 on 11/08/17) define important near-term support to watch on pullbacks.
>>> FEATURED STOCK ARTICLE : 50-Day Moving Average Violation Triggered Technical Sell Signal - 11/7/2017 |
View all notes |
Set NEW NOTE alert |
Company Profile |
SEC
News |
Chart |
Request a new note
C
A
S
I |
HQY
-
NASDAQ
"HealthEquity, Inc"
COMPUTER SOFTWARE and SERVICES - Healthcare Information Service
|
$51.87
|
+0.58
1.13% |
$52.76
|
400,852
96.20% of 50 DAV
50 DAV is 416,700
|
$55.31
-6.22%
|
11/6/2017
|
$54.63
|
PP = $52.87
|
|
MB = $55.51
|
Most Recent Note - 11/27/2017 6:32:32 PM
Y - Found support at its 50 DMA line ($50.11) during its consolidation. Abrupt retreat back into the prior base raised concerns after a recent breakout. Disciplined investors always limit losses by selling any stock that falls more than -7% from their purchase price. Three of the past 4 quarterly comparisons through Jul '17 were above the +25% minimum earnings guideline (C criteria).
>>> FEATURED STOCK ARTICLE : Hit New High With Big Volume-Driven Gain - 11/6/2017 |
View all notes |
Set NEW NOTE alert |
Company Profile |
SEC
News |
Chart |
Request a new note
C
A
S
I |
Symbol/Exchange
Company Name
Industry Group |
PRICE |
CHANGE
(%Change) |
Day High |
Volume
(% DAV)
(% 50 day avg vol) |
52 Wk Hi
% From Hi |
Featured
Date |
Price
Featured |
Pivot Featured |
|
Max Buy |
OLLI
-
NASDAQ
Ollie's Bargain Outlet
Retail-DiscountandVariety
|
$47.45
|
+0.10
0.21% |
$48.10
|
422,037
98.15% of 50 DAV
50 DAV is 430,000
|
$47.70
-0.52%
|
11/21/2017
|
$46.78
|
PP = $47.00
|
|
MB = $49.35
|
Most Recent Note - 11/27/2017 6:30:28 PM
Y - Stalled near the new pivot point cited based on its 10/05/17 high plus 10 cents. Subsequent gains above the pivot point backed by at least +40% above average volume may clinch a proper new (or add-on) technical buy signal. Rebounded above its 50 DMA line with convincing volume-driven gains helping its outlook to improve. Prior lows in the $41-42 area define the next important support level where further deterioration would raise more serious concerns. See the latest FSU analysis for more details and a new annotated graph.
>>> FEATURED STOCK ARTICLE : Recently Stalled After Reaching a New High - 11/27/2017 |
View all notes |
Set NEW NOTE alert |
Company Profile |
SEC
News |
Chart |
Request a new note
C
A
S
I |
HLI
-
NYSE
Houlihan Lokey Inc Cl A
Finance-Invest Bnk/Bkrs
|
$44.64
|
+0.24
0.54% |
$44.91
|
234,167
94.80% of 50 DAV
50 DAV is 247,000
|
$45.12
-1.06%
|
9/18/2017
|
$37.04
|
PP = $39.78
|
|
MB = $41.77
|
Most Recent Note - 11/27/2017 3:35:59 PM
G - Perched near its all-time high, extended from any sound base. Its 50 DMA line and prior lows define near-term support in the $41 area. On 10/26/17 it priced a Secondary Offering. Fundamentals remain strong.
>>> FEATURED STOCK ARTICLE : Holding Ground Near Record High - 11/16/2017 |
View all notes |
Set NEW NOTE alert |
Company Profile |
SEC
News |
Chart |
Request a new note
C
A
S
I |
ICHR
-
NASDAQ
Ichor Holdings Ltd
ELECTRONICS - Semiconductor Equipment
|
$28.41
|
+0.40
1.43% |
$28.91
|
1,561,193
148.12% of 50 DAV
50 DAV is 1,054,000
|
$35.51
-19.99%
|
10/10/2017
|
$29.39
|
PP = $28.36
|
|
MB = $29.78
|
Most Recent Note - 11/30/2017 6:06:37 PM
G - Violated its 50 DMA line ($29.28) with a damaging volume-driven loss on the prior session raising concerns. A rebound above the 50 DMA line is needed for its outlook to improve. Recent lows in the $26 area define the next important support level to watch where a violation would trigger a technical sell signal. See the latest FSU analysis for more details and a new annotated graph.
>>> FEATURED STOCK ARTICLE : Damaging Losses Undercutting 50-Day Average Hurt Outlook - 11/30/2017 |
View all notes |
Set NEW NOTE alert |
Company Profile |
SEC
News |
Chart |
Request a new note
C
A
S
I |
|
|
|
THESE ARE NOT BUY RECOMMENDATIONS!
Comments contained in the body of this report are technical
opinions only. The material herein has been obtained
from sources believed to be reliable and accurate, however,
its accuracy and completeness cannot be guaranteed.
This site is not an investment advisor, hence it does
not endorse or recommend any securities or other investments.
Any recommendation contained in this report may not
be suitable for all investors and it is not to be deemed
an offer or solicitation on our part with respect to
the purchase or sale of any securities. All trademarks,
service marks and trade names appearing in this report
are the property of their respective owners, and are
likewise used for identification purposes only.
This report is a service available
only to active Paid Premium Members.
You may opt-out of receiving report notifications
at any time. Questions or comments may be submitted
by writing to Premium Membership Services 665 S.E. 10 Street, Suite 201 Deerfield Beach, FL 33441-5634 or by calling 1-800-965-8307
or 954-785-1121.
|
|
|