You are not logged in.
This means you
CAN ONLY VIEW reports that were published prior to Thursday, March 20, 2025.
You
MUST UPGRADE YOUR MEMBERSHIP if you want to see any current reports.
AFTER MARKET UPDATE - TUESDAY, NOVEMBER 28TH, 2017
Previous After Market Report Next After Market Report >>>
|
|
|
|
DOW |
+255.93 |
23,836.71 |
+1.09% |
|
Volume |
833,595,590 |
+9% |
|
Volume |
1,965,233,294 |
+11% |
|
NASDAQ |
+33.84 |
6,912.36 |
+0.49% |
|
Advancers |
2,027 |
69% |
|
Advancers |
1,454 |
60% |
|
S&P 500 |
+25.63 |
2,627.05 |
+0.99% |
|
Decliners |
920 |
31% |
|
Decliners |
980 |
40% |
|
Russell 2000 |
+23.12 |
1,536.43 |
+1.53% |
|
52 Wk Highs |
215 |
|
|
52 Wk Highs |
226 |
|
|
S&P 600 |
+15.59 |
937.77 |
+1.69% |
|
52 Wk Lows |
64 |
|
|
52 Wk Lows |
44 |
|
|
 |
Leadership Expanded and Volume Increased as Major Indices Rose
Kenneth J. Gruneisen - Passed the CAN SLIM® Master's Exam
U.S Stocks finished higher Tuesday. The Dow added 255 points to 23836. The S&P 500 climbed 25 points to 2627 and the Nasdaq Composite was up 33 points to 6912. Volume totals reported were higher than the prior session totals on the NYSE and on the Nasdaq exchange. Breadth was positive as advancers led decliners by a 2-1 margin on the NYSE and 3-2 on the Nasdaq exchange. There were 102 high-ranked companies from the Leaders List that made new 52-week highs and were listed on the BreakOuts Page, versus the total of 61 on the prior session. New 52-week highs totals expanded and solidly outnumbered new 52-week lows on both the NYSE and the Nasdaq exchange. The Featured Stocks Page provides the latest analysis on noteworthy high-ranked leaders. Charts used courtesy of www.stockcharts.com
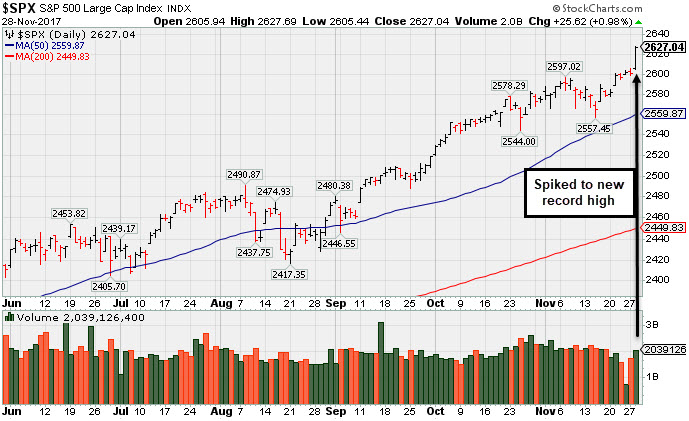 PICTURED: The S&P 500 Index spiked to a new record high on Tuesday.
The major averages (M criteria) are in a confirmed uptrend. Investors should only consider stocks meeting all key criteria of the fact-based investment system as they trigger technical buy signals.
The major averages closed at record levels as GOP lawmakers moved a step closer to completing tax reform by year end. A report from CNBC stated the Senate Budget Committee approved the Senate’s tax plan on Tuesday, which moves the bill to a floor vote on Thursday. On the data front, the Conference Board stated consumer confidence unexpectedly climbed to a 17-year high in November. In a separate release, the Case/Shiller index showed home prices rose 6.2% year-over-year in September, besting expectations. In geopolitical news, North Korea fired a missile that landed near Japanese waters marking its first provocation in over two months.
Ten of 11 S&P 500 sectors closed higher. Financials surged after Fed Chair nominee Jerome Powell stated regulations on the sector could potentially be lightened. JP Morgan Chase & Co (JPM + 3.50%) and Bank of America (BAC +3.95%) rose on positive analyst commentary. In M&A news, Emerson Electric (EMR +3.67%) after the firm withdrew its bid to buy Rockwell Automation (ROk +3.19%). In Healthcare, Regeneron Pharmaceuticals (REGN -2.28%) fell on negative analyst commentary.
Treasuries were little changed with the 10-year note yield flat at 2.33%. In commodities, NYMEX WTI crude fell 0.3% to $57.91/barrel. COMEX gold lost 0.1% to $1292.50/ounce. |
 Kenneth J. Gruneisen started out as a licensed stockbroker in August 1987, a couple of months prior to the historic stock market crash that took the Dow Jones Industrial Average down -22.6% in a single day. He has published daily fact-based fundamental and technical analysis on high-ranked stocks online for two decades. Through FACTBASEDINVESTING.COM, Kenneth provides educational articles, news, market commentary, and other information regarding proven investment systems that work in good times and bad.
Comments contained in the body of this report are technical opinions only and are not necessarily those of Gruneisen Growth Corp. The material herein has been obtained from sources believed to be reliable and accurate, however, its accuracy and completeness cannot be guaranteed. Our firm, employees, and customers may effect transactions, including transactions contrary to any recommendation herein, or have positions in the securities mentioned herein or options with respect thereto. Any recommendation contained in this report may not be suitable for all investors and it is not to be deemed an offer or solicitation on our part with respect to the purchase or sale of any securities. |
|
 |
Financial, Retail, Networking, and Energy-Linked Groups Rose
Kenneth J. Gruneisen - Passed the CAN SLIM® Master's Exam
The Broker/Dealer Index ($XBD +1.84%) and the Bank Index ($BKX +2.98%) posted solid gains on Tuesday and Retail Index ($RLX +1.02%) also rose. The tech sector was sluggish as the Biotechnology Index ($BTK -0.28%) and the Semiconductor Index ($SOX -0.08%) ended slightly lower and yet the Networking Index ($NWX +0.96%) posted a gain. Commodity-linked groups were mixed as the Integrated Oil Index ($XOI +0.84%) and the Oil Services Index ($OSX +0.58%) rose while the Gold & Silver Index ($XAU -0.41%) edged lower. Charts courtesy www.stockcharts.com
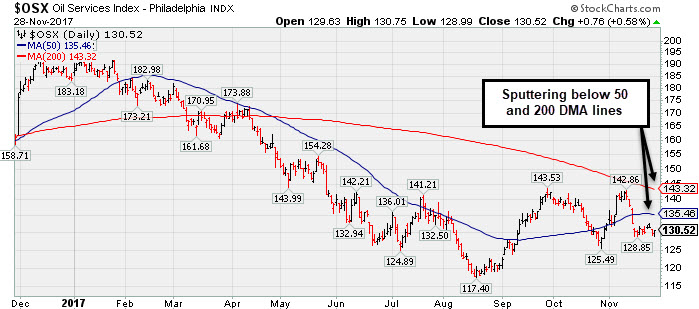 PICTURED: The Oil Services Index ($OSX +0.58%) is sputtering below its 50-day and 200-day moving average (DMA) lines.
| Oil Services |
$OSX |
130.52 |
+0.76 |
+0.59% |
-28.98% |
| Integrated Oil |
$XOI |
1,249.67 |
+10.42 |
+0.84% |
-1.44% |
| Semiconductor |
$SOX |
1,323.08 |
-1.07 |
-0.08% |
+45.96% |
| Networking |
$NWX |
496.91 |
+4.74 |
+0.96% |
+11.39% |
| Broker/Dealer |
$XBD |
253.17 |
+4.57 |
+1.84% |
+23.33% |
| Retail |
$RLX |
1,682.81 |
+17.07 |
+1.02% |
+25.30% |
| Gold & Silver |
$XAU |
81.14 |
-0.33 |
-0.41% |
+2.89% |
| Bank |
$BKX |
101.65 |
+2.95 |
+2.99% |
+10.74% |
| Biotech |
$BTK |
4,159.36 |
-11.86 |
-0.28% |
+35.26% |
|
|
|
 |
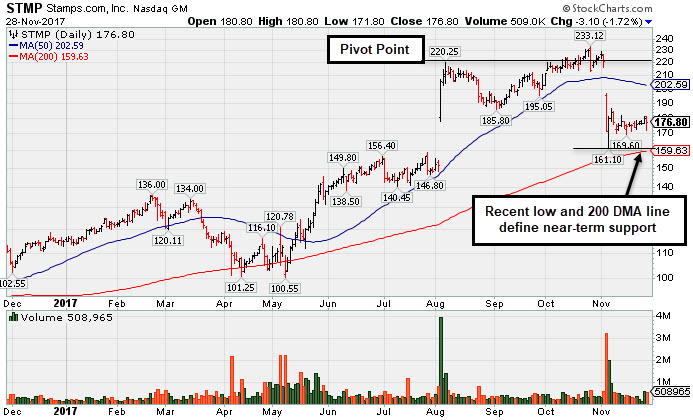
Halted Slide Above 200 DMA Line, But Additional Rebound Needed
Kenneth J. Gruneisen - Passed the CAN SLIM® Master's Exam
Stamps.Com Inc's (STMP -$3.10 or -1.72% to 176.80) Relative Strength rating has slumped to 83. It has been holding its ground above its 200-day moving average (DMA) line ($159) since a gap down on 11/03/17 for a damaging volume-driven loss. A rebound above the 50 DMA line ($202.59) is needed for its outlook to improve.
A "negative reversal" and big loss on 10/26/17 with higher volume was noted after hitting an all-time high. The damaging loss had it falling back into the prior base, raising concerns soon after a volume-driven gain above the pivot point on 10/24/17 had triggered a new (or add-on) technical buy signal. The pivot point cited was based on its 8/07/17 high plus 10 cents. It was last shown in this FSU section with an annotated graph on 11/01/17 under the headline, "Perched Near Record High Ahead of Earnings News".
Fundamentals remain strong after strong Sep '17 quarterly earnings and sales increases versus the year-ago period. It has earned an Earnings Per Share Rating of 99, putting it in the top 1% of all publicly traded stocks based on its earnings history over the past 5 years. Currently it has a Timeliness Rating of B and a Sponsorship rating of B.
The Retail - Internet group now has a 77 Relative Strength Rating. The number of top-rated funds owning its shares rose from 354 in Dec '16 to 413 in Sep '17, a reassuring sign in recent months concerning the I criteria. Its current Up/Down Volume ratio of 1.4 is an unbiased indication its shares have been under accumulation over the past 50 days. Its small supply of only 17.5 million shares outstanding (S criteria) can contribute to greater price volatility in the event of institutional buying or selling. |
|
|
Color Codes Explained :
Y - Better candidates highlighted by our
staff of experts.
G - Previously featured
in past reports as yellow but may no longer be buyable under the
guidelines.
***Last / Change / Volume data in this table is the closing quote data***
Symbol/Exchange
Company Name
Industry Group |
PRICE |
CHANGE
(%Change) |
Day High |
Volume
(% DAV)
(% 50 day avg vol) |
52 Wk Hi
% From Hi |
Featured
Date |
Price
Featured |
Pivot Featured |
|
Max Buy |
THO
-
NYSE
Thor Industries Inc
AUTOMOTIVE - Recreational Vehicles
|
$154.37
|
+18.12
13.30% |
$155.46
|
3,345,141
484.80% of 50 DAV
50 DAV is 690,000
|
$138.74
11.27%
|
8/14/2017
|
$106.67
|
PP = $110.01
|
|
MB = $115.51
|
 Most Recent Note - 11/28/2017 12:49:59 PM
G - Reported earnings +63% on +31% sales revenues for the Oct '17 quarter, continuing its strong earnings track record. Gapped up today and hit a new all-time high, getting more extended from the previously noted base. Its 50 DMA line ($129) and recent low ($127.29 on 11/08/17) define near-term support to watch.
>>> FEATURED STOCK ARTICLE : Encountered Distributional Pressure After Getting Extended From Base - 11/10/2017 |
View all notes |
Set NEW NOTE alert |
Company Profile |
SEC
News |
Chart |
Request a new note
C
A
S
I |
PFBC
-
NASDAQ
Preferred Bank Los Angls
BANKING - Regional - Pacific Banks
|
$62.13
|
+2.30
3.84% |
$62.22
|
64,758
88.35% of 50 DAV
50 DAV is 73,300
|
$66.58
-6.68%
|
10/10/2017
|
$59.38
|
PP = $59.08
|
|
MB = $62.03
|
Most Recent Note - 11/28/2017 5:53:46 PM
Y - Posted a gain today with higher (near average) volume while consolidating above its 50 DMA line ($59.43) after finding prompt support near that important short-term average.
>>> FEATURED STOCK ARTICLE : Slump Back Into Prior Base Raised Concerns - 11/8/2017 |
View all notes |
Set NEW NOTE alert |
Company Profile |
SEC
News |
Chart |
Request a new note
C
A
S
I |
AVGO
-
NASDAQ
Broadcom Limited
ELECTRONICS - Semiconductor - Broad Line
|
$277.40
|
-7.22
-2.54% |
$284.90
|
2,668,991
90.05% of 50 DAV
50 DAV is 2,964,000
|
$285.68
-2.90%
|
10/30/2017
|
$261.19
|
PP = $259.46
|
|
MB = $272.43
|
Most Recent Note - 11/27/2017 3:33:31 PM
G - Quietly hitting another new high today, getting more extended from its prior base. Found support while quietly consolidating above prior highs in the $259 area and above its 50 DMA line ($254). Fundamentals remain strong. Recently made bids to acquire Qualcomm Inc (QCOM).
>>> FEATURED STOCK ARTICLE : Consolidating Near Record High Following Volume-Driven Gains - 11/13/2017 |
View all notes |
Set NEW NOTE alert |
Company Profile |
SEC
News |
Chart |
Request a new note
C
A
S
I |
YY
-
NASDAQ
YY Inc Ads
INTERNET - Internet Service Providers
|
$111.34
|
-2.05
-1.81% |
$113.80
|
1,522,237
93.73% of 50 DAV
50 DAV is 1,624,000
|
$123.48
-9.83%
|
9/25/2017
|
$80.26
|
PP = $83.10
|
|
MB = $87.26
|
Most Recent Note - 11/27/2017 3:27:09 PM
G - Retreating from its all-time high after getting very extended from any sound base. Disciplined investors avoid chasing stocks that are extended more than +5% above a prior high or pivot point. Reported Sep '17 quarterly earnings +42% on +49% sales revenues. Prior high in the $97.59 area defines near-term support along with its 50 DMA line ($92.54).
>>> FEATURED STOCK ARTICLE : Chinese Social Media Firm Reported Earnings - 11/14/2017 |
View all notes |
Set NEW NOTE alert |
Company Profile |
SEC
News |
Chart |
Request a new note
C
A
S
I |
STMP
-
NASDAQ
Stamps.com Inc
INTERNET - Internet Software and Services
|
$176.80
|
-3.10
-1.72% |
$180.80
|
507,233
114.50% of 50 DAV
50 DAV is 443,000
|
$233.13
-24.16%
|
9/11/2017
|
$193.65
|
PP = $220.35
|
|
MB = $231.37
|
Most Recent Note - 11/28/2017 5:51:26 PM
G - Its Relative Strength rating is 83. Holding its ground above its 200 DMA line ($159) since a gap down on 11/03/17 for a damaging volume-driven loss. Fundamentals remain strong. A rebound above the 50 DMA line ($202.59) is needed for its outlook to improve. See the latest FSU analysis for more details and a new annotated graph.
>>> FEATURED STOCK ARTICLE : Halted Slide Above 200 DMA Line, But Additional Rebound Needed - 11/28/2017 |
View all notes |
Set NEW NOTE alert |
Company Profile |
SEC
News |
Chart |
Request a new note
C
A
S
I |
Symbol/Exchange
Company Name
Industry Group |
PRICE |
CHANGE
(%Change) |
Day High |
Volume
(% DAV)
(% 50 day avg vol) |
52 Wk Hi
% From Hi |
Featured
Date |
Price
Featured |
Pivot Featured |
|
Max Buy |
HTHT
-
NASDAQ
China Lodging Group Ads
LEISURE - Lodging
|
$114.48
|
-0.88
-0.76% |
$119.29
|
656,073
145.47% of 50 DAV
50 DAV is 451,000
|
$142.80
-19.83%
|
9/29/2016
|
$46.12
|
PP = $47.82
|
|
MB = $50.21
|
Most Recent Note - 11/27/2017 3:29:39 PM
G - Due to report Sep '17 quarterly earnings news, and volume and volatility often increase near earnings reports. Slumping further below its 50 DMA line ($126) with today's big loss on higher volume. Proposed a new Public Offering on 10/26/17. Earnings +19% on +18% sales revenues for the Jun '17 quarter were below the +25% minimum earnings guideline (C criteria), raising fundamental concerns.
>>> FEATURED STOCK ARTICLE : Testing 50-Day Moving Average Line After Proposed Offering - 11/2/2017 |
View all notes |
Set NEW NOTE alert |
Company Profile |
SEC
News |
Chart |
Request a new note
C
A
S
I |
LMAT
-
NASDAQ
Lemaitre Vascular Inc
Medical-Products
|
$33.87
|
+0.02
0.06% |
$34.09
|
225,979
115.89% of 50 DAV
50 DAV is 195,000
|
$39.88
-15.07%
|
7/28/2017
|
$33.50
|
PP = $33.32
|
|
MB = $34.99
|
Most Recent Note - 11/27/2017 3:30:58 PM
G - Still consolidating below its 50 DMA line. A rebound above the 50 DMA line ($35.90) is needed for its outlook to improve. Its Relative Strength rating of 85 is above the 80+ minimum guideline for buy candidates. Losses below the 200 DMA line and recent low would raise greater concerns.
>>> FEATURED STOCK ARTICLE : Halted Slide After Damaging 50-Day Moving Average Breach - 11/15/2017 |
View all notes |
Set NEW NOTE alert |
Company Profile |
SEC
News |
Chart |
Request a new note
C
A
S
I |
PATK
-
NASDAQ
Patrick Industries Inc
Bldg-Mobile/Mfg and RV
|
$97.90
|
+3.85
4.09% |
$98.15
|
215,290
265.79% of 50 DAV
50 DAV is 81,000
|
$96.75
1.19%
|
10/26/2017
|
$90.90
|
PP = $87.90
|
|
MB = $92.30
|
Most Recent Note - 11/28/2017 12:43:11 PM
G - Rallying to a new all-time high and its color code is changed to green after getting extended from its prior base. Prior highs and its 50 DMA line ($87.02) define important near-term support to watch. Fundamentals remain strong.
>>> FEATURED STOCK ARTICLE : Best Ever Close After Pullback Found Support Near Prior High - 11/21/2017 |
View all notes |
Set NEW NOTE alert |
Company Profile |
SEC
News |
Chart |
Request a new note
C
A
S
I |
ESNT
-
NYSE
Essent Group Ltd
Finance-MrtgandRel Svc
|
$45.23
|
+1.08
2.45% |
$45.34
|
997,456
112.71% of 50 DAV
50 DAV is 885,000
|
$45.23
0.00%
|
10/9/2017
|
$39.75
|
PP = $41.54
|
|
MB = $43.62
|
Most Recent Note - 11/27/2017 3:34:33 PM
G - Its 50 DMA line ($42) and recent low ($39.79 on 11/03/17) define important near-term support to watch on pullbacks. Recent consolidation was too brief to be recognized as a valid new base. Fundamentals remain strong.
>>> FEATURED STOCK ARTICLE : Recent Consolidation Was Not a Sufficient Length New Base - 11/20/2017 |
View all notes |
Set NEW NOTE alert |
Company Profile |
SEC
News |
Chart |
Request a new note
C
A
S
I |
FIVE
-
NASDAQ
Five Below Inc
Retail-DiscountandVariety
|
$60.25
|
+1.45
2.47% |
$60.47
|
1,235,078
169.42% of 50 DAV
50 DAV is 729,000
|
$60.12
0.22%
|
10/6/2017
|
$57.13
|
PP = $54.23
|
|
MB = $56.94
|
Most Recent Note - 11/28/2017 5:57:16 PM
G - Posted a big volume-driven gain today for a new all-time high, getting more extended from its prior base. Its 50 DMA line ($56.12) and prior low ($54.71 on 10/27/17) define near-term support to watch on pullbacks. Due to report earnings after the close on Thursday, November 30th. Volume and volatility often increase near earnings news.
>>> FEATURED STOCK ARTICLE : Getting Extended From Prior Base With Earnings News Due - 11/24/2017 |
View all notes |
Set NEW NOTE alert |
Company Profile |
SEC
News |
Chart |
Request a new note
C
A
S
I |
Symbol/Exchange
Company Name
Industry Group |
PRICE |
CHANGE
(%Change) |
Day High |
Volume
(% DAV)
(% 50 day avg vol) |
52 Wk Hi
% From Hi |
Featured
Date |
Price
Featured |
Pivot Featured |
|
Max Buy |
OLED
-
NASDAQ
Universal Display Corp
Elec-Misc Products
|
$186.00
|
+0.15
0.08% |
$187.85
|
823,970
92.17% of 50 DAV
50 DAV is 894,000
|
$192.75
-3.50%
|
8/31/2017
|
$128.22
|
PP = $127.78
|
|
MB = $134.17
|
Most Recent Note - 11/28/2017 6:00:31 PM
G - Hovering near its all-time high, holding its ground after getting very extended from any sound base pattern. Its 50 DMA line ($148.37) and prior high in the $145 area define important near-term support to watch on pullbacks.
>>> FEATURED STOCK ARTICLE : Electronic Products Firm Perched at Record High - 11/17/2017 |
View all notes |
Set NEW NOTE alert |
Company Profile |
SEC
News |
Chart |
Request a new note
C
A
S
I |
ANET
-
NYSE
Arista Networks Inc
TELECOMMUNICATIONS - Communication Equipment
|
$243.55
|
+4.91
2.06% |
$243.67
|
538,054
70.52% of 50 DAV
50 DAV is 763,000
|
$245.65
-0.85%
|
10/27/2017
|
$195.65
|
PP = $196.37
|
|
MB = $206.19
|
Most Recent Note - 11/28/2017 5:55:15 PM
G - Posted a quiet gain for a best-ever close today, very extended from the previously noted base. Its 50 DMA line ($202.68) and prior highs in the $196 area define near-term support to watch on pullbacks.
>>> FEATURED STOCK ARTICLE : Perched at Record High Following Volume-Driven Gains - 11/9/2017 |
View all notes |
Set NEW NOTE alert |
Company Profile |
SEC
News |
Chart |
Request a new note
C
A
S
I |
GRUB
-
NYSE
Grubhub Inc
COMPUTER SOFTWARE and SERVICES - Technical and System Software
|
$68.23
|
-0.36
-0.52% |
$68.84
|
1,438,813
92.47% of 50 DAV
50 DAV is 1,556,000
|
$69.82
-2.28%
|
6/21/2017
|
$47.33
|
PP = $46.94
|
|
MB = $49.29
|
Most Recent Note - 11/28/2017 5:58:22 PM
G - It is very extended from any sound base after wedging higher with gains lacking great volume conviction. Prior highs and its 50 DMA line define support near $57. Reported Sep '17 quarterly earnings +22% on +32% sales revenues. The 2 latest quarters were below the +25% minimum earnings guideline (C criteria), raising fundamental concerns with regard to the fact-based investment system.
>>> FEATURED STOCK ARTICLE : Extended From Prior Highs After Gains on Light Volume - 11/22/2017 |
View all notes |
Set NEW NOTE alert |
Company Profile |
SEC
News |
Chart |
Request a new note
C
A
S
I |
IBP
-
NYSE
Installed Building Prod
DIVERSIFIED SERVICES - Business/Management Services
|
$76.85
|
+2.95
3.99% |
$77.40
|
226,293
120.37% of 50 DAV
50 DAV is 188,000
|
$75.05
2.40%
|
9/19/2017
|
$59.15
|
PP = $60.10
|
|
MB = $63.11
|
Most Recent Note - 11/27/2017 3:37:06 PM
G - Quietly perched near its all-time high, extended from any sound base. The 50 DMA line ($65) and recent low ($59.84 on 11/08/17) define important near-term support to watch on pullbacks.
>>> FEATURED STOCK ARTICLE : 50-Day Moving Average Violation Triggered Technical Sell Signal - 11/7/2017 |
View all notes |
Set NEW NOTE alert |
Company Profile |
SEC
News |
Chart |
Request a new note
C
A
S
I |
HQY
-
NASDAQ
Healthequity Inc
COMPUTER SOFTWARE and SERVICES - Healthcare Information Service
|
$51.22
|
+0.42
0.83% |
$51.26
|
308,432
71.07% of 50 DAV
50 DAV is 434,000
|
$55.31
-7.39%
|
11/6/2017
|
$54.63
|
PP = $52.87
|
|
MB = $55.51
|
Most Recent Note - 11/27/2017 6:32:32 PM
Y - Found support at its 50 DMA line ($50.11) during its consolidation. Abrupt retreat back into the prior base raised concerns after a recent breakout. Disciplined investors always limit losses by selling any stock that falls more than -7% from their purchase price. Three of the past 4 quarterly comparisons through Jul '17 were above the +25% minimum earnings guideline (C criteria).
>>> FEATURED STOCK ARTICLE : Hit New High With Big Volume-Driven Gain - 11/6/2017 |
View all notes |
Set NEW NOTE alert |
Company Profile |
SEC
News |
Chart |
Request a new note
C
A
S
I |
Symbol/Exchange
Company Name
Industry Group |
PRICE |
CHANGE
(%Change) |
Day High |
Volume
(% DAV)
(% 50 day avg vol) |
52 Wk Hi
% From Hi |
Featured
Date |
Price
Featured |
Pivot Featured |
|
Max Buy |
OLLI
-
NASDAQ
Ollie's Bargain Outlet
Retail-DiscountandVariety
|
$47.10
|
+0.70
1.51% |
$47.15
|
494,636
112.67% of 50 DAV
50 DAV is 439,000
|
$47.50
-0.84%
|
11/21/2017
|
$46.78
|
PP = $47.00
|
|
MB = $49.35
|
Most Recent Note - 11/27/2017 6:30:28 PM
Y - Stalled near the new pivot point cited based on its 10/05/17 high plus 10 cents. Subsequent gains above the pivot point backed by at least +40% above average volume may clinch a proper new (or add-on) technical buy signal. Rebounded above its 50 DMA line with convincing volume-driven gains helping its outlook to improve. Prior lows in the $41-42 area define the next important support level where further deterioration would raise more serious concerns. See the latest FSU analysis for more details and a new annotated graph.
>>> FEATURED STOCK ARTICLE : Recently Stalled After Reaching a New High - 11/27/2017 |
View all notes |
Set NEW NOTE alert |
Company Profile |
SEC
News |
Chart |
Request a new note
C
A
S
I |
HLI
-
NYSE
Houlihan Lokey Inc Cl A
Finance-Invest Bnk/Bkrs
|
$44.27
|
+0.42
0.96% |
$44.31
|
116,184
46.66% of 50 DAV
50 DAV is 249,000
|
$44.49
-0.49%
|
9/18/2017
|
$37.04
|
PP = $39.78
|
|
MB = $41.77
|
Most Recent Note - 11/27/2017 3:35:59 PM
G - Perched near its all-time high, extended from any sound base. Its 50 DMA line and prior lows define near-term support in the $41 area. On 10/26/17 it priced a Secondary Offering. Fundamentals remain strong.
>>> FEATURED STOCK ARTICLE : Holding Ground Near Record High - 11/16/2017 |
View all notes |
Set NEW NOTE alert |
Company Profile |
SEC
News |
Chart |
Request a new note
C
A
S
I |
ICHR
-
NASDAQ
Ichor Holdings Ltd
ELECTRONICS - Semiconductor Equipment
|
$30.36
|
+0.20
0.66% |
$31.01
|
1,040,513
104.16% of 50 DAV
50 DAV is 999,000
|
$35.51
-14.50%
|
10/10/2017
|
$29.39
|
PP = $28.36
|
|
MB = $29.78
|
Most Recent Note - 11/27/2017 12:38:15 PM
G - Color code is changed to green after rising back above its "max buy" level. Its 50 DMA line ($29.11) and recent low ($26.07 on 11/13/17) define near-term support to watch where violations would trigger technical sell signals and raise more serious concerns.
>>> FEATURED STOCK ARTICLE : Undercut Prior Highs and Tested 50-Day Moving Average Line - 11/3/2017 |
View all notes |
Set NEW NOTE alert |
Company Profile |
SEC
News |
Chart |
Request a new note
C
A
S
I |
|
|
|
THESE ARE NOT BUY RECOMMENDATIONS!
Comments contained in the body of this report are technical
opinions only. The material herein has been obtained
from sources believed to be reliable and accurate, however,
its accuracy and completeness cannot be guaranteed.
This site is not an investment advisor, hence it does
not endorse or recommend any securities or other investments.
Any recommendation contained in this report may not
be suitable for all investors and it is not to be deemed
an offer or solicitation on our part with respect to
the purchase or sale of any securities. All trademarks,
service marks and trade names appearing in this report
are the property of their respective owners, and are
likewise used for identification purposes only.
This report is a service available
only to active Paid Premium Members.
You may opt-out of receiving report notifications
at any time. Questions or comments may be submitted
by writing to Premium Membership Services 665 S.E. 10 Street, Suite 201 Deerfield Beach, FL 33441-5634 or by calling 1-800-965-8307
or 954-785-1121.
|
|
|