***Last / Change / Volume data in this table is the closing quote data***
Symbol/Exchange
Company Name
Industry Group |
PRICE |
CHANGE
(%Change) |
Day High |
Volume
(% DAV)
(% 50 day avg vol) |
52 Wk Hi
% From Hi |
Featured
Date |
Price
Featured |
Pivot Featured |
|
Max Buy |
THO
-
NYSE
Thor Industries Inc
AUTOMOTIVE - Recreational Vehicles
|
$155.25
|
+0.88
0.57% |
$156.86
|
1,255,776
168.56% of 50 DAV
50 DAV is 745,000
|
$155.46
-0.14%
|
8/14/2017
|
$106.67
|
PP = $110.01
|
|
MB = $115.51
|
Most Recent Note - 11/28/2017 12:49:59 PM
G - Reported earnings +63% on +31% sales revenues for the Oct '17 quarter, continuing its strong earnings track record. Gapped up today and hit a new all-time high, getting more extended from the previously noted base. Its 50 DMA line ($129) and recent low ($127.29 on 11/08/17) define near-term support to watch.
>>> FEATURED STOCK ARTICLE : Encountered Distributional Pressure After Getting Extended From Base - 11/10/2017 |
View all notes |
Set NEW NOTE alert |
Company Profile |
SEC
News |
Chart |
Request a new note
C
A
S
I |
PFBC
-
NASDAQ
Preferred Bank Los Angls
BANKING - Regional - Pacific Banks
|
$64.24
|
+2.11
3.40% |
$64.88
|
172,479
233.08% of 50 DAV
50 DAV is 74,000
|
$66.58
-3.51%
|
10/10/2017
|
$59.38
|
PP = $59.08
|
|
MB = $62.03
|
Most Recent Note - 11/28/2017 5:53:46 PM
Y - Posted a gain today with higher (near average) volume while consolidating above its 50 DMA line ($59.43) after finding prompt support near that important short-term average.
>>> FEATURED STOCK ARTICLE : Slump Back Into Prior Base Raised Concerns - 11/8/2017 |
View all notes |
Set NEW NOTE alert |
Company Profile |
SEC
News |
Chart |
Request a new note
C
A
S
I |
AVGO
-
NASDAQ
Broadcom Limited
ELECTRONICS - Semiconductor - Broad Line
|
$271.50
|
-5.90
-2.13% |
$278.14
|
4,708,974
158.77% of 50 DAV
50 DAV is 2,966,000
|
$285.68
-4.96%
|
10/30/2017
|
$261.19
|
PP = $259.46
|
|
MB = $272.43
|
Most Recent Note - 11/27/2017 3:33:31 PM
G - Quietly hitting another new high today, getting more extended from its prior base. Found support while quietly consolidating above prior highs in the $259 area and above its 50 DMA line ($254). Fundamentals remain strong. Recently made bids to acquire Qualcomm Inc (QCOM).
>>> FEATURED STOCK ARTICLE : Consolidating Near Record High Following Volume-Driven Gains - 11/13/2017 |
View all notes |
Set NEW NOTE alert |
Company Profile |
SEC
News |
Chart |
Request a new note
C
A
S
I |
YY
-
NASDAQ
YY Inc Ads
INTERNET - Internet Service Providers
|
$103.58
|
-7.76
-6.97% |
$111.00
|
2,785,578
171.63% of 50 DAV
50 DAV is 1,623,000
|
$123.48
-16.12%
|
9/25/2017
|
$80.26
|
PP = $83.10
|
|
MB = $87.26
|
 Most Recent Note - 11/29/2017 1:30:23 PM
G - Prior high in the $97.59 area defines near-term support along with its 50 DMA line ($93.78). Abruptly retreating from its all-time high after getting very extended from any sound base. Fundamentals remain strong.
>>> FEATURED STOCK ARTICLE : Chinese Social Media Firm Reported Earnings - 11/14/2017 |
View all notes |
Set NEW NOTE alert |
Company Profile |
SEC
News |
Chart |
Request a new note
C
A
S
I |
STMP
-
NASDAQ
Stamps.com Inc
INTERNET - Internet Software and Services
|
$176.70
|
-0.10
-0.06% |
$177.66
|
268,304
59.89% of 50 DAV
50 DAV is 448,000
|
$233.13
-24.20%
|
9/11/2017
|
$193.65
|
PP = $220.35
|
|
MB = $231.37
|
Most Recent Note - 11/28/2017 5:51:26 PM
G - Its Relative Strength rating is 83. Holding its ground above its 200 DMA line ($159) since a gap down on 11/03/17 for a damaging volume-driven loss. Fundamentals remain strong. A rebound above the 50 DMA line ($202.59) is needed for its outlook to improve. See the latest FSU analysis for more details and a new annotated graph.
>>> FEATURED STOCK ARTICLE : Halted Slide Above 200 DMA Line, But Additional Rebound Needed - 11/28/2017 |
View all notes |
Set NEW NOTE alert |
Company Profile |
SEC
News |
Chart |
Request a new note
C
A
S
I |
Symbol/Exchange
Company Name
Industry Group |
PRICE |
CHANGE
(%Change) |
Day High |
Volume
(% DAV)
(% 50 day avg vol) |
52 Wk Hi
% From Hi |
Featured
Date |
Price
Featured |
Pivot Featured |
|
Max Buy |
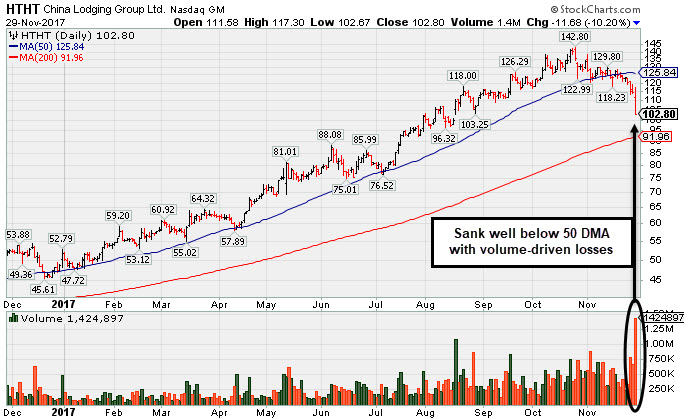
HTHT
-
NASDAQ
China Lodging Group Ads
LEISURE - Lodging
|
$102.80
|
-11.68
-10.20% |
$117.30
|
1,423,064
313.45% of 50 DAV
50 DAV is 454,000
|
$142.80
-28.01%
|
9/29/2016
|
$46.12
|
PP = $47.82
|
|
MB = $50.21
|
Most Recent Note - 11/29/2017 1:28:38 PM
G - Damaging volume-driven losses triggered technical sell signals as it slumped well below its 50 DMA line ($126). Reported Sep '17 quarterly earnings +58% on +34% sales revenues versus the year ago period, above the +25% minimum earnings guideline (C criteria). Sequential quarterly comparisons have shown encouraging sales revenues growth acceleration.
>>> FEATURED STOCK ARTICLE : Weak Technical Action Raises Concerns Despite Strong Fundamentals - 11/29/2017 |
View all notes |
Set NEW NOTE alert |
Company Profile |
SEC
News |
Chart |
Request a new note
C
A
S
I |
LMAT
-
NASDAQ
Lemaitre Vascular Inc
Medical-Products
|
$33.41
|
-0.46
-1.36% |
$34.30
|
117,649
59.78% of 50 DAV
50 DAV is 196,800
|
$39.88
-16.22%
|
7/28/2017
|
$33.50
|
PP = $33.32
|
|
MB = $34.99
|
Most Recent Note - 11/27/2017 3:30:58 PM
G - Still consolidating below its 50 DMA line. A rebound above the 50 DMA line ($35.90) is needed for its outlook to improve. Its Relative Strength rating of 85 is above the 80+ minimum guideline for buy candidates. Losses below the 200 DMA line and recent low would raise greater concerns.
>>> FEATURED STOCK ARTICLE : Halted Slide After Damaging 50-Day Moving Average Breach - 11/15/2017 |
View all notes |
Set NEW NOTE alert |
Company Profile |
SEC
News |
Chart |
Request a new note
C
A
S
I |
PATK
-
NASDAQ
Patrick Industries Inc
Bldg-Mobile/Mfg and RV
|
$98.55
|
+0.65
0.66% |
$99.00
|
92,065
110.92% of 50 DAV
50 DAV is 83,000
|
$98.15
0.41%
|
10/26/2017
|
$90.90
|
PP = $87.90
|
|
MB = $92.30
|
Most Recent Note - 11/28/2017 12:43:11 PM
G - Rallying to a new all-time high and its color code is changed to green after getting extended from its prior base. Prior highs and its 50 DMA line ($87.02) define important near-term support to watch. Fundamentals remain strong.
>>> FEATURED STOCK ARTICLE : Best Ever Close After Pullback Found Support Near Prior High - 11/21/2017 |
View all notes |
Set NEW NOTE alert |
Company Profile |
SEC
News |
Chart |
Request a new note
C
A
S
I |
ESNT
-
NYSE
Essent Group Ltd
Finance-MrtgandRel Svc
|
$44.74
|
-0.49
-1.08% |
$45.55
|
753,278
84.17% of 50 DAV
50 DAV is 895,000
|
$45.34
-1.32%
|
10/9/2017
|
$39.75
|
PP = $41.54
|
|
MB = $43.62
|
Most Recent Note - 11/27/2017 3:34:33 PM
G - Its 50 DMA line ($42) and recent low ($39.79 on 11/03/17) define important near-term support to watch on pullbacks. Recent consolidation was too brief to be recognized as a valid new base. Fundamentals remain strong.
>>> FEATURED STOCK ARTICLE : Recent Consolidation Was Not a Sufficient Length New Base - 11/20/2017 |
View all notes |
Set NEW NOTE alert |
Company Profile |
SEC
News |
Chart |
Request a new note
C
A
S
I |
FIVE
-
NASDAQ
Five Below Inc
Retail-DiscountandVariety
|
$61.24
|
+0.99
1.64% |
$62.25
|
2,052,748
275.17% of 50 DAV
50 DAV is 746,000
|
$60.47
1.27%
|
10/6/2017
|
$57.13
|
PP = $54.23
|
|
MB = $56.94
|
Most Recent Note - 11/29/2017 12:47:12 PM
G - Due to report earnings after the close on Thursday, November 30th. Volume and volatility often increase near earnings news. Hit another new all-time high today, getting more extended from its prior base. Its 50 DMA line ($56.12) and prior low ($54.71 on 10/27/17) define near-term support to watch on pullbacks.
>>> FEATURED STOCK ARTICLE : Getting Extended From Prior Base With Earnings News Due - 11/24/2017 |
View all notes |
Set NEW NOTE alert |
Company Profile |
SEC
News |
Chart |
Request a new note
C
A
S
I |
Symbol/Exchange
Company Name
Industry Group |
PRICE |
CHANGE
(%Change) |
Day High |
Volume
(% DAV)
(% 50 day avg vol) |
52 Wk Hi
% From Hi |
Featured
Date |
Price
Featured |
Pivot Featured |
|
Max Buy |
OLED
-
NASDAQ
Universal Display Corp
Elec-Misc Products
|
$179.65
|
-6.35
-3.41% |
$186.19
|
1,971,765
222.80% of 50 DAV
50 DAV is 885,000
|
$192.75
-6.80%
|
8/31/2017
|
$128.22
|
PP = $127.78
|
|
MB = $134.17
|
Most Recent Note - 11/29/2017 1:00:46 PM
G - Retreating from its all-time high with today's loss on higher volume indicative of distributional pressure. Very extended from any sound base pattern. Its 50 DMA line ($149.10) and prior high in the $145 area define important near-term support to watch on pullbacks.
>>> FEATURED STOCK ARTICLE : Electronic Products Firm Perched at Record High - 11/17/2017 |
View all notes |
Set NEW NOTE alert |
Company Profile |
SEC
News |
Chart |
Request a new note
C
A
S
I |
ANET
-
NYSE
Arista Networks Inc
TELECOMMUNICATIONS - Communication Equipment
|
$234.21
|
-9.34
-3.83% |
$244.90
|
1,208,912
160.97% of 50 DAV
50 DAV is 751,000
|
$245.65
-4.66%
|
10/27/2017
|
$195.65
|
PP = $196.37
|
|
MB = $206.19
|
Most Recent Note - 11/29/2017 1:31:28 PM
G - Pulling back on higher volume today after getting very extended from the previously noted base. Its 50 DMA line ($203.71) and prior highs in the $196 area define near-term support to watch on pullbacks.
>>> FEATURED STOCK ARTICLE : Perched at Record High Following Volume-Driven Gains - 11/9/2017 |
View all notes |
Set NEW NOTE alert |
Company Profile |
SEC
News |
Chart |
Request a new note
C
A
S
I |
GRUB
-
NYSE
Grubhub Inc
COMPUTER SOFTWARE and SERVICES - Technical and System Software
|
$66.20
|
-2.03
-2.98% |
$68.67
|
1,760,823
116.15% of 50 DAV
50 DAV is 1,516,000
|
$69.82
-5.18%
|
6/21/2017
|
$47.33
|
PP = $46.94
|
|
MB = $49.29
|
Most Recent Note - 11/28/2017 5:58:22 PM
G - It is very extended from any sound base after wedging higher with gains lacking great volume conviction. Prior highs and its 50 DMA line define support near $57. Reported Sep '17 quarterly earnings +22% on +32% sales revenues. The 2 latest quarters were below the +25% minimum earnings guideline (C criteria), raising fundamental concerns with regard to the fact-based investment system.
>>> FEATURED STOCK ARTICLE : Extended From Prior Highs After Gains on Light Volume - 11/22/2017 |
View all notes |
Set NEW NOTE alert |
Company Profile |
SEC
News |
Chart |
Request a new note
C
A
S
I |
IBP
-
NYSE
Installed Building Prod
DIVERSIFIED SERVICES - Business/Management Services
|
$77.40
|
+0.55
0.72% |
$78.04
|
193,168
102.75% of 50 DAV
50 DAV is 188,000
|
$77.40
0.00%
|
9/19/2017
|
$59.15
|
PP = $60.10
|
|
MB = $63.11
|
Most Recent Note - 11/27/2017 3:37:06 PM
G - Quietly perched near its all-time high, extended from any sound base. The 50 DMA line ($65) and recent low ($59.84 on 11/08/17) define important near-term support to watch on pullbacks.
>>> FEATURED STOCK ARTICLE : 50-Day Moving Average Violation Triggered Technical Sell Signal - 11/7/2017 |
View all notes |
Set NEW NOTE alert |
Company Profile |
SEC
News |
Chart |
Request a new note
C
A
S
I |
HQY
-
NASDAQ
"HealthEquity, Inc"
COMPUTER SOFTWARE and SERVICES - Healthcare Information Service
|
$51.29
|
+0.07
0.14% |
$52.12
|
216,304
50.02% of 50 DAV
50 DAV is 432,400
|
$55.31
-7.27%
|
11/6/2017
|
$54.63
|
PP = $52.87
|
|
MB = $55.51
|
Most Recent Note - 11/27/2017 6:32:32 PM
Y - Found support at its 50 DMA line ($50.11) during its consolidation. Abrupt retreat back into the prior base raised concerns after a recent breakout. Disciplined investors always limit losses by selling any stock that falls more than -7% from their purchase price. Three of the past 4 quarterly comparisons through Jul '17 were above the +25% minimum earnings guideline (C criteria).
>>> FEATURED STOCK ARTICLE : Hit New High With Big Volume-Driven Gain - 11/6/2017 |
View all notes |
Set NEW NOTE alert |
Company Profile |
SEC
News |
Chart |
Request a new note
C
A
S
I |
Symbol/Exchange
Company Name
Industry Group |
PRICE |
CHANGE
(%Change) |
Day High |
Volume
(% DAV)
(% 50 day avg vol) |
52 Wk Hi
% From Hi |
Featured
Date |
Price
Featured |
Pivot Featured |
|
Max Buy |
OLLI
-
NASDAQ
Ollie's Bargain Outlet
Retail-DiscountandVariety
|
$47.35
|
+0.25
0.53% |
$47.70
|
463,101
106.22% of 50 DAV
50 DAV is 436,000
|
$47.50
-0.32%
|
11/21/2017
|
$46.78
|
PP = $47.00
|
|
MB = $49.35
|
Most Recent Note - 11/27/2017 6:30:28 PM
Y - Stalled near the new pivot point cited based on its 10/05/17 high plus 10 cents. Subsequent gains above the pivot point backed by at least +40% above average volume may clinch a proper new (or add-on) technical buy signal. Rebounded above its 50 DMA line with convincing volume-driven gains helping its outlook to improve. Prior lows in the $41-42 area define the next important support level where further deterioration would raise more serious concerns. See the latest FSU analysis for more details and a new annotated graph.
>>> FEATURED STOCK ARTICLE : Recently Stalled After Reaching a New High - 11/27/2017 |
View all notes |
Set NEW NOTE alert |
Company Profile |
SEC
News |
Chart |
Request a new note
C
A
S
I |
HLI
-
NYSE
Houlihan Lokey Inc Cl A
Finance-Invest Bnk/Bkrs
|
$44.40
|
+0.13
0.29% |
$45.12
|
126,086
50.64% of 50 DAV
50 DAV is 249,000
|
$44.49
-0.20%
|
9/18/2017
|
$37.04
|
PP = $39.78
|
|
MB = $41.77
|
Most Recent Note - 11/27/2017 3:35:59 PM
G - Perched near its all-time high, extended from any sound base. Its 50 DMA line and prior lows define near-term support in the $41 area. On 10/26/17 it priced a Secondary Offering. Fundamentals remain strong.
>>> FEATURED STOCK ARTICLE : Holding Ground Near Record High - 11/16/2017 |
View all notes |
Set NEW NOTE alert |
Company Profile |
SEC
News |
Chart |
Request a new note
C
A
S
I |
ICHR
-
NASDAQ
Ichor Holdings Ltd
ELECTRONICS - Semiconductor Equipment
|
$28.01
|
-2.35
-7.74% |
$30.97
|
2,737,403
272.11% of 50 DAV
50 DAV is 1,006,000
|
$35.51
-21.12%
|
10/10/2017
|
$29.39
|
PP = $28.36
|
|
MB = $29.78
|
Most Recent Note - 11/29/2017 1:22:42 PM
G - Undercutting its 50 DMA line ($29.26) with today's volume-driven loss, raising concerns. Recent low ($26.07 on 11/13/17) defines the next important support level to watch where a violation would trigger a technical sell signal.
>>> FEATURED STOCK ARTICLE : Undercut Prior Highs and Tested 50-Day Moving Average Line - 11/3/2017 |
View all notes |
Set NEW NOTE alert |
Company Profile |
SEC
News |
Chart |
Request a new note
C
A
S
I |