You are not logged in.
This means you
CAN ONLY VIEW reports that were published prior to Thursday, March 20, 2025.
You
MUST UPGRADE YOUR MEMBERSHIP if you want to see any current reports.
AFTER MARKET UPDATE - FRIDAY, NOVEMBER 24TH, 2017
Previous After Market Report Next After Market Report >>>
|
|
|
|
DOW |
+31.81 |
23,557.99 |
+0.14% |
|
Volume |
362,946,630 |
-46% |
|
Volume |
849,928,570 |
-46% |
|
NASDAQ |
+21.80 |
6,889.16 |
+0.32% |
|
Advancers |
1,717 |
61% |
|
Advancers |
1,572 |
55% |
|
S&P 500 |
+5.34 |
2,602.42 |
+0.21% |
|
Decliners |
1,095 |
39% |
|
Decliners |
1,276 |
45% |
|
Russell 2000 |
+2.40 |
1,519.16 |
+0.16% |
|
52 Wk Highs |
166 |
|
|
52 Wk Highs |
183 |
|
|
S&P 600 |
+1.37 |
927.25 |
+0.15% |
|
52 Wk Lows |
21 |
|
|
52 Wk Lows |
28 |
|
|
 |
Major Indices Rose on Shortened Post-Thanksgiving Session
Kenneth J. Gruneisen - Passed the CAN SLIM® Master's Exam
For the week the S&P 500 gained 0.9%, the Dow climbed 0.8% and the Nasdaq added 1.5%. Stocks were higher on Friday's shortened trading session. The Dow added 31 points to 23557. The S&P 500 climbed 5 points to 2602. The Nasdaq gained 21 points to 6889. Volume totals reported were much lighter than the prior session totals on the NYSE and on the Nasdaq exchange. Breadth was positive as advancers led decliners by an 8-5 margin on the NYSE and 5-4 on the Nasdaq exchange. There were 56 high-ranked companies from the Leaders List that made new 52-week highs and were listed on the BreakOuts Page, versus the total of 81 on the prior session. New 52-week highs totals contracted yet still solidly outnumbered new 52-week lows on both the NYSE and the Nasdaq exchange. The Featured Stocks Page provides the latest analysis on noteworthy high-ranked leaders. Charts used courtesy of www.stockcharts.com
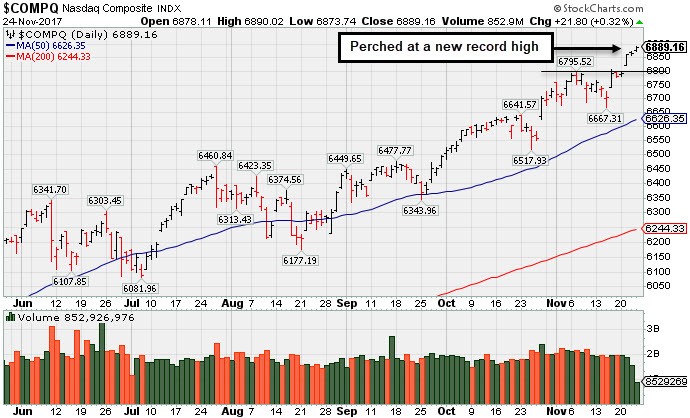 PICTURED: The Nasdaq Composite Index found support well above its 50-day moving average (DMA) line and prior high during the recent consolidation, then rallied to a new record high.
The major averages (M criteria) are in a confirmed uptrend. Investors should only consider stocks meeting all key criteria of the fact-based investment system as they trigger technical buy signals.
The major averages rebounded from consecutive weekly declines as the preliminary Black Friday sales figures reaffirmed expectations for a strong holiday season. A report from CNBC revealed as of 10 AM EST, Black Friday online sales had increased 18% from last year. On the data front today, a release from research firm Markit revealed Manufacturing PMI increased to 55.2 from 54.6 in the prior month, while activity in the services sector unexpectedly decreased to 54.7 from October’s 55.3 reading.
Seven of 11 S&P 500 sectors finished higher. Retailers were in focus today as Macy’s (M +2.13%) rose on positive analyst commentary. Amazon (AMZN +2.58%) and Kohl’s (KSS +1.03%) rose amid reports the two companies are in discussions to expand their strategic partnership. In M&A news, Qualcomm (QCOM +1.14%) rose on reports Broadcom (AVGO +2.55%) is considering raising its buyout offer.
Treasuries were lower as the yield on the 10-year note yield climbed two basis points to 2.34%. In commodities, NYMEX WTI crude was up 1.5% to $58.89/barrel, amid reports of extended production cuts from OPEC and Russia. COMEX gold fell 0.3% to $1287.70/ounce. |
 Kenneth J. Gruneisen started out as a licensed stockbroker in August 1987, a couple of months prior to the historic stock market crash that took the Dow Jones Industrial Average down -22.6% in a single day. He has published daily fact-based fundamental and technical analysis on high-ranked stocks online for two decades. Through FACTBASEDINVESTING.COM, Kenneth provides educational articles, news, market commentary, and other information regarding proven investment systems that work in good times and bad.
Comments contained in the body of this report are technical opinions only and are not necessarily those of Gruneisen Growth Corp. The material herein has been obtained from sources believed to be reliable and accurate, however, its accuracy and completeness cannot be guaranteed. Our firm, employees, and customers may effect transactions, including transactions contrary to any recommendation herein, or have positions in the securities mentioned herein or options with respect thereto. Any recommendation contained in this report may not be suitable for all investors and it is not to be deemed an offer or solicitation on our part with respect to the purchase or sale of any securities. |
|
 |
Tech and Retail Indexes Led Group Gainers
Kenneth J. Gruneisen - Passed the CAN SLIM® Master's Exam
The Retail Index ($RLX +0.75%) outpaced the Broker/Dealer Index ($XBD +0.26%) while the Bank Index ($BKX -0.28%) fell on Friday. The tech sector had a positive bias as the Biotechnology Index ($BTK +0.56%), Networking Index ($NWX +0.65%), and the Semiconductor Index ($SOX +0.95%) posted unanimous gains. Commodity-linked groups were mixed as the Integrated Oil Index ($XOI +0.32%) rose and the Oil Services Index ($OSX +0.06%) finished flat, but the Gold & Silver Index ($XAU -0.78%) fell. Charts courtesy www.stockcharts.com
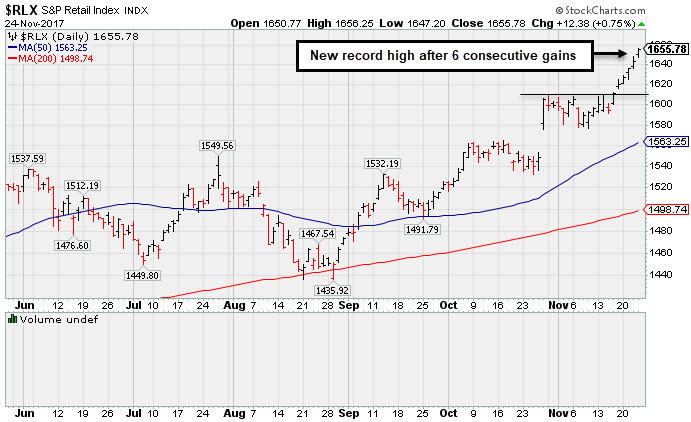 PICTURED: The Retail Index ($RLX +0.75%) is perched at a new record high after 6 consecutive gains.
| Oil Services |
$OSX |
131.64 |
+0.08 |
+0.06% |
-28.37% |
| Integrated Oil |
$XOI |
1,251.72 |
+4.00 |
+0.32% |
-1.28% |
| Semiconductor |
$SOX |
1,341.69 |
+12.59 |
+0.95% |
+48.01% |
| Networking |
$NWX |
490.59 |
+3.15 |
+0.65% |
+9.97% |
| Broker/Dealer |
$XBD |
248.44 |
+0.65 |
+0.26% |
+21.02% |
| Retail |
$RLX |
1,655.78 |
+12.38 |
+0.75% |
+23.29% |
| Gold & Silver |
$XAU |
81.11 |
-0.64 |
-0.78% |
+2.85% |
| Bank |
$BKX |
98.92 |
-0.27 |
-0.27% |
+7.77% |
| Biotech |
$BTK |
4,217.84 |
+23.67 |
+0.56% |
+37.16% |
|
|
|
 |
Getting Extended From Prior Base With Earnings News Due
Kenneth J. Gruneisen - Passed the CAN SLIM® Master's Exam
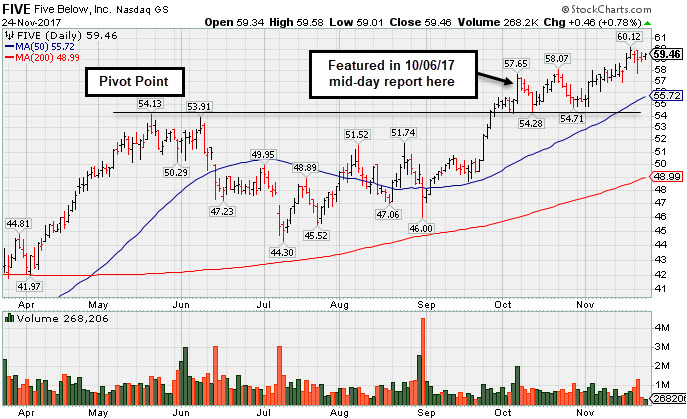
Five Below Inc (FIVE +$0.46 or +0.78% to $59.46) is perched near its all-time high, extended from its prior base. Its 50-day moving average (DMA) line ($55.72) and prior low ($54.71 on 10/27/17) define near-term support to watch on pullbacks.
FIVE was last shown in this FSU section on 10/31/17 with an annotated graph under the headline, "Prior Highs Define Important Support While Consolidating". It finished strong after highlighted in yellow with new pivot point cited based on its 5/19/17 high plus 10 cents in the 10/06/17 mid-day report (read here).
The Retail - Discount & Variety firm has a highest possible 99 Earnings Per Share Rating. It is due to report Oct '17 quarterly results after the close on Thursday, 11/30/17. Volume and volatility often increase near earnings news. It has been showing acceleration in sales revenues and earnings in sequential quarterly comparisons through Jul '17. Earnings rose +67% on +29% sales revenues for the Jul '17 quarter, and 3 of the past 4 earnings increases were above the +25% minimum guideline (C criteria), helping it better match the fact-based investment system's winning models. It has a good annual earnings (A criteria) track record.
FIVE had a choppy history since its $17 IPO in July 2012 and 3 subsequent Secondary Offerings. It has a small supply of 55.2 million shares outstanding (S criteria). Its current Timeliness Rating is A and its Sponsorship Rating is C. The number of top-rated funds owning its shares rose from 432 in Jun '16 to 472 in Sep '17, a reassuring sign concerning the I criteria. Its current Up/Down Volume Ratio of 1.6 is an unbiased indication its shares have been under slight accumulation over the past 50 days.
|
|
|
Color Codes Explained :
Y - Better candidates highlighted by our
staff of experts.
G - Previously featured
in past reports as yellow but may no longer be buyable under the
guidelines.
***Last / Change / Volume data in this table is the closing quote data***
Symbol/Exchange
Company Name
Industry Group |
PRICE |
CHANGE
(%Change) |
Day High |
Volume
(% DAV)
(% 50 day avg vol) |
52 Wk Hi
% From Hi |
Featured
Date |
Price
Featured |
Pivot Featured |
|
Max Buy |
THO
-
NYSE
Thor Industries Inc
AUTOMOTIVE - Recreational Vehicles
|
$137.07
|
+0.17
0.12% |
$137.60
|
186,734
27.54% of 50 DAV
50 DAV is 678,000
|
$138.07
-0.72%
|
8/14/2017
|
$106.67
|
PP = $110.01
|
|
MB = $115.51
|
Most Recent Note - 11/22/2017 4:07:25 PM
G - Perched within close striking distance of its all-time high, extended from the previously noted base. Its 50 DMA line ($128) and recent low ($127.29 on 11/08/17) define near-term support to watch. Fundamentals remain strong.
>>> FEATURED STOCK ARTICLE : Encountered Distributional Pressure After Getting Extended From Base - 11/10/2017 |
View all notes |
Set NEW NOTE alert |
Company Profile |
SEC
News |
Chart |
Request a new note
C
A
S
I |
PFBC
-
NASDAQ
Preferred Bank Los Angls
BANKING - Regional - Pacific Banks
|
$59.96
|
-0.56
-0.93% |
$61.23
|
17,165
22.77% of 50 DAV
50 DAV is 75,400
|
$66.58
-9.94%
|
10/10/2017
|
$59.38
|
PP = $59.08
|
|
MB = $62.03
|
Most Recent Note - 11/22/2017 3:59:51 PM
Y - Consolidating above its 50 DMA line ($58.95) after finding prompt support near that important short-term average.
>>> FEATURED STOCK ARTICLE : Slump Back Into Prior Base Raised Concerns - 11/8/2017 |
View all notes |
Set NEW NOTE alert |
Company Profile |
SEC
News |
Chart |
Request a new note
C
A
S
I |
AVGO
-
NASDAQ
Broadcom Limited
ELECTRONICS - Semiconductor - Broad Line
|
$282.38
|
+7.01
2.55% |
$282.99
|
1,156,444
37.97% of 50 DAV
50 DAV is 3,046,000
|
$281.80
0.21%
|
10/30/2017
|
$261.19
|
PP = $259.46
|
|
MB = $272.43
|
Most Recent Note - 11/20/2017 7:47:27 PM
G - Color code is changed to green after rising back above its "max buy" level with today's gain on near average volume. Found support while quietly consolidating above prior highs in the $259 area and above its 50 DMA line ($252). Fundamentals remain strong. Pulled back from its all-time high following 11/06/17 news it made a bid for Qualcomm Inc (QCOM).
>>> FEATURED STOCK ARTICLE : Consolidating Near Record High Following Volume-Driven Gains - 11/13/2017 |
View all notes |
Set NEW NOTE alert |
Company Profile |
SEC
News |
Chart |
Request a new note
C
A
S
I |
YY
-
NASDAQ
YY Inc Ads
INTERNET - Internet Service Providers
|
$120.03
|
-1.59
-1.31% |
$121.86
|
709,121
43.72% of 50 DAV
50 DAV is 1,622,000
|
$123.48
-2.79%
|
9/25/2017
|
$80.26
|
PP = $83.10
|
|
MB = $87.26
|
Most Recent Note - 11/21/2017 1:20:48 PM
G - Hitting another new all-time high with today's gain, getting very extended from any sound base. Disciplined investors avoid chasing stocks that are extended more than +5% above a prior high or pivot point. Reported Sep '17 quarterly earnings +42% on +49% sales revenues. Found support when consolidating above its 50 DMA line ($89.28).
>>> FEATURED STOCK ARTICLE : Chinese Social Media Firm Reported Earnings - 11/14/2017 |
View all notes |
Set NEW NOTE alert |
Company Profile |
SEC
News |
Chart |
Request a new note
C
A
S
I |
STMP
-
NASDAQ
Stamps.com Inc
INTERNET - Internet Software and Services
|
$176.65
|
+0.00
0.00% |
$178.40
|
91,672
20.79% of 50 DAV
50 DAV is 441,000
|
$233.13
-24.23%
|
9/11/2017
|
$193.65
|
PP = $220.35
|
|
MB = $231.37
|
Most Recent Note - 11/20/2017 7:53:28 PM
G - Its Relative Strength rating has slumped to 81. Recently holding its ground above its 200 DMA line ($158), it halted its slide since its gap down on 11/03/17 for a damaging volume-driven loss. Fundamentals remain strong. A rebound above the 50 DMA line ($204.94) is needed for its outlook to improve.
>>> FEATURED STOCK ARTICLE : Perched Near Record High Ahead of Earnings News - 11/1/2017 |
View all notes |
Set NEW NOTE alert |
Company Profile |
SEC
News |
Chart |
Request a new note
C
A
S
I |
Symbol/Exchange
Company Name
Industry Group |
PRICE |
CHANGE
(%Change) |
Day High |
Volume
(% DAV)
(% 50 day avg vol) |
52 Wk Hi
% From Hi |
Featured
Date |
Price
Featured |
Pivot Featured |
|
Max Buy |
HTHT
-
NASDAQ
China Lodging Group Ads
LEISURE - Lodging
|
$120.62
|
-2.60
-2.11% |
$122.81
|
333,240
74.55% of 50 DAV
50 DAV is 447,000
|
$142.80
-15.53%
|
9/29/2016
|
$46.12
|
PP = $47.82
|
|
MB = $50.21
|
Most Recent Note - 11/22/2017 4:02:19 PM
G - Has not formed a sound base, and recently sputtering below its 50 DMA line ($126) since proposing a new Public Offering on 10/26/17. Earnings +19% on +18% sales revenues for the Jun '17 quarter were below the +25% minimum earnings guideline (C criteria), raising fundamental concerns.
>>> FEATURED STOCK ARTICLE : Testing 50-Day Moving Average Line After Proposed Offering - 11/2/2017 |
View all notes |
Set NEW NOTE alert |
Company Profile |
SEC
News |
Chart |
Request a new note
C
A
S
I |
LMAT
-
NASDAQ
Lemaitre Vascular Inc
Medical-Products
|
$34.84
|
+0.49
1.43% |
$34.88
|
48,542
23.45% of 50 DAV
50 DAV is 207,000
|
$39.88
-12.64%
|
7/28/2017
|
$33.50
|
PP = $33.32
|
|
MB = $34.99
|
Most Recent Note - 11/22/2017 3:56:32 PM
G - A rebound above the 50 DMA line ($36.06) is needed for its outlook to improve. Its Relative Strength rating of 82 is above the 80+ minimum guideline for buy candidates. Losses below the 200 DMA line and recent low would raise greater concerns.
>>> FEATURED STOCK ARTICLE : Halted Slide After Damaging 50-Day Moving Average Breach - 11/15/2017 |
View all notes |
Set NEW NOTE alert |
Company Profile |
SEC
News |
Chart |
Request a new note
C
A
S
I |
PATK
-
NASDAQ
Patrick Industries Inc
Bldg-Mobile/Mfg and RV
|
$94.90
|
+0.70
0.74% |
$94.90
|
20,758
25.01% of 50 DAV
50 DAV is 83,000
|
$96.75
-1.91%
|
10/26/2017
|
$90.90
|
PP = $87.90
|
|
MB = $92.30
|
Most Recent Note - 11/21/2017 6:17:53 PM
Y - Posted a 4th consecutive gain today for a best-ever close. Prior highs in the $86-87 area and its 50 DMA line ($85.51) define important near-term support to watch. Fundamentals remain strong. See the latest FSU analysis for more details and a new annotated graph.
>>> FEATURED STOCK ARTICLE : Best Ever Close After Pullback Found Support Near Prior High - 11/21/2017 |
View all notes |
Set NEW NOTE alert |
Company Profile |
SEC
News |
Chart |
Request a new note
C
A
S
I |
ESNT
-
NYSE
Essent Group Ltd
Finance-MrtgandRel Svc
|
$44.66
|
-0.04
-0.09% |
$45.07
|
242,728
26.56% of 50 DAV
50 DAV is 914,000
|
$45.23
-1.26%
|
10/9/2017
|
$39.75
|
PP = $41.54
|
|
MB = $43.62
|
Most Recent Note - 11/20/2017 7:43:41 PM
G - Its 50 DMA line ($41.55) and recent low ($39.79 on 11/03/17) define important near-term support to watch on pullbacks. Recent consolidation was too brief to be recognized as a valid new base. Fundamentals remain strong. See the latest FSU analysis for more details and a new annotated graph.
>>> FEATURED STOCK ARTICLE : Recent Consolidation Was Not a Sufficient Length New Base - 11/20/2017 |
View all notes |
Set NEW NOTE alert |
Company Profile |
SEC
News |
Chart |
Request a new note
C
A
S
I |
FIVE
-
NASDAQ
Five Below Inc
Retail-DiscountandVariety
|
$59.46
|
+0.46
0.78% |
$59.58
|
289,732
39.74% of 50 DAV
50 DAV is 729,000
|
$60.12
-1.10%
|
10/6/2017
|
$57.13
|
PP = $54.23
|
|
MB = $56.94
|
 Most Recent Note - 11/24/2017 5:44:09 PM
G - Quietly hovering near its all-time high, extended from its prior base. Its 50 DMA line ($55.72) and prior low ($54.71 on 10/27/17) define near-term support to watch on pullbacks. Due to report earnings after the close on Thursday, November 30th. See the latest FSU analysis for more details and a new annotated graph.
>>> FEATURED STOCK ARTICLE : Getting Extended From Prior Base With Earnings News Due - 11/24/2017 |
View all notes |
Set NEW NOTE alert |
Company Profile |
SEC
News |
Chart |
Request a new note
C
A
S
I |
Symbol/Exchange
Company Name
Industry Group |
PRICE |
CHANGE
(%Change) |
Day High |
Volume
(% DAV)
(% 50 day avg vol) |
52 Wk Hi
% From Hi |
Featured
Date |
Price
Featured |
Pivot Featured |
|
Max Buy |
OLED
-
NASDAQ
Universal Display Corp
Elec-Misc Products
|
$190.95
|
+1.35
0.71% |
$192.75
|
517,959
58.20% of 50 DAV
50 DAV is 890,000
|
$189.90
0.55%
|
8/31/2017
|
$128.22
|
PP = $127.78
|
|
MB = $134.17
|
Most Recent Note - 11/22/2017 4:06:04 PM
G - Hit yet another new all-time high with today's 5th consecutive gain on lighter than average volume, getting very extended from any sound base pattern. Prior highs in the $145 area coincide with its 50 DMA line defining important near-term support to watch on pullbacks.
>>> FEATURED STOCK ARTICLE : Electronic Products Firm Perched at Record High - 11/17/2017 |
View all notes |
Set NEW NOTE alert |
Company Profile |
SEC
News |
Chart |
Request a new note
C
A
S
I |
ANET
-
NYSE
Arista Networks Inc
TELECOMMUNICATIONS - Communication Equipment
|
$242.06
|
+3.05
1.28% |
$243.43
|
297,383
37.83% of 50 DAV
50 DAV is 786,000
|
$245.65
-1.46%
|
10/27/2017
|
$195.65
|
PP = $196.37
|
|
MB = $206.19
|
Most Recent Note - 11/22/2017 4:04:00 PM
G - Perched at its all time high today, very extended from the previously noted base. Its 50 DMA line ($198.90) and prior highs in the $196 area define near-term support to watch on pullbacks.
>>> FEATURED STOCK ARTICLE : Perched at Record High Following Volume-Driven Gains - 11/9/2017 |
View all notes |
Set NEW NOTE alert |
Company Profile |
SEC
News |
Chart |
Request a new note
C
A
S
I |
GRUB
-
NYSE
Grubhub Inc
COMPUTER SOFTWARE and SERVICES - Technical and System Software
|
$68.58
|
+0.88
1.30% |
$69.05
|
656,142
39.77% of 50 DAV
50 DAV is 1,650,000
|
$67.84
1.09%
|
6/21/2017
|
$47.33
|
PP = $46.94
|
|
MB = $49.29
|
Most Recent Note - 11/22/2017 5:05:55 PM
G - Extended from any sound base after wedging higher with gains lacking great volume conviction. Prior highs and its 50 DMA line define support near $57. Reported Sep '17 quarterly earnings +22% on +32% sales revenues. The 2 latest quarters were below the +25% minimum earnings guideline (C criteria), raising fundamental concerns with regard to the fact-based investment system. See the latest FSU analysis for more details and a new annotated graph.
>>> FEATURED STOCK ARTICLE : Extended From Prior Highs After Gains on Light Volume - 11/22/2017 |
View all notes |
Set NEW NOTE alert |
Company Profile |
SEC
News |
Chart |
Request a new note
C
A
S
I |
IBP
-
NYSE
Installed Building Prod
DIVERSIFIED SERVICES - Business/Management Services
|
$73.40
|
-0.25
-0.34% |
$74.40
|
75,091
38.91% of 50 DAV
50 DAV is 193,000
|
$75.05
-2.20%
|
9/19/2017
|
$59.15
|
PP = $60.10
|
|
MB = $63.11
|
Most Recent Note - 11/21/2017 6:14:29 PM
G - Rallied to another new all-time high with today's 6th consecutive gain, getting more extended from any sound base. The 50 DMA line ($64.47) and recent low ($59.84 on 11/08/17) define important near-term support to watch on pullbacks.
>>> FEATURED STOCK ARTICLE : 50-Day Moving Average Violation Triggered Technical Sell Signal - 11/7/2017 |
View all notes |
Set NEW NOTE alert |
Company Profile |
SEC
News |
Chart |
Request a new note
C
A
S
I |
HQY
-
NASDAQ
"HealthEquity, Inc"
COMPUTER SOFTWARE and SERVICES - Healthcare Information Service
|
$51.50
|
+0.60
1.18% |
$51.62
|
90,654
19.36% of 50 DAV
50 DAV is 468,300
|
$55.31
-6.89%
|
11/6/2017
|
$54.63
|
PP = $52.87
|
|
MB = $55.51
|
Most Recent Note - 11/21/2017 6:16:05 PM
Y - Found prompt support at its 50 DMA line ($49.78) after abruptly retreating back into the prior base, raising concerns after a recent breakout. Disciplined investors always limit losses by selling any stock that falls more than -7% from their purchase price. Three of the past 4 quarterly comparisons through Jul '17 were above the +25% minimum earnings guideline (C criteria).
>>> FEATURED STOCK ARTICLE : Hit New High With Big Volume-Driven Gain - 11/6/2017 |
View all notes |
Set NEW NOTE alert |
Company Profile |
SEC
News |
Chart |
Request a new note
C
A
S
I |
Symbol/Exchange
Company Name
Industry Group |
PRICE |
CHANGE
(%Change) |
Day High |
Volume
(% DAV)
(% 50 day avg vol) |
52 Wk Hi
% From Hi |
Featured
Date |
Price
Featured |
Pivot Featured |
|
Max Buy |
OLLI
-
NASDAQ
Ollie's Bargain Outlet
Retail-DiscountandVariety
|
$46.40
|
-0.45
-0.96% |
$47.20
|
198,735
44.26% of 50 DAV
50 DAV is 449,000
|
$47.50
-2.32%
|
11/21/2017
|
$46.78
|
PP = $47.00
|
|
MB = $49.35
|
Most Recent Note - 11/21/2017 1:06:43 PM
Y - Color code is changed to yellow with new pivot point cited based on its 10/05/17 high plus 10 cents. A gain above the pivot point backed by at least +40% above average volume may trigger a new (or add-on) technical buy signal. Rebounded above its 50 DMA line with convincing volume-driven gains helping its outlook to improve. Prior lows in the $41-42 defines the next important support level where further deterioration would raise more serious concerns.
>>> FEATURED STOCK ARTICLE : Sell Signal Triggered by 50-Day Moving Average Violation on Higher Volume - 10/30/2017 |
View all notes |
Set NEW NOTE alert |
Company Profile |
SEC
News |
Chart |
Request a new note
C
A
S
I |
HLI
-
NYSE
Houlihan Lokey Inc Cl A
Finance-Invest Bnk/Bkrs
|
$44.31
|
+0.32
0.73% |
$44.49
|
77,911
29.18% of 50 DAV
50 DAV is 267,000
|
$44.43
-0.27%
|
9/18/2017
|
$37.04
|
PP = $39.78
|
|
MB = $41.77
|
Most Recent Note - 11/20/2017 7:51:31 PM
G - Posted a gain today on below average volume yet managed a best-ever close while challenging its all-time high. It is extended from any sound base. On 10/26/17 it priced a Secondary Offering. Fundamentals remain strong. See the latest FSU analysis for more details and an annotated graph.
>>> FEATURED STOCK ARTICLE : Holding Ground Near Record High - 11/16/2017 |
View all notes |
Set NEW NOTE alert |
Company Profile |
SEC
News |
Chart |
Request a new note
C
A
S
I |
ICHR
-
NASDAQ
Ichor Holdings Ltd
ELECTRONICS - Semiconductor Equipment
|
$29.06
|
-0.46
-1.56% |
$30.09
|
771,057
78.68% of 50 DAV
50 DAV is 980,000
|
$35.51
-18.16%
|
10/10/2017
|
$29.39
|
PP = $28.36
|
|
MB = $29.78
|
Most Recent Note - 11/22/2017 3:54:10 PM
Y - Color code is changed to yellow after slumping below its "max buy" level with today's volume-driven loss. Its 50 DMA line ($28.91) and recent low ($26.07 on 11/13/17) define near-term support to watch where violations would raise more serious concerns.
>>> FEATURED STOCK ARTICLE : Undercut Prior Highs and Tested 50-Day Moving Average Line - 11/3/2017 |
View all notes |
Set NEW NOTE alert |
Company Profile |
SEC
News |
Chart |
Request a new note
C
A
S
I |
|
|
|
THESE ARE NOT BUY RECOMMENDATIONS!
Comments contained in the body of this report are technical
opinions only. The material herein has been obtained
from sources believed to be reliable and accurate, however,
its accuracy and completeness cannot be guaranteed.
This site is not an investment advisor, hence it does
not endorse or recommend any securities or other investments.
Any recommendation contained in this report may not
be suitable for all investors and it is not to be deemed
an offer or solicitation on our part with respect to
the purchase or sale of any securities. All trademarks,
service marks and trade names appearing in this report
are the property of their respective owners, and are
likewise used for identification purposes only.
This report is a service available
only to active Paid Premium Members.
You may opt-out of receiving report notifications
at any time. Questions or comments may be submitted
by writing to Premium Membership Services 665 S.E. 10 Street, Suite 201 Deerfield Beach, FL 33441-5634 or by calling 1-800-965-8307
or 954-785-1121.
|
|
|