***Last / Change / Volume data in this table is the closing quote data***
Symbol/Exchange
Company Name
Industry Group |
PRICE |
CHANGE
(%Change) |
Day High |
Volume
(% DAV)
(% 50 day avg vol) |
52 Wk Hi
% From Hi |
Featured
Date |
Price
Featured |
Pivot Featured |
|
Max Buy |
THO
-
NYSE
Thor Industries Inc
AUTOMOTIVE - Recreational Vehicles
|
$135.16
|
+1.29
0.96% |
$136.13
|
506,110
74.32% of 50 DAV
50 DAV is 681,000
|
$138.07
-2.11%
|
8/14/2017
|
$106.67
|
PP = $110.01
|
|
MB = $115.51
|
Most Recent Note - 11/16/2017 5:43:04 PM
G - Consolidating after getting extended from the previously noted base. Its 50 DMA line ($126) and recent low ($127.29 on 11/08/17) define near-term support to watch. Fundamentals remain strong.
>>> FEATURED STOCK ARTICLE : Encountered Distributional Pressure After Getting Extended From Base - 11/10/2017 |
View all notes |
Set NEW NOTE alert |
Company Profile |
SEC
News |
Chart |
Request a new note
C
A
S
I |
PFBC
-
NASDAQ
Preferred Bank Los Angls
BANKING - Regional - Pacific Banks
|
$60.80
|
+0.83
1.38% |
$60.86
|
39,312
5.12% of 50 DAV
50 DAV is 768,000
|
$66.58
-8.68%
|
10/10/2017
|
$59.38
|
PP = $59.08
|
|
MB = $62.03
|
Most Recent Note - 11/15/2017 6:23:33 PM
Y - Consolidating above its 50 DMA line ($58.06) which has recently acted as support. Slumped below prior highs in the $60 area raising concerns while completely negating the recent breakout.
>>> FEATURED STOCK ARTICLE : Slump Back Into Prior Base Raised Concerns - 11/8/2017 |
View all notes |
Set NEW NOTE alert |
Company Profile |
SEC
News |
Chart |
Request a new note
C
A
S
I |
AVGO
-
NASDAQ
Broadcom Limited
ELECTRONICS - Semiconductor - Broad Line
|
$274.88
|
+3.02
1.11% |
$276.75
|
2,795,376
91.95% of 50 DAV
50 DAV is 3,040,000
|
$281.80
-2.46%
|
10/30/2017
|
$261.19
|
PP = $259.46
|
|
MB = $272.43
|
 Most Recent Note - 11/20/2017 7:47:27 PM
G - Color code is changed to green after rising back above its "max buy" level with today's gain on near average volume. Found support while quietly consolidating above prior highs in the $259 area and above its 50 DMA line ($252). Fundamentals remain strong. Pulled back from its all-time high following 11/06/17 news it made a bid for Qualcomm Inc (QCOM).
>>> FEATURED STOCK ARTICLE : Consolidating Near Record High Following Volume-Driven Gains - 11/13/2017 |
View all notes |
Set NEW NOTE alert |
Company Profile |
SEC
News |
Chart |
Request a new note
C
A
S
I |
YY
-
NASDAQ
YY Inc Ads
INTERNET - Internet Service Providers
|
$117.60
|
+10.37
9.67% |
$117.99
|
2,830,896
182.87% of 50 DAV
50 DAV is 1,548,000
|
$116.90
0.60%
|
9/25/2017
|
$80.26
|
PP = $83.10
|
|
MB = $87.26
|
Most Recent Note - 11/20/2017 1:54:29 PM
G - Perched at its all-time high, very extended from any sound base. Reported Sep '17 quarterly earnings +42% on +49% sales revenues. Found support when consolidating above its 50 DMA line ($89.28). Patient investors may watch for a new base or secondary buy point to possibly develop and be noted in the weeks ahead.
>>> FEATURED STOCK ARTICLE : Chinese Social Media Firm Reported Earnings - 11/14/2017 |
View all notes |
Set NEW NOTE alert |
Company Profile |
SEC
News |
Chart |
Request a new note
C
A
S
I |
STMP
-
NASDAQ
Stamps.com Inc
INTERNET - Internet Software and Services
|
$174.05
|
-1.05
-0.60% |
$177.90
|
270,700
60.97% of 50 DAV
50 DAV is 444,000
|
$233.13
-25.34%
|
9/11/2017
|
$193.65
|
PP = $220.35
|
|
MB = $231.37
|
Most Recent Note - 11/20/2017 7:53:28 PM
G - Its Relative Strength rating has slumped to 81. Recently holding its ground above its 200 DMA line ($158), it halted its slide since its gap down on 11/03/17 for a damaging volume-driven loss. Fundamentals remain strong. A rebound above the 50 DMA line ($204.94) is needed for its outlook to improve.
>>> FEATURED STOCK ARTICLE : Perched Near Record High Ahead of Earnings News - 11/1/2017 |
View all notes |
Set NEW NOTE alert |
Company Profile |
SEC
News |
Chart |
Request a new note
C
A
S
I |
Symbol/Exchange
Company Name
Industry Group |
PRICE |
CHANGE
(%Change) |
Day High |
Volume
(% DAV)
(% 50 day avg vol) |
52 Wk Hi
% From Hi |
Featured
Date |
Price
Featured |
Pivot Featured |
|
Max Buy |
HTHT
-
NASDAQ
China Lodging Group Ads
LEISURE - Lodging
|
$124.04
|
-0.59
-0.47% |
$126.61
|
286,387
64.50% of 50 DAV
50 DAV is 444,000
|
$142.80
-13.14%
|
9/29/2016
|
$46.12
|
PP = $47.82
|
|
MB = $50.21
|
Most Recent Note - 11/15/2017 12:32:39 PM
G - Has not formed a sound base and it is sputtering below its 50 DMA line ($124.98) today, still consolidating since proposing a new Public Offering on 10/26/17. Earnings +19% on +18% sales revenues for the Jun '17 quarter were below the +25% minimum earnings guideline (C criteria), raising fundamental concerns.
>>> FEATURED STOCK ARTICLE : Testing 50-Day Moving Average Line After Proposed Offering - 11/2/2017 |
View all notes |
Set NEW NOTE alert |
Company Profile |
SEC
News |
Chart |
Request a new note
C
A
S
I |
LMAT
-
NASDAQ
Lemaitre Vascular Inc
Medical-Products
|
$34.38
|
-0.18
-0.52% |
$34.87
|
157,844
76.25% of 50 DAV
50 DAV is 207,000
|
$39.88
-13.79%
|
7/28/2017
|
$33.50
|
PP = $33.32
|
|
MB = $34.99
|
Most Recent Note - 11/15/2017 6:20:32 PM
G - Its Relative Strength rating has improved to 85, above the 80+ minimum guideline for buy candidates. A rebound above the 50 DMA line ($36.39) is needed for its outlook to improve. Losses below the 200 DMA line and recent low would raise greater concerns. See the latest FSU analysis for more details and a new annotated graph.
>>> FEATURED STOCK ARTICLE : Halted Slide After Damaging 50-Day Moving Average Breach - 11/15/2017 |
View all notes |
Set NEW NOTE alert |
Company Profile |
SEC
News |
Chart |
Request a new note
C
A
S
I |
PATK
-
NASDAQ
Patrick Industries Inc
Bldg-Mobile/Mfg and RV
|
$91.70
|
+1.05
1.16% |
$91.75
|
62,333
75.10% of 50 DAV
50 DAV is 83,000
|
$96.25
-4.73%
|
10/26/2017
|
$90.90
|
PP = $87.90
|
|
MB = $92.30
|
Most Recent Note - 11/16/2017 5:51:23 PM
Y - Posted a solid gain today. Found support when recently consolidating near prior highs in the $86-87 area. Its 50 DMA line ($84.41) also defines near-term support to watch. Fundamentals remain strong.
>>> FEATURED STOCK ARTICLE : Volume 4 Times Average Behind Breakout Gain on Earnings News - 10/26/2017 |
View all notes |
Set NEW NOTE alert |
Company Profile |
SEC
News |
Chart |
Request a new note
C
A
S
I |
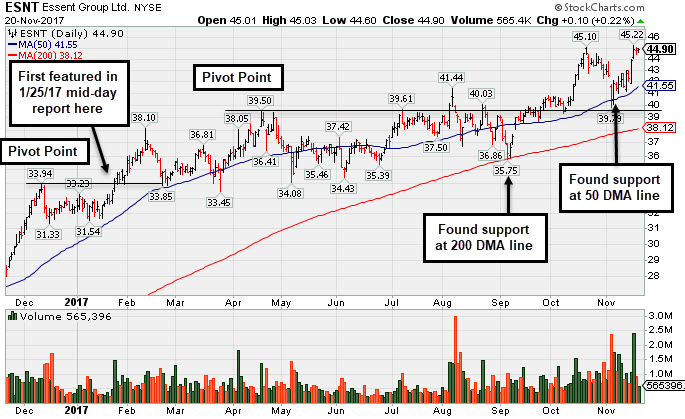
ESNT
-
NYSE
Essent Group Ltd
Finance-MrtgandRel Svc
|
$44.90
|
+0.10
0.22% |
$45.03
|
565,129
61.43% of 50 DAV
50 DAV is 920,000
|
$45.22
-0.71%
|
10/9/2017
|
$39.75
|
PP = $41.54
|
|
MB = $43.62
|
Most Recent Note - 11/20/2017 7:43:41 PM
G - Its 50 DMA line ($41.55) and recent low ($39.79 on 11/03/17) define important near-term support to watch on pullbacks. Recent consolidation was too brief to be recognized as a valid new base. Fundamentals remain strong. See the latest FSU analysis for more details and a new annotated graph.
>>> FEATURED STOCK ARTICLE : Recent Consolidation Was Not a Sufficient Length New Base - 11/20/2017 |
View all notes |
Set NEW NOTE alert |
Company Profile |
SEC
News |
Chart |
Request a new note
C
A
S
I |
FIVE
-
NASDAQ
Five Below Inc
Retail-DiscountandVariety
|
$59.49
|
-0.41
-0.68% |
$59.78
|
897,165
125.83% of 50 DAV
50 DAV is 713,000
|
$60.12
-1.05%
|
10/6/2017
|
$57.13
|
PP = $54.23
|
|
MB = $56.94
|
Most Recent Note - 11/20/2017 7:49:02 PM
G - Pulled back with higher volume today while retreating from a new all-time high. Prior highs and its 50 DMA line define near-term support in the $54-55 area.
>>> FEATURED STOCK ARTICLE : Prior Highs Define Important Support While Consolidating - 10/31/2017 |
View all notes |
Set NEW NOTE alert |
Company Profile |
SEC
News |
Chart |
Request a new note
C
A
S
I |
Symbol/Exchange
Company Name
Industry Group |
PRICE |
CHANGE
(%Change) |
Day High |
Volume
(% DAV)
(% 50 day avg vol) |
52 Wk Hi
% From Hi |
Featured
Date |
Price
Featured |
Pivot Featured |
|
Max Buy |
OLED
-
NASDAQ
Universal Display Corp
Elec-Misc Products
|
$181.50
|
+0.50
0.28% |
$184.40
|
681,170
74.85% of 50 DAV
50 DAV is 910,000
|
$182.65
-0.63%
|
8/31/2017
|
$128.22
|
PP = $127.78
|
|
MB = $134.17
|
Most Recent Note - 11/17/2017 5:47:26 PM
G - Hit another new all-time high with today's gain on light volume, very extended from any sound base pattern. Prior highs in the $145 area and its 50 DMA line ($141) define important near-term support to watch on pullbacks. See the latest FSU analysis for more details and a new annotated graph.
>>> FEATURED STOCK ARTICLE : Electronic Products Firm Perched at Record High - 11/17/2017 |
View all notes |
Set NEW NOTE alert |
Company Profile |
SEC
News |
Chart |
Request a new note
C
A
S
I |
ANET
-
NYSE
Arista Networks Inc
TELECOMMUNICATIONS - Communication Equipment
|
$241.83
|
+8.01
3.43% |
$241.95
|
720,541
93.58% of 50 DAV
50 DAV is 770,000
|
$234.63
3.07%
|
10/27/2017
|
$195.65
|
PP = $196.37
|
|
MB = $206.19
|
Most Recent Note - 11/16/2017 5:40:38 PM
G - Rallied further into new high territory today, getting very extended from the previously noted base. Prior highs in the $196 area and its 50 DMA line ($193) define near-term support to watch on pullbacks.
>>> FEATURED STOCK ARTICLE : Perched at Record High Following Volume-Driven Gains - 11/9/2017 |
View all notes |
Set NEW NOTE alert |
Company Profile |
SEC
News |
Chart |
Request a new note
C
A
S
I |
GRUB
-
NYSE
Grubhub Inc
COMPUTER SOFTWARE and SERVICES - Technical and System Software
|
$65.03
|
+0.33
0.51% |
$65.08
|
631,738
35.83% of 50 DAV
50 DAV is 1,763,000
|
$64.99
0.06%
|
6/21/2017
|
$47.33
|
PP = $46.94
|
|
MB = $49.29
|
Most Recent Note - 11/20/2017 7:49:36 PM
G - Hit yet another new all-time high today, adding to recent gains lacking great volume conviction, getting even more extended from any sound base. Reported Sep '17 quarterly earnings +22% on +32% sales revenues. The 2 latest quarters were below the +25% minimum earnings guideline (C criteria), raising fundamental concerns with regard to the fact-based investment system.
>>> FEATURED STOCK ARTICLE : Technical Strength in Popular Internet Platform - 10/27/2017 |
View all notes |
Set NEW NOTE alert |
Company Profile |
SEC
News |
Chart |
Request a new note
C
A
S
I |
IBP
-
NYSE
Installed Building Prod
DIVERSIFIED SERVICES - Business/Management Services
|
$70.40
|
+1.40
2.03% |
$70.48
|
131,224
69.80% of 50 DAV
50 DAV is 188,000
|
$70.25
0.21%
|
9/19/2017
|
$59.15
|
PP = $60.10
|
|
MB = $63.11
|
Most Recent Note - 11/14/2017 12:46:32 PM
G - Rebounded above its 50 DMA line ($63.21) helping its outlook improve. Color code is changed to green after rising back above its "max buy" level. Subsequent losses below the recent low ($59.84 on 11/08/17) would raise more serious concerns.
>>> FEATURED STOCK ARTICLE : 50-Day Moving Average Violation Triggered Technical Sell Signal - 11/7/2017 |
View all notes |
Set NEW NOTE alert |
Company Profile |
SEC
News |
Chart |
Request a new note
C
A
S
I |
HQY
-
NASDAQ
Healthequity Inc
COMPUTER SOFTWARE and SERVICES - Healthcare Information Service
|
$50.01
|
-0.16
-0.32% |
$50.39
|
280,158
58.37% of 50 DAV
50 DAV is 480,000
|
$55.31
-9.58%
|
11/6/2017
|
$54.63
|
PP = $52.87
|
|
MB = $55.51
|
Most Recent Note - 11/14/2017 5:39:28 PM
Y - Abruptly retreated back into the prior base, raising concerns after a recent breakout. Disciplined investors always limit losses by selling any stock that falls more than -7% from their purchase price. Tested and found support at its 50 DMA line ($49.23). Three of the past 4 quarterly comparisons through Jul '17 were above the +25% minimum earnings guideline (C criteria).
>>> FEATURED STOCK ARTICLE : Hit New High With Big Volume-Driven Gain - 11/6/2017 |
View all notes |
Set NEW NOTE alert |
Company Profile |
SEC
News |
Chart |
Request a new note
C
A
S
I |
Symbol/Exchange
Company Name
Industry Group |
PRICE |
CHANGE
(%Change) |
Day High |
Volume
(% DAV)
(% 50 day avg vol) |
52 Wk Hi
% From Hi |
Featured
Date |
Price
Featured |
Pivot Featured |
|
Max Buy |
OLLI
-
NASDAQ
Ollie's Bargain Outlet
Retail-DiscountandVariety
|
$46.65
|
+0.65
1.41% |
$46.78
|
639,562
145.36% of 50 DAV
50 DAV is 440,000
|
$46.90
-0.53%
|
9/8/2017
|
$45.20
|
PP = $46.18
|
|
MB = $48.49
|
Most Recent Note - 11/16/2017 5:49:39 PM
G - Rebounded near its 50 DMA line, but convincing gains above that important short-term average ($45.20) are needed for its outlook to improve. Prior low ($41.30 on 8/31/17) defines the next important support level where further deterioration would raise more serious concerns.
>>> FEATURED STOCK ARTICLE : Sell Signal Triggered by 50-Day Moving Average Violation on Higher Volume - 10/30/2017 |
View all notes |
Set NEW NOTE alert |
Company Profile |
SEC
News |
Chart |
Request a new note
C
A
S
I |
HLI
-
NYSE
Houlihan Lokey Inc Cl A
Finance-Invest Bnk/Bkrs
|
$43.42
|
+1.01
2.38% |
$43.57
|
220,663
77.70% of 50 DAV
50 DAV is 284,000
|
$44.15
-1.65%
|
9/18/2017
|
$37.04
|
PP = $39.78
|
|
MB = $41.77
|
Most Recent Note - 11/20/2017 7:51:31 PM
G - Posted a gain today on below average volume yet managed a best-ever close while challenging its all-time high. It is extended from any sound base. On 10/26/17 it priced a Secondary Offering. Fundamentals remain strong. See the latest FSU analysis for more details and an annotated graph.
>>> FEATURED STOCK ARTICLE : Holding Ground Near Record High - 11/16/2017 |
View all notes |
Set NEW NOTE alert |
Company Profile |
SEC
News |
Chart |
Request a new note
C
A
S
I |
ICHR
-
NASDAQ
Ichor Holdings Ltd
ELECTRONICS - Semiconductor Equipment
|
$30.23
|
+2.10
7.47% |
$30.41
|
1,531,229
172.44% of 50 DAV
50 DAV is 888,000
|
$35.51
-14.87%
|
10/10/2017
|
$29.39
|
PP = $28.36
|
|
MB = $29.78
|
Most Recent Note - 11/20/2017 8:09:45 PM
Y - Rebounded further above its 50 DMA line ($28.62) and back above its prior high ($29.73 on 6/09/17) with today's big volume-driven gain. Subsequent losses below the recent low ($26.07 on 11/13/17) would raise more serious concerns.
>>> FEATURED STOCK ARTICLE : Undercut Prior Highs and Tested 50-Day Moving Average Line - 11/3/2017 |
View all notes |
Set NEW NOTE alert |
Company Profile |
SEC
News |
Chart |
Request a new note
C
A
S
I |