You are not logged in.
This means you
CAN ONLY VIEW reports that were published prior to Thursday, March 20, 2025.
You
MUST UPGRADE YOUR MEMBERSHIP if you want to see any current reports.
AFTER MARKET UPDATE - MONDAY, NOVEMBER 13TH, 2017
Previous After Market Report Next After Market Report >>>
|
|
|
|
DOW |
+17.49 |
23,439.70 |
+0.07% |
|
Volume |
791,454,760 |
-7% |
|
Volume |
1,965,329,788 |
-1% |
|
NASDAQ |
+6.66 |
6,757.60 |
+0.10% |
|
Advancers |
1,285 |
44% |
|
Advancers |
1,354 |
48% |
|
S&P 500 |
+2.54 |
2,584.84 |
+0.10% |
|
Decliners |
1,641 |
56% |
|
Decliners |
1,480 |
52% |
|
Russell 2000 |
-0.21 |
1,475.07 |
-0.01% |
|
52 Wk Highs |
99 |
|
|
52 Wk Highs |
74 |
|
|
S&P 600 |
+1.27 |
895.04 |
+0.14% |
|
52 Wk Lows |
99 |
|
|
52 Wk Lows |
82 |
|
|
 |
Mergers Make Headlines as Major Indices End Slightly Higher
Kenneth J. Gruneisen - Passed the CAN SLIM® Master's Exam
Stocks finished slightly higher Monday. The Dow added 17 points to 23439. The S&P 500 climbed 2 points to 2584. The Nasdaq Composite gained 6 points to 6757. Volume totals reported were lighter than the prior session totals on the NYSE and on the Nasdaq exchange. Decliners led advancers by a 4-3 margin on the NYSE and by a narrower margin on the Nasdaq exchange. There were 37 high-ranked companies from the Leaders List that made new 52-week highs and were listed on the BreakOuts Page, versus the total of 29 on the prior session. New 52-week highs and new 52-week lows totals were even on the NYSE, but new lows outnumbered new highs on the Nasdaq exchange. The Featured Stocks Page provides the latest analysis on noteworthy high-ranked leaders. Charts used courtesy of www.stockcharts.com
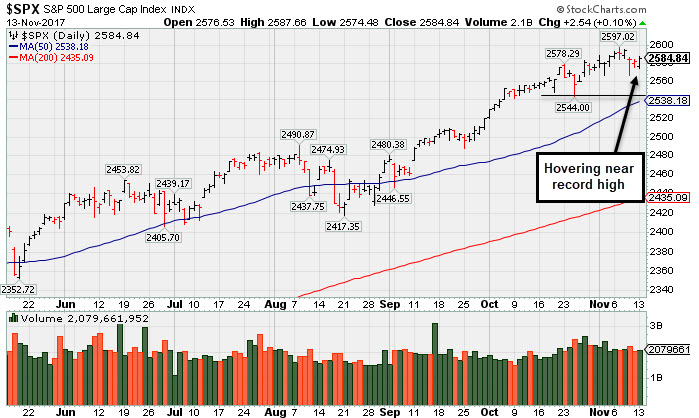 PICTURED: The S&P 500 Index is hovering near its record high, above its 50-day moving average (DMA) line and recent low defining near-term support to watch.
Leadership has recently been waning, however, the major averages (M criteria) are still in a confirmed uptrend. Investors should only consider stocks meeting all key criteria of the fact-based investment system as they trigger technical buy signals.
The major averages were little changed as investors sorted through a deluge of M&A news and awaited further updates on tax reform. A Bloomberg report stated that the markets remain concerned on the potential delay in the reduction of the corporate tax rate. On the data front, a release revealed the budget deficit widened to $63.2 billion in October, in line with expectations. Monetary policy remained in focus throughout today’s session as updates on U.S. inflation and growth figures are scheduled for later this week.
Seven of 11 S&P 500 sectors finished higher. Industrials underperformed as General Electric (GE -7.17%) fell after the company announced a 50% dividend cut. Consumer Staples outperformed as JM Smucker (SJM +2.28%) rose on positive analyst commentary. In M&A news, GGP Inc (GGP +8.33%) rose on reports Brookfield Property Partners (BPY -4.98%) made an offer to purchase the mall operator. Mattel (MAT +20.66%) rose following reports Hasbro (HAS +5.88%) made a renewed takeover offer. Qualcomm (QCOM +2.97%) rose on reports the chipmaker rejected the takeover bid from Broadcom (AVGO +0.02%).
Treasuries were little changed as the yield on the benchmark 10-year note was flat at 2.40%. In commodities, NYMEX WTI crude lost 0.1% to $56.70/barrel. COMEX gold advanced 0.3% to $1278.50/ounce. |
 Kenneth J. Gruneisen started out as a licensed stockbroker in August 1987, a couple of months prior to the historic stock market crash that took the Dow Jones Industrial Average down -22.6% in a single day. He has published daily fact-based fundamental and technical analysis on high-ranked stocks online for two decades. Through FACTBASEDINVESTING.COM, Kenneth provides educational articles, news, market commentary, and other information regarding proven investment systems that work in good times and bad.
Comments contained in the body of this report are technical opinions only and are not necessarily those of Gruneisen Growth Corp. The material herein has been obtained from sources believed to be reliable and accurate, however, its accuracy and completeness cannot be guaranteed. Our firm, employees, and customers may effect transactions, including transactions contrary to any recommendation herein, or have positions in the securities mentioned herein or options with respect thereto. Any recommendation contained in this report may not be suitable for all investors and it is not to be deemed an offer or solicitation on our part with respect to the purchase or sale of any securities. |
|
 |
Bank, Retail, Networking, and Semiconductor Indexes Rose
Kenneth J. Gruneisen - Passed the CAN SLIM® Master's Exam
The Retail Index ($RLX +0.26%) and Bank Index ($BKX +0.66%) posted modest gains while the Broker/Dealer Index ($XBD -0.03%) finished flat on Monday. The tech sector saw gains from the Networking Index ($NWX +0.89%) and the Semiconductor Index ($SOX +0.27%), but the Biotechnology Index ($BTK -0.13%) finished the session slightly in the red. The Oil Services Index ($OSX -2.02%) outpaced both the Integrated Oil Index ($XOI -0.56%) and the Gold & Silver Index ($XAU -0.23%) to the downside. Charts courtesy www.stockcharts.com
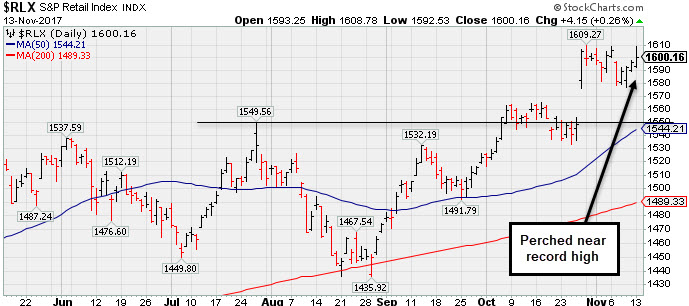 PICTURED: The Retail Index ($RLX +0.26%) has been consolidating near its record high.
| Oil Services |
$OSX |
138.12 |
-2.86 |
-2.03% |
-24.85% |
| Integrated Oil |
$XOI |
1,268.85 |
-7.18 |
-0.56% |
+0.07% |
| Semiconductor |
$SOX |
1,306.58 |
+3.52 |
+0.27% |
+44.14% |
| Networking |
$NWX |
466.07 |
+4.13 |
+0.89% |
+4.48% |
| Broker/Dealer |
$XBD |
244.77 |
-0.07 |
-0.03% |
+19.24% |
| Retail |
$RLX |
1,600.16 |
+4.15 |
+0.26% |
+19.15% |
| Gold & Silver |
$XAU |
80.42 |
-0.18 |
-0.22% |
+1.98% |
| Bank |
$BKX |
98.24 |
+0.65 |
+0.67% |
+7.03% |
| Biotech |
$BTK |
4,082.93 |
-5.13 |
-0.13% |
+32.78% |
|
|
|
 |
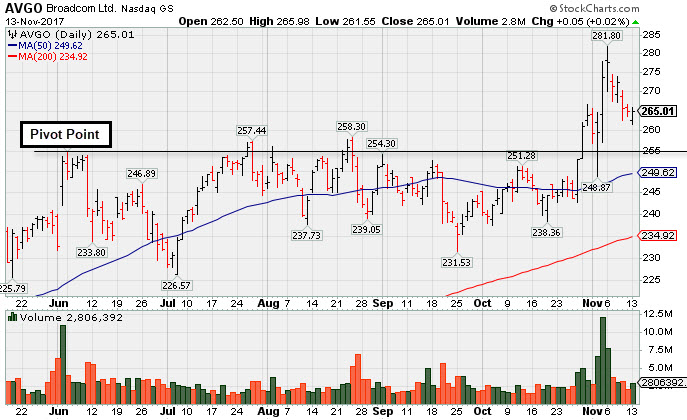
Consolidating Near Record High Following Volume-Driven Gains
Kenneth J. Gruneisen - Passed the CAN SLIM® Master's Exam
Broadcom Limited (AVGO +$0.05 or +0.02% to $265.01) is consolidating above prior highs in the $259 area defining initial support to watch above its 50-day moving average (DMA) line. It pulled back from its all-time high following 11/06/17 news it made a bid for Qualcomm Inc (QCOM).
Its current Accumulation/Distribution Rating is A-, meanwhile, it has a Timeliness Rating of A and Sponsorship Rating of B. The Jul '17 quarter marked its 5th consecutive quarterly earnings increase above the +25% minimum guideline (C criteria). Earnings rose by +29%, +38%, +51%, +46%, and +42%, respectively, in the Jul ,Oct '16, Jan, Apr, and Jul '17 quarterly comparisons versus the year ago periods. Sales revenues rose +119%, +125%, +134%, +18% and +18% during that time span. Its annual earnings (A criteria) history has been strong.
This Singapore-based Electronics - Semiconductor firm held its ground after last shown in this FSU section on 10/17/17 under the headline, "Slumped Below 50-Day Moving Average Line Again". Other leadership in the Semiconductor group has been a reassuring sign concerning the L criteria. The number of top-rated funds owning its shares rose from 2,095 in Sep '16 to 2,383 in Sep '17, a reassuring sign concerning the I criteria. Its current Up//Down Volume ratio of 1.3 is an unbiased indication its shares have been under accumulation over the past 50 days.
|
|
|
Color Codes Explained :
Y - Better candidates highlighted by our
staff of experts.
G - Previously featured
in past reports as yellow but may no longer be buyable under the
guidelines.
***Last / Change / Volume data in this table is the closing quote data***
Symbol/Exchange
Company Name
Industry Group |
PRICE |
CHANGE
(%Change) |
Day High |
Volume
(% DAV)
(% 50 day avg vol) |
52 Wk Hi
% From Hi |
Featured
Date |
Price
Featured |
Pivot Featured |
|
Max Buy |
THO
-
NYSE
Thor Industries Inc
AUTOMOTIVE - Recreational Vehicles
|
$130.45
|
+0.56
0.43% |
$131.25
|
487,410
70.74% of 50 DAV
50 DAV is 689,000
|
$138.07
-5.52%
|
8/14/2017
|
$106.67
|
PP = $110.01
|
|
MB = $115.51
|
Most Recent Note - 11/10/2017 4:58:55 PM
G - Still very extended from the previously noted base. Its 50 DMA line ($124.29) defines near-term support above prior highs in the $115 area. Fundamentals remain strong. See the latest FSU analysis for more details and a new annotated graph.
>>> FEATURED STOCK ARTICLE : Encountered Distributional Pressure After Getting Extended From Base - 11/10/2017 |
View all notes |
Set NEW NOTE alert |
Company Profile |
SEC
News |
Chart |
Request a new note
C
A
S
I |
PFBC
-
NASDAQ
Preferred Bank Los Angls
BANKING - Regional - Pacific Banks
|
$58.25
|
+0.48
0.83% |
$58.49
|
52,001
65.66% of 50 DAV
50 DAV is 79,200
|
$66.58
-12.51%
|
10/10/2017
|
$59.38
|
PP = $59.08
|
|
MB = $62.03
|
Most Recent Note - 11/8/2017 5:16:12 PM
Y - Slumped below prior highs in the $60 area raising concerns while completely negating the recent breakout. Its 50 DMA line ($57.56) defines important near-term support where a violation would raise greater concerns. See the latest FSU analysis for more details and a new annotated graph.
>>> FEATURED STOCK ARTICLE : Slump Back Into Prior Base Raised Concerns - 11/8/2017 |
View all notes |
Set NEW NOTE alert |
Company Profile |
SEC
News |
Chart |
Request a new note
C
A
S
I |
AVGO
-
NASDAQ
Broadcom Limited
ELECTRONICS - Semiconductor - Broad Line
|
$265.01
|
+0.05
0.02% |
$265.98
|
2,806,392
94.59% of 50 DAV
50 DAV is 2,967,000
|
$281.80
-5.96%
|
10/30/2017
|
$261.19
|
PP = $259.46
|
|
MB = $272.43
|
 Most Recent Note - 11/13/2017 5:17:18 PM
Y - Quietly consolidating above prior highs in the $259 area defining initial support to watch. Pulled back from its all-time high following 11/06/17 news it made a bid for Qualcomm Inc (QCOM). See the latest FSU analysis for more details and a new annotated graph.
>>> FEATURED STOCK ARTICLE : Consolidating Near Record High Following Volume-Driven Gains - 11/13/2017 |
View all notes |
Set NEW NOTE alert |
Company Profile |
SEC
News |
Chart |
Request a new note
C
A
S
I |
YY
-
NASDAQ
YY Inc Ads
INTERNET - Internet Service Providers
|
$90.60
|
+1.70
1.91% |
$90.85
|
1,100,512
85.64% of 50 DAV
50 DAV is 1,285,000
|
$97.59
-7.16%
|
9/25/2017
|
$80.26
|
PP = $83.10
|
|
MB = $87.26
|
Most Recent Note - 11/13/2017 3:49:24 PM
G - Its 50 DMA line ($86.35) and recent low define important near-term support to watch. It has not formed a base of sufficient length.
>>> FEATURED STOCK ARTICLE : Extended After Rallying From Base - 10/19/2017 |
View all notes |
Set NEW NOTE alert |
Company Profile |
SEC
News |
Chart |
Request a new note
C
A
S
I |
STMP
-
NASDAQ
Stamps.com Inc
INTERNET - Internet Software and Services
|
$178.00
|
+3.00
1.71% |
$181.70
|
406,192
92.11% of 50 DAV
50 DAV is 441,000
|
$233.13
-23.65%
|
9/11/2017
|
$193.65
|
PP = $220.35
|
|
MB = $231.37
|
Most Recent Note - 11/13/2017 3:47:05 PM
G - Holding its ground well above its 200 DMA line ($157) since its gap down on 11/03/17 for a damaging volume-driven loss. Fundamentals remain strong. A rebound above the 50 DMA line ($206.58) is needed for its outlook to improve.
>>> FEATURED STOCK ARTICLE : Perched Near Record High Ahead of Earnings News - 11/1/2017 |
View all notes |
Set NEW NOTE alert |
Company Profile |
SEC
News |
Chart |
Request a new note
C
A
S
I |
Symbol/Exchange
Company Name
Industry Group |
PRICE |
CHANGE
(%Change) |
Day High |
Volume
(% DAV)
(% 50 day avg vol) |
52 Wk Hi
% From Hi |
Featured
Date |
Price
Featured |
Pivot Featured |
|
Max Buy |
HTHT
-
NASDAQ
China Lodging Group Ads
LEISURE - Lodging
|
$128.77
|
+2.80
2.22% |
$129.80
|
329,736
77.40% of 50 DAV
50 DAV is 426,000
|
$142.80
-9.82%
|
9/29/2016
|
$46.12
|
PP = $47.82
|
|
MB = $50.21
|
Most Recent Note - 11/13/2017 3:44:19 PM
G - Found support at its 50 DMA line ($124.59) while consolidating since proposing a new Public Offering on 10/26/17. It is still extended from any sound base. Earnings +19% on +18% sales revenues for the Jun '17 quarter were below the +25% minimum earnings guideline (C criteria), raising fundamental concerns.
>>> FEATURED STOCK ARTICLE : Testing 50-Day Moving Average Line After Proposed Offering - 11/2/2017 |
View all notes |
Set NEW NOTE alert |
Company Profile |
SEC
News |
Chart |
Request a new note
C
A
S
I |
LMAT
-
NASDAQ
Lemaitre Vascular Inc
Medical-Products
|
$34.10
|
+0.60
1.79% |
$34.17
|
216,884
103.77% of 50 DAV
50 DAV is 209,000
|
$39.88
-14.49%
|
7/28/2017
|
$33.50
|
PP = $33.32
|
|
MB = $34.99
|
Most Recent Note - 11/13/2017 10:20:47 AM
G - Its Relative Strength rating has improved to 81, above the 80+ minimum guideline for buy candidates. A rebound above the 50 DMA line is needed for its outlook to improve. Losses below the 200 DMA line and recent low would raise greater concerns.
>>> FEATURED STOCK ARTICLE : Consolidating Above 50-Day Moving Average Before Earnings - 10/18/2017 |
View all notes |
Set NEW NOTE alert |
Company Profile |
SEC
News |
Chart |
Request a new note
C
A
S
I |
PATK
-
NASDAQ
Patrick Industries Inc
Bldg-Mobile/Mfg and RV
|
$87.10
|
-0.30
-0.34% |
$88.22
|
153,200
193.92% of 50 DAV
50 DAV is 79,000
|
$96.25
-9.51%
|
10/26/2017
|
$90.90
|
PP = $87.90
|
|
MB = $92.30
|
Most Recent Note - 11/13/2017 1:05:00 PM
Y - Recently consolidating near prior highs in the $86-87 area which define initial support to watch above its 50 DMA line ($83.47). Fundamentals remain strong.
>>> FEATURED STOCK ARTICLE : Volume 4 Times Average Behind Breakout Gain on Earnings News - 10/26/2017 |
View all notes |
Set NEW NOTE alert |
Company Profile |
SEC
News |
Chart |
Request a new note
C
A
S
I |
ESNT
-
NYSE
Essent Group Ltd
Finance-MrtgandRel Svc
|
$42.94
|
+1.36
3.27% |
$42.96
|
997,287
115.45% of 50 DAV
50 DAV is 863,800
|
$45.10
-4.79%
|
10/9/2017
|
$39.75
|
PP = $41.54
|
|
MB = $43.62
|
Most Recent Note - 11/13/2017 10:32:53 AM
Y - Consolidating above its 50 DMA line ($40.80) and recent low ($39.79 on 11/03/17) defining important near-term support. Relative Strength rating has slumped to 79, below the 80+ minimum guideline for buy candidates. More damaging losses would trigger a technical sell signal. Reported Sep '17 earnings +26% on +24% sales revenues.
>>> FEATURED STOCK ARTICLE : Perched Near High After Streak of Gains - 10/24/2017 |
View all notes |
Set NEW NOTE alert |
Company Profile |
SEC
News |
Chart |
Request a new note
C
A
S
I |
FIVE
-
NASDAQ
Five Below Inc
Retail-DiscountandVariety
|
$58.03
|
+0.50
0.87% |
$58.56
|
784,529
107.32% of 50 DAV
50 DAV is 731,000
|
$58.34
-0.53%
|
10/6/2017
|
$57.13
|
PP = $54.23
|
|
MB = $56.94
|
Most Recent Note - 11/13/2017 3:51:48 PM
G - Color code is changed to green after quietly rising above its "max buy" level today and hitting another new all-time high. Prior highs and its 50 DMA line define support in the $54 area.
>>> FEATURED STOCK ARTICLE : Prior Highs Define Important Support While Consolidating - 10/31/2017 |
View all notes |
Set NEW NOTE alert |
Company Profile |
SEC
News |
Chart |
Request a new note
C
A
S
I |
Symbol/Exchange
Company Name
Industry Group |
PRICE |
CHANGE
(%Change) |
Day High |
Volume
(% DAV)
(% 50 day avg vol) |
52 Wk Hi
% From Hi |
Featured
Date |
Price
Featured |
Pivot Featured |
|
Max Buy |
OLED
-
NASDAQ
Universal Display Corp
Elec-Misc Products
|
$177.05
|
+1.15
0.65% |
$178.71
|
908,216
98.19% of 50 DAV
50 DAV is 925,000
|
$176.50
0.31%
|
8/31/2017
|
$128.22
|
PP = $127.78
|
|
MB = $134.17
|
Most Recent Note - 11/10/2017 12:40:08 PM
G - Hitting yet another new high with today's 7th consecutive gain, getting very extended from a riskier "late stage" base pattern. Reported Sep '17 quarterly earnings of 28 cents per share versus a year-ago loss of 3 cents per share on sales revenues +104%. Prior highs in the $145 area and its 50 DMA line ($137) define important near-term support to watch on pullbacks.
>>> FEATURED STOCK ARTICLE : Prior Highs and 50-Day Average Define Near-Term Support - 10/25/2017 |
View all notes |
Set NEW NOTE alert |
Company Profile |
SEC
News |
Chart |
Request a new note
C
A
S
I |
ANET
-
NYSE
Arista Networks Inc
TELECOMMUNICATIONS - Communication Equipment
|
$225.15
|
+4.10
1.85% |
$227.13
|
955,168
126.68% of 50 DAV
50 DAV is 754,000
|
$221.67
1.57%
|
10/27/2017
|
$195.65
|
PP = $196.37
|
|
MB = $206.19
|
Most Recent Note - 11/10/2017 12:13:25 PM
G - Rallying further into new high territory today, getting very extended from the previously noted base. See the latest FSU analysis for more details and an annotated graph.
>>> FEATURED STOCK ARTICLE : Perched at Record High Following Volume-Driven Gains - 11/9/2017 |
View all notes |
Set NEW NOTE alert |
Company Profile |
SEC
News |
Chart |
Request a new note
C
A
S
I |
GRUB
-
NYSE
Grubhub Inc
COMPUTER SOFTWARE and SERVICES - Technical and System Software
|
$63.62
|
+0.52
0.82% |
$63.81
|
1,063,364
58.78% of 50 DAV
50 DAV is 1,809,000
|
$63.16
0.73%
|
6/21/2017
|
$47.33
|
PP = $46.94
|
|
MB = $49.29
|
Most Recent Note - 11/13/2017 3:55:16 PM
G - Hitting another new all-time high today, adding to recent gains lacking great volume conviction, getting extended from any sound base. Reported Sep '17 quarterly earnings +22% on +32% sales revenues. The 2 latest quarters were below the +25% minimum earnings guideline (C criteria), raising fundamental concerns with regard to the fact-based investment system.
>>> FEATURED STOCK ARTICLE : Technical Strength in Popular Internet Platform - 10/27/2017 |
View all notes |
Set NEW NOTE alert |
Company Profile |
SEC
News |
Chart |
Request a new note
C
A
S
I |
IBP
-
NYSE
Installed Building Prod
DIVERSIFIED SERVICES - Business/Management Services
|
$62.50
|
-0.35
-0.56% |
$63.50
|
258,134
149.21% of 50 DAV
50 DAV is 173,000
|
$70.25
-11.03%
|
9/19/2017
|
$59.15
|
PP = $60.10
|
|
MB = $63.11
|
Most Recent Note - 11/13/2017 12:47:01 PM
Y - Prior highs in the $60 area acted as important near-term support and its color code is changed to yellow. Losses below the recent low ($59.84 on 11/08/17) would raise greater concerns. Trading near its 50 DMA line ($62.99) today after damaging losses last week triggered a technical sell signal.
>>> FEATURED STOCK ARTICLE : 50-Day Moving Average Violation Triggered Technical Sell Signal - 11/7/2017 |
View all notes |
Set NEW NOTE alert |
Company Profile |
SEC
News |
Chart |
Request a new note
C
A
S
I |
HQY
-
NASDAQ
"HealthEquity, Inc"
COMPUTER SOFTWARE and SERVICES - Healthcare Information Service
|
$50.05
|
+0.31
0.62% |
$50.51
|
223,617
40.96% of 50 DAV
50 DAV is 546,000
|
$55.31
-9.51%
|
11/6/2017
|
$54.63
|
PP = $52.87
|
|
MB = $55.51
|
Most Recent Note - 11/7/2017 1:51:28 PM
Y - Abruptly retreating back into the prior base with today's volume-driven loss, raising concerns. Disciplined investors always limit losses by selling any stock that falls more than -7% from their purchase price. Highlighted in yellow with new pivot point cited based on its 10/04/17 high in the 11/06/17 mid-day report as it hit a new high with a considerable volume-driven gain triggering a technical buy signal. Recently tested and found support after rebounding above its 50 DMA line ($48.42). Three of the past 4 quarterly comparisons through Jul '17 were above the +25% minimum earnings guideline (C criteria). See the latest FSU analysis for more details and an annotated graph.
>>> FEATURED STOCK ARTICLE : Hit New High With Big Volume-Driven Gain - 11/6/2017 |
View all notes |
Set NEW NOTE alert |
Company Profile |
SEC
News |
Chart |
Request a new note
C
A
S
I |
Symbol/Exchange
Company Name
Industry Group |
PRICE |
CHANGE
(%Change) |
Day High |
Volume
(% DAV)
(% 50 day avg vol) |
52 Wk Hi
% From Hi |
Featured
Date |
Price
Featured |
Pivot Featured |
|
Max Buy |
OLLI
-
NASDAQ
Ollie's Bargain Outlet
Retail-DiscountandVariety
|
$45.15
|
+0.20
0.44% |
$45.35
|
370,510
81.61% of 50 DAV
50 DAV is 454,000
|
$46.90
-3.73%
|
9/8/2017
|
$45.20
|
PP = $46.18
|
|
MB = $48.49
|
Most Recent Note - 11/7/2017 2:01:30 PM
G - Slumping further below its 50 DMA line ($45.05) line with today's loss on light volume. A rebound above the 50 DMA line is needed for its outlook to improve. Prior low ($41.30 on 8/31/17) defines the next important support level where further deterioration would raise more serious concerns.
>>> FEATURED STOCK ARTICLE : Sell Signal Triggered by 50-Day Moving Average Violation on Higher Volume - 10/30/2017 |
View all notes |
Set NEW NOTE alert |
Company Profile |
SEC
News |
Chart |
Request a new note
C
A
S
I |
HLI
-
NYSE
Houlihan Lokey Inc Cl A
Finance-Invest Bnk/Bkrs
|
$42.09
|
+0.31
0.74% |
$42.90
|
344,180
121.19% of 50 DAV
50 DAV is 284,000
|
$44.15
-4.67%
|
9/18/2017
|
$37.04
|
PP = $39.78
|
|
MB = $41.77
|
Most Recent Note - 11/7/2017 4:02:51 PM
Y - Color code is changed to yellow while quietly consolidating below its "max buy" level. On 10/26/17 it priced a Secondary Offering, and abruptly retreated from its all-time high. Such offerings typically hinder price performance for a short time, yet they also help to attract new or greater institutional interest (I criteria). Reported earnings +51% on +30% sales revenues for its second quarter ended September 30th versus the year-ago period.
>>> FEATURED STOCK ARTICLE : Recent Gains Lacked Volume; Earnings Report Due Soon - 10/23/2017 |
View all notes |
Set NEW NOTE alert |
Company Profile |
SEC
News |
Chart |
Request a new note
C
A
S
I |
ICHR
-
NASDAQ
Ichor Holdings Ltd
ELECTRONICS - Semiconductor Equipment
|
$28.98
|
+1.00
3.57% |
$29.45
|
2,005,445
262.49% of 50 DAV
50 DAV is 764,000
|
$35.51
-18.39%
|
10/10/2017
|
$29.39
|
PP = $28.36
|
|
MB = $29.78
|
Most Recent Note - 11/13/2017 10:17:54 AM
G - Color code is changed to green after violating its 50 DMA line ($28.03) with today's gap down and 4th consecutive loss raising greater concerns. Only a prompt rebound above the 50 DMA line would help its outlook improve.
>>> FEATURED STOCK ARTICLE : Undercut Prior Highs and Tested 50-Day Moving Average Line - 11/3/2017 |
View all notes |
Set NEW NOTE alert |
Company Profile |
SEC
News |
Chart |
Request a new note
C
A
S
I |
|
|
|
THESE ARE NOT BUY RECOMMENDATIONS!
Comments contained in the body of this report are technical
opinions only. The material herein has been obtained
from sources believed to be reliable and accurate, however,
its accuracy and completeness cannot be guaranteed.
This site is not an investment advisor, hence it does
not endorse or recommend any securities or other investments.
Any recommendation contained in this report may not
be suitable for all investors and it is not to be deemed
an offer or solicitation on our part with respect to
the purchase or sale of any securities. All trademarks,
service marks and trade names appearing in this report
are the property of their respective owners, and are
likewise used for identification purposes only.
This report is a service available
only to active Paid Premium Members.
You may opt-out of receiving report notifications
at any time. Questions or comments may be submitted
by writing to Premium Membership Services 665 S.E. 10 Street, Suite 201 Deerfield Beach, FL 33441-5634 or by calling 1-800-965-8307
or 954-785-1121.
|
|
|