You are not logged in.
This means you
CAN ONLY VIEW reports that were published prior to Monday, April 14, 2025.
You
MUST UPGRADE YOUR MEMBERSHIP if you want to see any current reports.
AFTER MARKET UPDATE - FRIDAY, DECEMBER 1ST, 2017
Previous After Market Report Next After Market Report >>>
|
|
|
|
DOW |
-40.76 |
24,231.59 |
-0.17% |
|
Volume |
971,750,050 |
-36% |
|
Volume |
2,306,466,920 |
-7% |
|
NASDAQ |
-26.38 |
6,847.59 |
-0.38% |
|
Advancers |
1,538 |
52% |
|
Advancers |
1,048 |
55% |
|
S&P 500 |
-5.36 |
2,642.22 |
-0.20% |
|
Decliners |
1,444 |
48% |
|
Decliners |
851 |
45% |
|
Russell 2000 |
-7.12 |
1,537.02 |
-0.46% |
|
52 Wk Highs |
151 |
|
|
52 Wk Highs |
103 |
|
|
S&P 600 |
-5.63 |
937.31 |
-0.60% |
|
52 Wk Lows |
31 |
|
|
52 Wk Lows |
43 |
|
|
 |
Mixed Session and Week as Indices Pulled Back From Record Highs
Kenneth J. Gruneisen - Passed the CAN SLIM® Master's Exam
For the week, the Dow gained 2.9 %, the S&P added 1.5 % and the Nasdaq fell 0.6%. U.S. equities finished lower Friday. The Dow was down 40 points to 24,231. The S&P 500 lost 5 points to 2642 and the Nasdaq Composite fell 26 points to 6847. Volume totals reported were lighter than the prior session totals on the NYSE and on the Nasdaq exchange. Advancers led decliners by a narrow margin on the NYSE and also on the Nasdaq exchange. There were 41 high-ranked companies from the Leaders List that made new 52-week highs and were listed on the BreakOuts Page, versus the total of 127 on the prior session. New 52-week highs totals contracted yet solidly outnumbered new 52-week lows on both the NYSE and the Nasdaq exchange. The Featured Stocks Page provides the latest analysis on noteworthy high-ranked leaders. Charts used courtesy of www.stockcharts.com
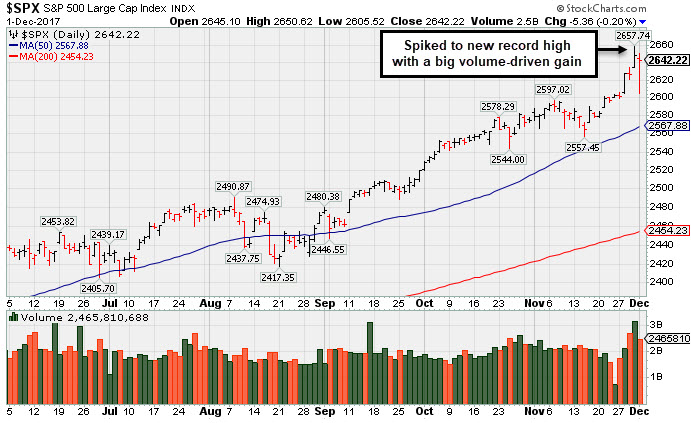 PICTURED: The S&P 500 Index pulled back on Friday after spiking to a new record high with a big volume-driven gain on the prior session.
The major averages (M criteria) are in a confirmed uptrend. Investors should only consider stocks meeting all key criteria of the fact-based investment system as they trigger technical buy signals.
The major averages started December in negative territory amid new revelations in Special Prosecutor Robert Mueller’s investigation into the 2016 election. In tax reform news, Senate Republicans announced they have secured the required number of votes to pass their tax bill and anticipate a vote taking place late Friday evening. On the data front, The Institute for Supply Management said the pace of manufacturing activity eased slightly in November but remains near the highest levels since 2004. Another report showed construction spending unexpectedly rose 1.4% in October.
Energy was the top performing S&P 500 sector on Friday. Shares of Apache Corp (APA +5.71%) and Baker Hughes (BHGE +3.26%) rose in sympathy with higher oil prices. Industrials paced losses as Boeing (BA -1.96%) fell. In other news, Mylan (MYL -4.35%) fell on reports Amazon (AMZN -1.22%) held discussions with the generic drug maker about potentially entering the pharmaceutical market.
Treasuries were firmly higher with the yield of the 10-year note down five basis points to 2.36%. In commodities, NYMEX WTI crude climbed 1.5 % to $58.23/barrel. COMEX gold was up 0.5% to $1283.00/ounce. |
 Kenneth J. Gruneisen started out as a licensed stockbroker in August 1987, a couple of months prior to the historic stock market crash that took the Dow Jones Industrial Average down -22.6% in a single day. He has published daily fact-based fundamental and technical analysis on high-ranked stocks online for two decades. Through FACTBASEDINVESTING.COM, Kenneth provides educational articles, news, market commentary, and other information regarding proven investment systems that work in good times and bad.
Comments contained in the body of this report are technical opinions only and are not necessarily those of Gruneisen Growth Corp. The material herein has been obtained from sources believed to be reliable and accurate, however, its accuracy and completeness cannot be guaranteed. Our firm, employees, and customers may effect transactions, including transactions contrary to any recommendation herein, or have positions in the securities mentioned herein or options with respect thereto. Any recommendation contained in this report may not be suitable for all investors and it is not to be deemed an offer or solicitation on our part with respect to the purchase or sale of any securities. |
|
 |
Oil Services Index Posted a Standout Gain on Friday
Kenneth J. Gruneisen - Passed the CAN SLIM® Master's Exam
The Retail Index ($RLX -0.47%) fell while the Bank Index ($BKX +0.10%) held its ground and the Broker/Dealer Index ($XBD +0.65%) edged higher on Friday. The tech sector was led lower by the Semiconductor Index ($SOX -1.09%) and Networking Index ($NWX -0.65%) while the Biotechnology Index ($BTK +0.17%) eked out a tiny gain. Commodity-linked groups had a slightly positive bias as the Oil Services Index ($OSX +3.62%) posted a solid gain and the Integrated Oil Index ($XOI +0.39%) and Gold & Silver Index ($XAU +0.30%) both edged higher. Charts courtesy www.stockcharts.com
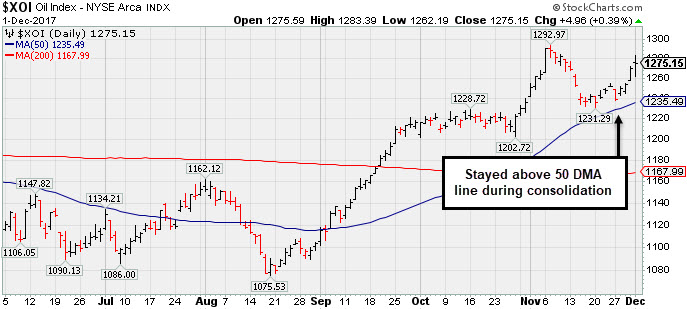 PICTURED: The Integrated Oil Index ($XOI +0.39%) stayed above its 50-day moving average (DMA) line during the recent consolidation.
| Oil Services |
$OSX |
137.90 |
+4.35 |
+3.26% |
-24.97% |
| Integrated Oil |
$XOI |
1,275.15 |
+4.96 |
+0.39% |
+0.56% |
| Semiconductor |
$SOX |
1,258.65 |
-13.90 |
-1.09% |
+38.85% |
| Networking |
$NWX |
493.73 |
-3.23 |
-0.65% |
+10.68% |
| Broker/Dealer |
$XBD |
259.73 |
+1.68 |
+0.65% |
+26.53% |
| Retail |
$RLX |
1,680.51 |
-7.89 |
-0.47% |
+25.13% |
| Gold & Silver |
$XAU |
79.66 |
+0.24 |
+0.30% |
+1.01% |
| Bank |
$BKX |
104.68 |
+0.11 |
+0.11% |
+14.04% |
| Biotech |
$BTK |
4,255.89 |
+7.31 |
+0.17% |
+38.40% |
|
|
|
 |
Extended From Any Sound Base After Impressive Rebound and Rally
Kenneth J. Gruneisen - Passed the CAN SLIM® Master's Exam
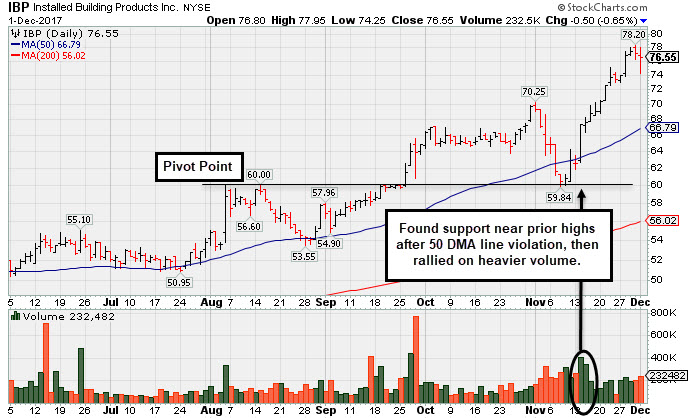
Installed Building Products' (IBP -$0.50 or -0.65% to $76.55) is quietly perched near its all-time high, extended from any sound base. The 50-day moving average (DMA) line ($65) and recent low ($59.84 on 11/08/17) define important near-term support to watch on pullbacks.
IBP was last shown in this FSU section on 11/07/17 with an annotated graph under the headline, "50-Day Moving Average Violation Triggered Technical Sell Signal". It found support near the prior high in the $60 area, an old resistance level, then it rallied with even heavier volume and made it into new high territory without forming a sound base pattern.
IBP traded up as much as +74.4% since first highlighted in the 2/27/17 mid-day report in yellow with pivot point cited based on its 12/08/16 high plus 10 cents (read here). Fundamentals remain strong after reporting earnings +30% on +31% sales revenues for the Sep '17 quarter, continuing its strong track record of quarterly comparisons with earnings increases well above the +25% minimum guideline (C criteria). Its annual earnings (A criteria) history has been strong since its $11 IPO on 2/13/14.
The high-ranked Building - Maintenance & Service firm has seen the number of top-rated funds owning its shares rose from 226 in Mar '16 to 296 in Sep '17, a reassuring sign concerning the I criteria. Its small supply of only 31.9 million shares outstanding (S criteria) can contribute to greater price volatility in the event of institutional buying or selling. It currently has a Timeliness Rating of A and a Sponsorship Rating of B.
|
|
|
Color Codes Explained :
Y - Better candidates highlighted by our
staff of experts.
G - Previously featured
in past reports as yellow but may no longer be buyable under the
guidelines.
***Last / Change / Volume data in this table is the closing quote data***
Symbol/Exchange
Company Name
Industry Group |
PRICE |
CHANGE
(%Change) |
Day High |
Volume
(% DAV)
(% 50 day avg vol) |
52 Wk Hi
% From Hi |
Featured
Date |
Price
Featured |
Pivot Featured |
|
Max Buy |
THO
-
NYSE
Thor Industries Inc
AUTOMOTIVE - Recreational Vehicles
|
$151.59
|
-1.96
-1.28% |
$154.84
|
829,855
108.76% of 50 DAV
50 DAV is 763,000
|
$156.86
-3.36%
|
8/14/2017
|
$106.67
|
PP = $110.01
|
|
MB = $115.51
|
Most Recent Note - 11/28/2017 12:49:59 PM
G - Reported earnings +63% on +31% sales revenues for the Oct '17 quarter, continuing its strong earnings track record. Gapped up today and hit a new all-time high, getting more extended from the previously noted base. Its 50 DMA line ($129) and recent low ($127.29 on 11/08/17) define near-term support to watch.
>>> FEATURED STOCK ARTICLE : Encountered Distributional Pressure After Getting Extended From Base - 11/10/2017 |
View all notes |
Set NEW NOTE alert |
Company Profile |
SEC
News |
Chart |
Request a new note
C
A
S
I |
PFBC
-
NASDAQ
Preferred Bank Los Angls
BANKING - Regional - Pacific Banks
|
$63.33
|
+0.73
1.17% |
$63.46
|
116,187
150.89% of 50 DAV
50 DAV is 77,000
|
$66.58
-4.88%
|
10/10/2017
|
$59.38
|
PP = $59.08
|
|
MB = $62.03
|
 Most Recent Note - 12/1/2017 1:03:19 PM
G - Found prompt support at its 50 DMA line ($59.96) during its recent consolidation. Color code is changed to green as it rebounded above its "max buy" level with gains this week marked by increasing volume.
>>> FEATURED STOCK ARTICLE : Slump Back Into Prior Base Raised Concerns - 11/8/2017 |
View all notes |
Set NEW NOTE alert |
Company Profile |
SEC
News |
Chart |
Request a new note
C
A
S
I |
AVGO
-
NASDAQ
Broadcom Limited
ELECTRONICS - Semiconductor - Broad Line
|
$271.56
|
-6.38
-2.30% |
$275.51
|
4,771,312
160.92% of 50 DAV
50 DAV is 2,965,000
|
$285.68
-4.94%
|
10/30/2017
|
$261.19
|
PP = $259.46
|
|
MB = $272.43
|
Most Recent Note - 11/27/2017 3:33:31 PM
G - Quietly hitting another new high today, getting more extended from its prior base. Found support while quietly consolidating above prior highs in the $259 area and above its 50 DMA line ($254). Fundamentals remain strong. Recently made bids to acquire Qualcomm Inc (QCOM).
>>> FEATURED STOCK ARTICLE : Consolidating Near Record High Following Volume-Driven Gains - 11/13/2017 |
View all notes |
Set NEW NOTE alert |
Company Profile |
SEC
News |
Chart |
Request a new note
C
A
S
I |
YY
-
NASDAQ
YY Inc Ads
INTERNET - Internet Service Providers
|
$100.73
|
-2.46
-2.38% |
$104.06
|
1,553,655
94.33% of 50 DAV
50 DAV is 1,647,000
|
$123.48
-18.42%
|
9/25/2017
|
$80.26
|
PP = $83.10
|
|
MB = $87.26
|
Most Recent Note - 11/29/2017 1:30:23 PM
G - Prior high in the $97.59 area defines near-term support along with its 50 DMA line ($93.78). Abruptly retreating from its all-time high after getting very extended from any sound base. Fundamentals remain strong.
>>> FEATURED STOCK ARTICLE : Chinese Social Media Firm Reported Earnings - 11/14/2017 |
View all notes |
Set NEW NOTE alert |
Company Profile |
SEC
News |
Chart |
Request a new note
C
A
S
I |
HTHT
-
NASDAQ
China Lodging Group Ads
LEISURE - Lodging
|
$107.53
|
+1.44
1.36% |
$111.45
|
861,670
178.40% of 50 DAV
50 DAV is 483,000
|
$142.80
-24.70%
|
9/29/2016
|
$46.12
|
PP = $47.82
|
|
MB = $50.21
|
Most Recent Note - 11/29/2017 1:28:38 PM
G - Damaging volume-driven losses triggered technical sell signals as it slumped well below its 50 DMA line ($126). Reported Sep '17 quarterly earnings +58% on +34% sales revenues versus the year ago period, above the +25% minimum earnings guideline (C criteria). Sequential quarterly comparisons have shown encouraging sales revenues growth acceleration.
>>> FEATURED STOCK ARTICLE : Weak Technical Action Raises Concerns Despite Strong Fundamentals - 11/29/2017 |
View all notes |
Set NEW NOTE alert |
Company Profile |
SEC
News |
Chart |
Request a new note
C
A
S
I |
Symbol/Exchange
Company Name
Industry Group |
PRICE |
CHANGE
(%Change) |
Day High |
Volume
(% DAV)
(% 50 day avg vol) |
52 Wk Hi
% From Hi |
Featured
Date |
Price
Featured |
Pivot Featured |
|
Max Buy |
LMAT
-
NASDAQ
Lemaitre Vascular Inc
Medical-Products
|
$32.77
|
-0.16
-0.49% |
$32.89
|
140,071
71.25% of 50 DAV
50 DAV is 196,600
|
$39.88
-17.83%
|
7/28/2017
|
$33.50
|
PP = $33.32
|
|
MB = $34.99
|
Most Recent Note - 11/27/2017 3:30:58 PM
G - Still consolidating below its 50 DMA line. A rebound above the 50 DMA line ($35.90) is needed for its outlook to improve. Its Relative Strength rating of 85 is above the 80+ minimum guideline for buy candidates. Losses below the 200 DMA line and recent low would raise greater concerns.
>>> FEATURED STOCK ARTICLE : Halted Slide After Damaging 50-Day Moving Average Breach - 11/15/2017 |
View all notes |
Set NEW NOTE alert |
Company Profile |
SEC
News |
Chart |
Request a new note
C
A
S
I |
PATK
-
NASDAQ
Patrick Industries Inc
Bldg-Mobile/Mfg and RV
|
$99.10
|
-2.10
-2.08% |
$101.88
|
86,294
102.73% of 50 DAV
50 DAV is 84,000
|
$101.45
-2.32%
|
10/26/2017
|
$90.90
|
PP = $87.90
|
|
MB = $92.30
|
Most Recent Note - 11/28/2017 12:43:11 PM
G - Rallying to a new all-time high and its color code is changed to green after getting extended from its prior base. Prior highs and its 50 DMA line ($87.02) define important near-term support to watch. Fundamentals remain strong.
>>> FEATURED STOCK ARTICLE : Best Ever Close After Pullback Found Support Near Prior High - 11/21/2017 |
View all notes |
Set NEW NOTE alert |
Company Profile |
SEC
News |
Chart |
Request a new note
C
A
S
I |
ESNT
-
NYSE
Essent Group Ltd
Finance-MrtgandRel Svc
|
$45.07
|
+0.82
1.85% |
$45.16
|
1,337,166
147.59% of 50 DAV
50 DAV is 906,000
|
$45.55
-1.05%
|
10/9/2017
|
$39.75
|
PP = $41.54
|
|
MB = $43.62
|
Most Recent Note - 11/27/2017 3:34:33 PM
G - Its 50 DMA line ($42) and recent low ($39.79 on 11/03/17) define important near-term support to watch on pullbacks. Recent consolidation was too brief to be recognized as a valid new base. Fundamentals remain strong.
>>> FEATURED STOCK ARTICLE : Recent Consolidation Was Not a Sufficient Length New Base - 11/20/2017 |
View all notes |
Set NEW NOTE alert |
Company Profile |
SEC
News |
Chart |
Request a new note
C
A
S
I |
FIVE
-
NASDAQ
Five Below Inc
Retail-DiscountandVariety
|
$61.51
|
-0.29
-0.47% |
$63.26
|
4,084,612
489.18% of 50 DAV
50 DAV is 835,000
|
$63.34
-2.88%
|
10/6/2017
|
$57.13
|
PP = $54.23
|
|
MB = $56.94
|
Most Recent Note - 12/1/2017 12:57:39 PM
G - Reported earnings +80% on +29% sales revenues for the Oct '17 quarter, continuing its strong earnings track record. Pulling back from its all-time high today after 3 consecutive volume-driven gains. It is extended from its prior base, and its 50 DMA line ($56.81) defines near-term support to watch.
>>> FEATURED STOCK ARTICLE : Getting Extended From Prior Base With Earnings News Due - 11/24/2017 |
View all notes |
Set NEW NOTE alert |
Company Profile |
SEC
News |
Chart |
Request a new note
C
A
S
I |
OLED
-
NASDAQ
Universal Display Corp
Elec-Misc Products
|
$176.70
|
-4.30
-2.38% |
$179.80
|
1,347,898
151.45% of 50 DAV
50 DAV is 890,000
|
$192.75
-8.33%
|
8/31/2017
|
$128.22
|
PP = $127.78
|
|
MB = $134.17
|
Most Recent Note - 11/29/2017 1:00:46 PM
G - Retreating from its all-time high with today's loss on higher volume indicative of distributional pressure. Very extended from any sound base pattern. Its 50 DMA line ($149.10) and prior high in the $145 area define important near-term support to watch on pullbacks.
>>> FEATURED STOCK ARTICLE : Electronic Products Firm Perched at Record High - 11/17/2017 |
View all notes |
Set NEW NOTE alert |
Company Profile |
SEC
News |
Chart |
Request a new note
C
A
S
I |
Symbol/Exchange
Company Name
Industry Group |
PRICE |
CHANGE
(%Change) |
Day High |
Volume
(% DAV)
(% 50 day avg vol) |
52 Wk Hi
% From Hi |
Featured
Date |
Price
Featured |
Pivot Featured |
|
Max Buy |
ANET
-
NYSE
Arista Networks Inc
TELECOMMUNICATIONS - Communication Equipment
|
$228.65
|
-4.47
-1.92% |
$233.22
|
1,138,570
150.41% of 50 DAV
50 DAV is 757,000
|
$245.65
-6.92%
|
10/27/2017
|
$195.65
|
PP = $196.37
|
|
MB = $206.19
|
Most Recent Note - 11/29/2017 1:31:28 PM
G - Pulling back on higher volume today after getting very extended from the previously noted base. Its 50 DMA line ($203.71) and prior highs in the $196 area define near-term support to watch on pullbacks.
>>> FEATURED STOCK ARTICLE : Perched at Record High Following Volume-Driven Gains - 11/9/2017 |
View all notes |
Set NEW NOTE alert |
Company Profile |
SEC
News |
Chart |
Request a new note
C
A
S
I |
GRUB
-
NYSE
Grubhub Inc
COMPUTER SOFTWARE and SERVICES - Technical and System Software
|
$66.60
|
-0.96
-1.42% |
$68.12
|
1,587,755
104.80% of 50 DAV
50 DAV is 1,515,000
|
$69.82
-4.61%
|
6/21/2017
|
$47.33
|
PP = $46.94
|
|
MB = $49.29
|
Most Recent Note - 11/28/2017 5:58:22 PM
G - It is very extended from any sound base after wedging higher with gains lacking great volume conviction. Prior highs and its 50 DMA line define support near $57. Reported Sep '17 quarterly earnings +22% on +32% sales revenues. The 2 latest quarters were below the +25% minimum earnings guideline (C criteria), raising fundamental concerns with regard to the fact-based investment system.
>>> FEATURED STOCK ARTICLE : Extended From Prior Highs After Gains on Light Volume - 11/22/2017 |
View all notes |
Set NEW NOTE alert |
Company Profile |
SEC
News |
Chart |
Request a new note
C
A
S
I |
IBP
-
NYSE
Installed Building Prod
DIVERSIFIED SERVICES - Business/Management Services
|
$76.55
|
-0.50
-0.65% |
$77.95
|
232,482
124.99% of 50 DAV
50 DAV is 186,000
|
$78.20
-2.11%
|
9/19/2017
|
$59.15
|
PP = $60.10
|
|
MB = $63.11
|
Most Recent Note - 12/1/2017 7:04:44 PM
G - Perched near its all-time high, extended from any sound base. The 50 DMA line ($66.79 and recent low ($59.84 on 11/08/17) define important near-term support to watch on pullbacks. See the latest FSU analysis for more details and a new annotated graph.
>>> FEATURED STOCK ARTICLE : Extended From Any Sound Base After Impressive Rebound and Rally - 12/1/2017 |
View all notes |
Set NEW NOTE alert |
Company Profile |
SEC
News |
Chart |
Request a new note
C
A
S
I |
HQY
-
NASDAQ
Healthequity Inc
COMPUTER SOFTWARE and SERVICES - Healthcare Information Service
|
$51.46
|
-0.41
-0.79% |
$51.99
|
380,985
93.84% of 50 DAV
50 DAV is 406,000
|
$55.31
-6.96%
|
11/6/2017
|
$54.63
|
PP = $52.87
|
|
MB = $55.51
|
Most Recent Note - 11/27/2017 6:32:32 PM
Y - Found support at its 50 DMA line ($50.11) during its consolidation. Abrupt retreat back into the prior base raised concerns after a recent breakout. Disciplined investors always limit losses by selling any stock that falls more than -7% from their purchase price. Three of the past 4 quarterly comparisons through Jul '17 were above the +25% minimum earnings guideline (C criteria).
>>> FEATURED STOCK ARTICLE : Hit New High With Big Volume-Driven Gain - 11/6/2017 |
View all notes |
Set NEW NOTE alert |
Company Profile |
SEC
News |
Chart |
Request a new note
C
A
S
I |
OLLI
-
NASDAQ
Ollie's Bargain Outlet
Retail-DiscountandVariety
|
$47.50
|
+0.05
0.11% |
$47.50
|
790,153
183.76% of 50 DAV
50 DAV is 430,000
|
$48.10
-1.25%
|
11/21/2017
|
$46.78
|
PP = $47.00
|
|
MB = $49.35
|
Most Recent Note - 11/27/2017 6:30:28 PM
Y - Stalled near the new pivot point cited based on its 10/05/17 high plus 10 cents. Subsequent gains above the pivot point backed by at least +40% above average volume may clinch a proper new (or add-on) technical buy signal. Rebounded above its 50 DMA line with convincing volume-driven gains helping its outlook to improve. Prior lows in the $41-42 area define the next important support level where further deterioration would raise more serious concerns. See the latest FSU analysis for more details and a new annotated graph.
>>> FEATURED STOCK ARTICLE : Recently Stalled After Reaching a New High - 11/27/2017 |
View all notes |
Set NEW NOTE alert |
Company Profile |
SEC
News |
Chart |
Request a new note
C
A
S
I |
Symbol/Exchange
Company Name
Industry Group |
PRICE |
CHANGE
(%Change) |
Day High |
Volume
(% DAV)
(% 50 day avg vol) |
52 Wk Hi
% From Hi |
Featured
Date |
Price
Featured |
Pivot Featured |
|
Max Buy |
HLI
-
NYSE
Houlihan Lokey Inc Cl A
Finance-Invest Bnk/Bkrs
|
$43.97
|
-0.47
-1.06% |
$44.49
|
145,761
59.01% of 50 DAV
50 DAV is 247,000
|
$45.12
-2.55%
|
9/18/2017
|
$37.04
|
PP = $39.78
|
|
MB = $41.77
|
Most Recent Note - 11/27/2017 3:35:59 PM
G - Perched near its all-time high, extended from any sound base. Its 50 DMA line and prior lows define near-term support in the $41 area. On 10/26/17 it priced a Secondary Offering. Fundamentals remain strong.
>>> FEATURED STOCK ARTICLE : Holding Ground Near Record High - 11/16/2017 |
View all notes |
Set NEW NOTE alert |
Company Profile |
SEC
News |
Chart |
Request a new note
C
A
S
I |
ICHR
-
NASDAQ
Ichor Holdings Ltd
ELECTRONICS - Semiconductor Equipment
|
$26.47
|
-1.94
-6.83% |
$28.12
|
2,704,678
250.67% of 50 DAV
50 DAV is 1,079,000
|
$35.51
-25.46%
|
10/10/2017
|
$29.39
|
PP = $28.36
|
|
MB = $29.78
|
Most Recent Note - 12/1/2017 7:17:00 PM
Sank further below its 50 DMA line and traded below prior lows in the $26 area intra-day with today's loss on heavy volume triggering a technical sell signal. It will be dropped from the Featured Stocks list tonight. See the latest FSU analysis for more details and an annotated graph.
>>> FEATURED STOCK ARTICLE : Damaging Losses Undercutting 50-Day Average Hurt Outlook - 11/30/2017 |
View all notes |
Set NEW NOTE alert |
Company Profile |
SEC
News |
Chart |
Request a new note
C
A
S
I |
|
|
|
THESE ARE NOT BUY RECOMMENDATIONS!
Comments contained in the body of this report are technical
opinions only. The material herein has been obtained
from sources believed to be reliable and accurate, however,
its accuracy and completeness cannot be guaranteed.
This site is not an investment advisor, hence it does
not endorse or recommend any securities or other investments.
Any recommendation contained in this report may not
be suitable for all investors and it is not to be deemed
an offer or solicitation on our part with respect to
the purchase or sale of any securities. All trademarks,
service marks and trade names appearing in this report
are the property of their respective owners, and are
likewise used for identification purposes only.
This report is a service available
only to active Paid Premium Members.
You may opt-out of receiving report notifications
at any time. Questions or comments may be submitted
by writing to Premium Membership Services 665 S.E. 10 Street, Suite 201 Deerfield Beach, FL 33441-5634 or by calling 1-800-965-8307
or 954-785-1121.
|
|
|