***Last / Change / Volume data in this table is the closing quote data***
Symbol/Exchange
Company Name
Industry Group |
PRICE |
CHANGE
(%Change) |
Day High |
Volume
(% DAV)
(% 50 day avg vol) |
52 Wk Hi
% From Hi |
Featured
Date |
Price
Featured |
Pivot Featured |
|
Max Buy |
THO
-
NYSE
Thor Industries Inc
AUTOMOTIVE - Recreational Vehicles
|
$128.04
|
-5.06
-3.80% |
$133.69
|
1,019,756
138.55% of 50 DAV
50 DAV is 736,000
|
$138.07
-7.26%
|
8/14/2017
|
$106.67
|
PP = $110.01
|
|
MB = $115.51
|
 Most Recent Note - 11/7/2017 3:54:46 PM
G - Pulling back with higher (near average) volume after wedging to new all-time highs with gains lacking great volume conviction. Still very extended from the previously noted base. Its 50 DMA line ($123) defines near-term support above prior highs in the $115 area. Fundamentals remain strong.
>>> FEATURED STOCK ARTICLE : Extended From Prior Base With Volume Totals Cooling - 10/13/2017 |
View all notes |
Set NEW NOTE alert |
Company Profile |
SEC
News |
Chart |
Request a new note
C
A
S
I |
PFBC
-
NASDAQ
Preferred Bank Los Angls
BANKING - Regional - Pacific Banks
|
$59.12
|
-2.12
-3.46% |
$61.26
|
60,677
78.80% of 50 DAV
50 DAV is 77,000
|
$66.58
-11.20%
|
10/10/2017
|
$59.38
|
PP = $59.08
|
|
MB = $62.03
|
Most Recent Note - 11/7/2017 1:57:51 PM
Y - Consolidating near prior highs in the $60 area defining initial support to watch above its 50 DMA line ($57.49). It stalled after triggering a technical buy signal on 10/25/17 but quickly getting extended.
>>> FEATURED STOCK ARTICLE : Perched Near High Following Volume-Driven Breakout Gains - 10/11/2017 |
View all notes |
Set NEW NOTE alert |
Company Profile |
SEC
News |
Chart |
Request a new note
C
A
S
I |
AVGO
-
NASDAQ
Broadcom Limited
ELECTRONICS - Semiconductor - Broad Line
|
$271.32
|
-6.20
-2.23% |
$274.50
|
3,673,550
123.73% of 50 DAV
50 DAV is 2,969,000
|
$281.80
-3.72%
|
10/30/2017
|
$261.19
|
PP = $259.46
|
|
MB = $272.43
|
Most Recent Note - 11/6/2017 12:26:28 PM
G - Trading near its "max buy" level, it triggered a new (or add-on) technical buy signal with volume-driven gains noted last week. Churning above average volume today while hitting another new all-time high and reversing into the red following news it made a bid for Qualcomm Inc (QCOM). Its current Relative Strength rating of 86 is above the 80+ minimum guideline for buy candidates. Subsequent losses below the 50 DMA line and recent low ($231.53 on 9/25/17) would raise serious concerns and trigger a more worrisome technical sell signal.
>>> FEATURED STOCK ARTICLE : Slumped Below 50-Day Moving Average Line Again - 10/17/2017 |
View all notes |
Set NEW NOTE alert |
Company Profile |
SEC
News |
Chart |
Request a new note
C
A
S
I |
YY
-
NASDAQ
YY Inc Ads
INTERNET - Internet Service Providers
|
$91.36
|
-0.98
-1.06% |
$94.27
|
635,927
45.01% of 50 DAV
50 DAV is 1,413,000
|
$97.59
-6.38%
|
9/25/2017
|
$80.26
|
PP = $83.10
|
|
MB = $87.26
|
Most Recent Note - 11/7/2017 2:03:11 PM
G - Found support above prior highs in the $83 area and above its 50 DMA line ($84.95) defining important near-term support to watch.
>>> FEATURED STOCK ARTICLE : Extended After Rallying From Base - 10/19/2017 |
View all notes |
Set NEW NOTE alert |
Company Profile |
SEC
News |
Chart |
Request a new note
C
A
S
I |
STMP
-
NASDAQ
Stamps.com Inc
INTERNET - Internet Software and Services
|
$183.65
|
+4.00
2.23% |
$186.65
|
943,918
226.36% of 50 DAV
50 DAV is 417,000
|
$233.13
-21.22%
|
9/11/2017
|
$193.65
|
PP = $220.35
|
|
MB = $231.37
|
Most Recent Note - 11/7/2017 4:22:00 PM
G - A rebound above the 50 DMA line ($207.87) is needed for its outlook to improve. Holding its ground since it gapped down on 11/03/17 with a damaging volume-driven loss. Violated its 50 DMA line and undercut the recent low ($195.05 on 9/28/17) triggering technical sell signals. Fundamentals remain strong.
>>> FEATURED STOCK ARTICLE : Perched Near Record High Ahead of Earnings News - 11/1/2017 |
View all notes |
Set NEW NOTE alert |
Company Profile |
SEC
News |
Chart |
Request a new note
C
A
S
I |
Symbol/Exchange
Company Name
Industry Group |
PRICE |
CHANGE
(%Change) |
Day High |
Volume
(% DAV)
(% 50 day avg vol) |
52 Wk Hi
% From Hi |
Featured
Date |
Price
Featured |
Pivot Featured |
|
Max Buy |
HTHT
-
NASDAQ
China Lodging Group Ads
LEISURE - Lodging
|
$129.61
|
+4.98
4.00% |
$129.77
|
699,453
168.14% of 50 DAV
50 DAV is 416,000
|
$142.80
-9.24%
|
9/29/2016
|
$46.12
|
PP = $47.82
|
|
MB = $50.21
|
Most Recent Note - 11/7/2017 4:09:56 PM
G - Found support at its 50 DMA line ($123.36) since proposing a new Public Offering on 10/26/17 and enduring distributional pressure. It is very extended from any sound base. Earnings +19% on +18% sales revenues for the Jun '17 quarter were below the +25% minimum earnings guideline (C criteria), raising fundamental concerns.
>>> FEATURED STOCK ARTICLE : Testing 50-Day Moving Average Line After Proposed Offering - 11/2/2017 |
View all notes |
Set NEW NOTE alert |
Company Profile |
SEC
News |
Chart |
Request a new note
C
A
S
I |
LMAT
-
NASDAQ
Lemaitre Vascular Inc
Medical-Products
|
$32.77
|
+0.37
1.14% |
$32.78
|
168,303
77.67% of 50 DAV
50 DAV is 216,700
|
$39.88
-17.83%
|
7/28/2017
|
$33.50
|
PP = $33.32
|
|
MB = $34.99
|
Most Recent Note - 11/7/2017 4:18:22 PM
G - Halted its slide at its 200 DMA line after gapping down and violating its 50 DMA line with a volume-driven loss on 10/27/17 triggering technical sell signals. Its Relative Strength rating has slumped to 78, below the 80+ minimum guideline for buy candidates. A rebound above the 50 DMA line is needed for its outlook to improve. More damaging losses would raise greater concerns. Reported Sep '17 quarterly earnings +47% on +7% sales revenues.
>>> FEATURED STOCK ARTICLE : Consolidating Above 50-Day Moving Average Before Earnings - 10/18/2017 |
View all notes |
Set NEW NOTE alert |
Company Profile |
SEC
News |
Chart |
Request a new note
C
A
S
I |
PATK
-
NASDAQ
Patrick Industries Inc
Bldg-Mobile/Mfg and RV
|
$88.95
|
-1.50
-1.66% |
$91.05
|
72,944
91.18% of 50 DAV
50 DAV is 80,000
|
$96.25
-7.58%
|
10/26/2017
|
$90.90
|
PP = $87.90
|
|
MB = $92.30
|
Most Recent Note - 11/7/2017 3:59:45 PM
Y - Pulling back with 3 consecutive losses on lighter than average volume. Prior highs in the $86-87 area define initial support to watch above its 50 DMA line. Fundamentals remain strong.
>>> FEATURED STOCK ARTICLE : Volume 4 Times Average Behind Breakout Gain on Earnings News - 10/26/2017 |
View all notes |
Set NEW NOTE alert |
Company Profile |
SEC
News |
Chart |
Request a new note
C
A
S
I |
ESNT
-
NYSE
Essent Group Ltd
Finance-MrtgandRel Svc
|
$41.44
|
-0.38
-0.91% |
$41.96
|
1,101,029
134.68% of 50 DAV
50 DAV is 817,500
|
$45.10
-8.12%
|
10/9/2017
|
$39.75
|
PP = $41.54
|
|
MB = $43.62
|
Most Recent Note - 11/6/2017 12:35:51 PM
Y - Finding prompt support near its 50 DMA line ($40.44) following last week's noted volume-driven losses. More damaging losses would trigger a technical sell signal. Due to report earnings news prior to the open on Thursday, November 9th.
>>> FEATURED STOCK ARTICLE : Perched Near High After Streak of Gains - 10/24/2017 |
View all notes |
Set NEW NOTE alert |
Company Profile |
SEC
News |
Chart |
Request a new note
C
A
S
I |
FIVE
-
NASDAQ
Five Below Inc
Retail-DiscountandVariety
|
$57.38
|
+0.14
0.24% |
$57.69
|
720,853
82.95% of 50 DAV
50 DAV is 869,000
|
$58.07
-1.19%
|
10/6/2017
|
$57.13
|
PP = $54.23
|
|
MB = $56.94
|
Most Recent Note - 11/7/2017 2:08:54 PM
Y - Quietly hovering near its "max buy" level and perched near its all-time high. Stayed above prior highs in the $54 area during its recent consolidation while it stayed well above its 50 DMA line.
>>> FEATURED STOCK ARTICLE : Prior Highs Define Important Support While Consolidating - 10/31/2017 |
View all notes |
Set NEW NOTE alert |
Company Profile |
SEC
News |
Chart |
Request a new note
C
A
S
I |
Symbol/Exchange
Company Name
Industry Group |
PRICE |
CHANGE
(%Change) |
Day High |
Volume
(% DAV)
(% 50 day avg vol) |
52 Wk Hi
% From Hi |
Featured
Date |
Price
Featured |
Pivot Featured |
|
Max Buy |
OLED
-
NASDAQ
Universal Display Corp
Elec-Misc Products
|
$167.58
|
+4.18
2.56% |
$167.85
|
1,058,351
112.71% of 50 DAV
50 DAV is 939,000
|
$164.00
2.18%
|
8/31/2017
|
$128.22
|
PP = $127.78
|
|
MB = $134.17
|
Most Recent Note - 11/6/2017 1:05:37 PM
G - Hitting yet another new high today, getting very extended from a riskier "late stage" base pattern. Reported Sep '17 quarterly earnings of 28 cents per share versus a year-ago loss of 3 cents per share on sales revenues +104%. Volume and volatility often increase near earnings news. Its 50 DMA line ($132.80) and prior highs in the $130 area define important near-term support to watch on pullbacks.
>>> FEATURED STOCK ARTICLE : Prior Highs and 50-Day Average Define Near-Term Support - 10/25/2017 |
View all notes |
Set NEW NOTE alert |
Company Profile |
SEC
News |
Chart |
Request a new note
C
A
S
I |
ANET
-
NYSE
Arista Networks Inc
TELECOMMUNICATIONS - Communication Equipment
|
$209.56
|
+2.88
1.39% |
$214.99
|
1,386,049
196.88% of 50 DAV
50 DAV is 704,000
|
$207.35
1.07%
|
10/27/2017
|
$195.65
|
PP = $196.37
|
|
MB = $206.19
|
Most Recent Note - 11/7/2017 12:25:23 PM
G - Color code is changed to green after rallying above its "max buy" level, getting extended from the previously noted base. Big volume-driven gains helped its outlook improve after an abrupt pullback below the 50 DMA line. Noted in the 11/03/17 mid-day report - "Reported earnings +95% on +51% sales revenues for the Sep '17 quarter. Volume and volatility often increase near earnings news."
>>> FEATURED STOCK ARTICLE : Perched Near All-Time High, Extended From Any Sound Base - 10/16/2017 |
View all notes |
Set NEW NOTE alert |
Company Profile |
SEC
News |
Chart |
Request a new note
C
A
S
I |
GRUB
-
NYSE
Grubhub Inc
COMPUTER SOFTWARE and SERVICES - Technical and System Software
|
$62.45
|
-0.47
-0.75% |
$63.10
|
934,275
50.91% of 50 DAV
50 DAV is 1,835,000
|
$63.16
-1.12%
|
6/21/2017
|
$47.33
|
PP = $46.94
|
|
MB = $49.29
|
Most Recent Note - 11/7/2017 4:06:39 PM
G - Quietly holding its ground near its all-time high after impressive volume-driven gains. Rebound above its 50 DMA line ($54.90) helped its outlook improve. Reported Sep '17 quarterly earnings +22% on +32% sales revenues. The 2 latest quarters were below the +25% minimum earnings guideline (C criteria), raising fundamental concerns with regard to the fact-based investment system.
>>> FEATURED STOCK ARTICLE : Technical Strength in Popular Internet Platform - 10/27/2017 |
View all notes |
Set NEW NOTE alert |
Company Profile |
SEC
News |
Chart |
Request a new note
C
A
S
I |
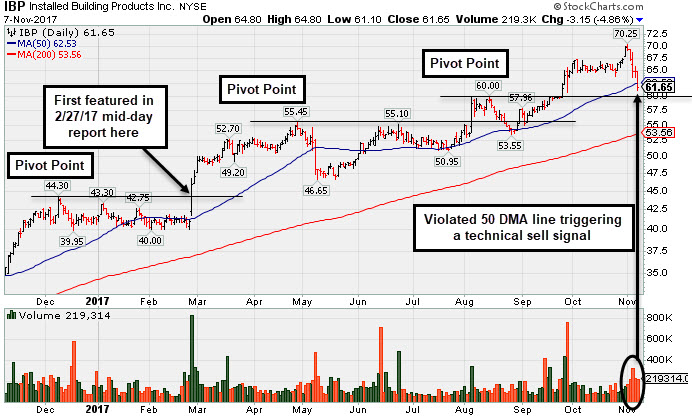
IBP
-
NYSE
Installed Building Prod
DIVERSIFIED SERVICES - Business/Management Services
|
$61.65
|
-3.15
-4.86% |
$64.80
|
219,314
132.92% of 50 DAV
50 DAV is 165,000
|
$70.25
-12.24%
|
9/19/2017
|
$59.15
|
PP = $60.10
|
|
MB = $63.11
|
Most Recent Note - 11/7/2017 5:26:59 PM
G - Raised concerns with today's 5th consecutive volume-driven loss and 50 DMA line ($62.54) violation triggering a technical sell signal. Only a prompt rebound above the 50 DMA line would help its outlook improve. Prior highs in the $60 area also define important near-term support to watch. See the latest FSU analysis for more details and a new annotated graph.
>>> FEATURED STOCK ARTICLE : 50-Day Moving Average Violation Triggered Technical Sell Signal - 11/7/2017 |
View all notes |
Set NEW NOTE alert |
Company Profile |
SEC
News |
Chart |
Request a new note
C
A
S
I |
HQY
-
NASDAQ
Healthequity Inc
COMPUTER SOFTWARE and SERVICES - Healthcare Information Service
|
$49.31
|
-4.65
-8.62% |
$54.94
|
1,353,720
235.02% of 50 DAV
50 DAV is 576,000
|
$55.31
-10.85%
|
11/6/2017
|
$54.63
|
PP = $52.87
|
|
MB = $55.51
|
Most Recent Note - 11/7/2017 1:51:28 PM
Y - Abruptly retreating back into the prior base with today's volume-driven loss, raising concerns. Disciplined investors always limit losses by selling any stock that falls more than -7% from their purchase price. Highlighted in yellow with new pivot point cited based on its 10/04/17 high in the 11/06/17 mid-day report as it hit a new high with a considerable volume-driven gain triggering a technical buy signal. Recently tested and found support after rebounding above its 50 DMA line ($48.42). Three of the past 4 quarterly comparisons through Jul '17 were above the +25% minimum earnings guideline (C criteria). See the latest FSU analysis for more details and an annotated graph.
>>> FEATURED STOCK ARTICLE : Hit New High With Big Volume-Driven Gain - 11/6/2017 |
View all notes |
Set NEW NOTE alert |
Company Profile |
SEC
News |
Chart |
Request a new note
C
A
S
I |
Symbol/Exchange
Company Name
Industry Group |
PRICE |
CHANGE
(%Change) |
Day High |
Volume
(% DAV)
(% 50 day avg vol) |
52 Wk Hi
% From Hi |
Featured
Date |
Price
Featured |
Pivot Featured |
|
Max Buy |
OLLI
-
NASDAQ
Ollie's Bargain Outlet
Retail-DiscountandVariety
|
$43.40
|
-0.80
-1.81% |
$44.25
|
351,456
69.60% of 50 DAV
50 DAV is 505,000
|
$46.90
-7.46%
|
9/8/2017
|
$45.20
|
PP = $46.18
|
|
MB = $48.49
|
Most Recent Note - 11/7/2017 2:01:30 PM
G - Slumping further below its 50 DMA line ($45.05) line with today's loss on light volume. A rebound above the 50 DMA line is needed for its outlook to improve. Prior low ($41.30 on 8/31/17) defines the next important support level where further deterioration would raise more serious concerns.
>>> FEATURED STOCK ARTICLE : Sell Signal Triggered by 50-Day Moving Average Violation on Higher Volume - 10/30/2017 |
View all notes |
Set NEW NOTE alert |
Company Profile |
SEC
News |
Chart |
Request a new note
C
A
S
I |
HLI
-
NYSE
Houlihan Lokey Inc Cl A
Finance-Invest Bnk/Bkrs
|
$40.90
|
-0.66
-1.59% |
$41.85
|
150,101
51.76% of 50 DAV
50 DAV is 290,000
|
$44.15
-7.36%
|
9/18/2017
|
$37.04
|
PP = $39.78
|
|
MB = $41.77
|
Most Recent Note - 11/7/2017 4:02:51 PM
Y - Color code is changed to yellow while quietly consolidating below its "max buy" level. On 10/26/17 it priced a Secondary Offering, and abruptly retreated from its all-time high. Such offerings typically hinder price performance for a short time, yet they also help to attract new or greater institutional interest (I criteria). Reported earnings +51% on +30% sales revenues for its second quarter ended September 30th versus the year-ago period.
>>> FEATURED STOCK ARTICLE : Recent Gains Lacked Volume; Earnings Report Due Soon - 10/23/2017 |
View all notes |
Set NEW NOTE alert |
Company Profile |
SEC
News |
Chart |
Request a new note
C
A
S
I |
ICHR
-
NASDAQ
Ichor Holdings Ltd
ELECTRONICS - Semiconductor Equipment
|
$31.05
|
+0.03
0.10% |
$31.56
|
677,907
90.18% of 50 DAV
50 DAV is 751,700
|
$35.51
-12.56%
|
10/10/2017
|
$29.39
|
PP = $28.36
|
|
MB = $29.78
|
Most Recent Note - 11/7/2017 2:21:12 PM
G - Color code is changed to green after trading back above its "max buy" level. Due to report Sep '17 quarterly earnings news on Thursday, November 9th after the close. Volume and volatility often increase near earnings news. Found prompt support last week near prior highs in the $29 area and its 50 DMA line ($27.52). More damaging losses would raise greater concerns.
>>> FEATURED STOCK ARTICLE : Undercut Prior Highs and Tested 50-Day Moving Average Line - 11/3/2017 |
View all notes |
Set NEW NOTE alert |
Company Profile |
SEC
News |
Chart |
Request a new note
C
A
S
I |