***Last / Change / Volume data in this table is the closing quote data***
Symbol/Exchange
Company Name
Industry Group |
PRICE |
CHANGE
(%Change) |
Day High |
Volume
(% DAV)
(% 50 day avg vol) |
52 Wk Hi
% From Hi |
Featured
Date |
Price
Featured |
Pivot Featured |
|
Max Buy |
THO
-
NYSE
Thor Industries Inc
AUTOMOTIVE - Recreational Vehicles
|
$131.77
|
+1.32
1.01% |
$132.34
|
470,670
68.21% of 50 DAV
50 DAV is 690,000
|
$138.07
-4.56%
|
8/14/2017
|
$106.67
|
PP = $110.01
|
|
MB = $115.51
|
Most Recent Note - 11/10/2017 4:58:55 PM
G - Still very extended from the previously noted base. Its 50 DMA line ($124.29) defines near-term support above prior highs in the $115 area. Fundamentals remain strong. See the latest FSU analysis for more details and a new annotated graph.
>>> FEATURED STOCK ARTICLE : Encountered Distributional Pressure After Getting Extended From Base - 11/10/2017 |
View all notes |
Set NEW NOTE alert |
Company Profile |
SEC
News |
Chart |
Request a new note
C
A
S
I |
PFBC
-
NASDAQ
Preferred Bank Los Angls
BANKING - Regional - Pacific Banks
|
$58.88
|
+0.63
1.08% |
$59.15
|
28,889
36.34% of 50 DAV
50 DAV is 79,500
|
$66.58
-11.57%
|
10/10/2017
|
$59.38
|
PP = $59.08
|
|
MB = $62.03
|
Most Recent Note - 11/8/2017 5:16:12 PM
Y - Slumped below prior highs in the $60 area raising concerns while completely negating the recent breakout. Its 50 DMA line ($57.56) defines important near-term support where a violation would raise greater concerns. See the latest FSU analysis for more details and a new annotated graph.
>>> FEATURED STOCK ARTICLE : Slump Back Into Prior Base Raised Concerns - 11/8/2017 |
View all notes |
Set NEW NOTE alert |
Company Profile |
SEC
News |
Chart |
Request a new note
C
A
S
I |
AVGO
-
NASDAQ
Broadcom Limited
ELECTRONICS - Semiconductor - Broad Line
|
$263.26
|
-1.75
-0.66% |
$265.58
|
1,971,457
66.22% of 50 DAV
50 DAV is 2,977,000
|
$281.80
-6.58%
|
10/30/2017
|
$261.19
|
PP = $259.46
|
|
MB = $272.43
|
Most Recent Note - 11/13/2017 5:17:18 PM
Y - Quietly consolidating above prior highs in the $259 area defining initial support to watch. Pulled back from its all-time high following 11/06/17 news it made a bid for Qualcomm Inc (QCOM). See the latest FSU analysis for more details and a new annotated graph.
>>> FEATURED STOCK ARTICLE : Consolidating Near Record High Following Volume-Driven Gains - 11/13/2017 |
View all notes |
Set NEW NOTE alert |
Company Profile |
SEC
News |
Chart |
Request a new note
C
A
S
I |
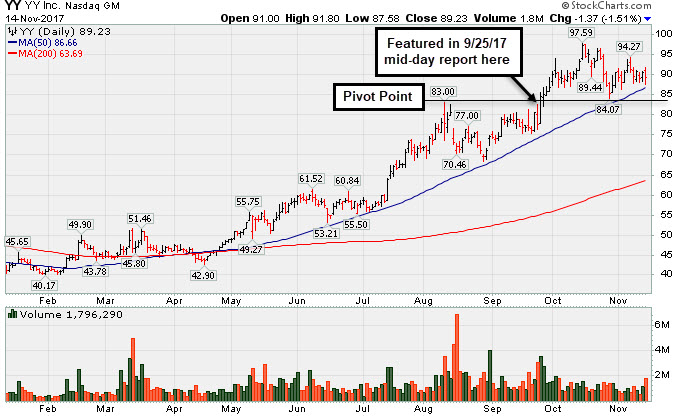
YY
-
NASDAQ
YY Inc Ads
INTERNET - Internet Service Providers
|
$89.23
|
-1.37
-1.51% |
$91.80
|
1,789,849
139.83% of 50 DAV
50 DAV is 1,280,000
|
$97.59
-8.57%
|
9/25/2017
|
$80.26
|
PP = $83.10
|
|
MB = $87.26
|
 Most Recent Note - 11/14/2017 5:33:48 PM
G - Report stronger than expected Sep '17 quarterly results after the close today. Volume and volatility often increase near earnings news. Consolidating above its 50 DMA line ($86.66), recent low ($84.07 on 10/27/17) defining near-term support to watch. It has not formed a new base of sufficient length. See the latest FSU analysis for more details and a new annotated graph.
>>> FEATURED STOCK ARTICLE : Chinese Social Media Firm Reported Earnings - 11/14/2017 |
View all notes |
Set NEW NOTE alert |
Company Profile |
SEC
News |
Chart |
Request a new note
C
A
S
I |
STMP
-
NASDAQ
Stamps.com Inc
INTERNET - Internet Software and Services
|
$175.05
|
-2.95
-1.66% |
$177.80
|
299,967
67.56% of 50 DAV
50 DAV is 444,000
|
$233.13
-24.91%
|
9/11/2017
|
$193.65
|
PP = $220.35
|
|
MB = $231.37
|
Most Recent Note - 11/13/2017 3:47:05 PM
G - Holding its ground well above its 200 DMA line ($157) since its gap down on 11/03/17 for a damaging volume-driven loss. Fundamentals remain strong. A rebound above the 50 DMA line ($206.58) is needed for its outlook to improve.
>>> FEATURED STOCK ARTICLE : Perched Near Record High Ahead of Earnings News - 11/1/2017 |
View all notes |
Set NEW NOTE alert |
Company Profile |
SEC
News |
Chart |
Request a new note
C
A
S
I |
Symbol/Exchange
Company Name
Industry Group |
PRICE |
CHANGE
(%Change) |
Day High |
Volume
(% DAV)
(% 50 day avg vol) |
52 Wk Hi
% From Hi |
Featured
Date |
Price
Featured |
Pivot Featured |
|
Max Buy |
HTHT
-
NASDAQ
China Lodging Group Ads
LEISURE - Lodging
|
$124.66
|
-4.11
-3.19% |
$127.60
|
572,964
133.87% of 50 DAV
50 DAV is 428,000
|
$142.80
-12.70%
|
9/29/2016
|
$46.12
|
PP = $47.82
|
|
MB = $50.21
|
Most Recent Note - 11/13/2017 3:44:19 PM
G - Found support at its 50 DMA line ($124.59) while consolidating since proposing a new Public Offering on 10/26/17. It is still extended from any sound base. Earnings +19% on +18% sales revenues for the Jun '17 quarter were below the +25% minimum earnings guideline (C criteria), raising fundamental concerns.
>>> FEATURED STOCK ARTICLE : Testing 50-Day Moving Average Line After Proposed Offering - 11/2/2017 |
View all notes |
Set NEW NOTE alert |
Company Profile |
SEC
News |
Chart |
Request a new note
C
A
S
I |
LMAT
-
NASDAQ
Lemaitre Vascular Inc
Medical-Products
|
$34.28
|
+0.18
0.53% |
$34.43
|
200,873
95.20% of 50 DAV
50 DAV is 211,000
|
$39.88
-14.04%
|
7/28/2017
|
$33.50
|
PP = $33.32
|
|
MB = $34.99
|
Most Recent Note - 11/13/2017 10:20:47 AM
G - Its Relative Strength rating has improved to 81, above the 80+ minimum guideline for buy candidates. A rebound above the 50 DMA line is needed for its outlook to improve. Losses below the 200 DMA line and recent low would raise greater concerns.
>>> FEATURED STOCK ARTICLE : Consolidating Above 50-Day Moving Average Before Earnings - 10/18/2017 |
View all notes |
Set NEW NOTE alert |
Company Profile |
SEC
News |
Chart |
Request a new note
C
A
S
I |
PATK
-
NASDAQ
Patrick Industries Inc
Bldg-Mobile/Mfg and RV
|
$88.05
|
+0.95
1.09% |
$88.26
|
107,743
133.02% of 50 DAV
50 DAV is 81,000
|
$96.25
-8.52%
|
10/26/2017
|
$90.90
|
PP = $87.90
|
|
MB = $92.30
|
Most Recent Note - 11/13/2017 1:05:00 PM
Y - Recently consolidating near prior highs in the $86-87 area which define initial support to watch above its 50 DMA line ($83.47). Fundamentals remain strong.
>>> FEATURED STOCK ARTICLE : Volume 4 Times Average Behind Breakout Gain on Earnings News - 10/26/2017 |
View all notes |
Set NEW NOTE alert |
Company Profile |
SEC
News |
Chart |
Request a new note
C
A
S
I |
ESNT
-
NYSE
Essent Group Ltd
Finance-MrtgandRel Svc
|
$42.32
|
-0.62
-1.44% |
$42.94
|
665,316
75.95% of 50 DAV
50 DAV is 876,000
|
$45.10
-6.16%
|
10/9/2017
|
$39.75
|
PP = $41.54
|
|
MB = $43.62
|
Most Recent Note - 11/13/2017 10:32:53 AM
Y - Consolidating above its 50 DMA line ($40.80) and recent low ($39.79 on 11/03/17) defining important near-term support. Relative Strength rating has slumped to 79, below the 80+ minimum guideline for buy candidates. More damaging losses would trigger a technical sell signal. Reported Sep '17 earnings +26% on +24% sales revenues.
>>> FEATURED STOCK ARTICLE : Perched Near High After Streak of Gains - 10/24/2017 |
View all notes |
Set NEW NOTE alert |
Company Profile |
SEC
News |
Chart |
Request a new note
C
A
S
I |
FIVE
-
NASDAQ
Five Below Inc
Retail-DiscountandVariety
|
$58.35
|
+0.32
0.55% |
$58.69
|
422,780
58.56% of 50 DAV
50 DAV is 722,000
|
$58.56
-0.36%
|
10/6/2017
|
$57.13
|
PP = $54.23
|
|
MB = $56.94
|
Most Recent Note - 11/13/2017 3:51:48 PM
G - Color code is changed to green after quietly rising above its "max buy" level today and hitting another new all-time high. Prior highs and its 50 DMA line define support in the $54 area.
>>> FEATURED STOCK ARTICLE : Prior Highs Define Important Support While Consolidating - 10/31/2017 |
View all notes |
Set NEW NOTE alert |
Company Profile |
SEC
News |
Chart |
Request a new note
C
A
S
I |
Symbol/Exchange
Company Name
Industry Group |
PRICE |
CHANGE
(%Change) |
Day High |
Volume
(% DAV)
(% 50 day avg vol) |
52 Wk Hi
% From Hi |
Featured
Date |
Price
Featured |
Pivot Featured |
|
Max Buy |
OLED
-
NASDAQ
Universal Display Corp
Elec-Misc Products
|
$177.45
|
+0.40
0.23% |
$178.45
|
724,629
78.34% of 50 DAV
50 DAV is 925,000
|
$178.71
-0.71%
|
8/31/2017
|
$128.22
|
PP = $127.78
|
|
MB = $134.17
|
Most Recent Note - 11/10/2017 12:40:08 PM
G - Hitting yet another new high with today's 7th consecutive gain, getting very extended from a riskier "late stage" base pattern. Reported Sep '17 quarterly earnings of 28 cents per share versus a year-ago loss of 3 cents per share on sales revenues +104%. Prior highs in the $145 area and its 50 DMA line ($137) define important near-term support to watch on pullbacks.
>>> FEATURED STOCK ARTICLE : Prior Highs and 50-Day Average Define Near-Term Support - 10/25/2017 |
View all notes |
Set NEW NOTE alert |
Company Profile |
SEC
News |
Chart |
Request a new note
C
A
S
I |
ANET
-
NYSE
Arista Networks Inc
TELECOMMUNICATIONS - Communication Equipment
|
$227.10
|
+1.95
0.87% |
$228.86
|
632,045
82.62% of 50 DAV
50 DAV is 765,000
|
$227.13
-0.01%
|
10/27/2017
|
$195.65
|
PP = $196.37
|
|
MB = $206.19
|
Most Recent Note - 11/10/2017 12:13:25 PM
G - Rallying further into new high territory today, getting very extended from the previously noted base. See the latest FSU analysis for more details and an annotated graph.
>>> FEATURED STOCK ARTICLE : Perched at Record High Following Volume-Driven Gains - 11/9/2017 |
View all notes |
Set NEW NOTE alert |
Company Profile |
SEC
News |
Chart |
Request a new note
C
A
S
I |
GRUB
-
NYSE
Grubhub Inc
COMPUTER SOFTWARE and SERVICES - Technical and System Software
|
$63.08
|
-0.54
-0.85% |
$63.68
|
538,223
29.82% of 50 DAV
50 DAV is 1,805,000
|
$63.81
-1.14%
|
6/21/2017
|
$47.33
|
PP = $46.94
|
|
MB = $49.29
|
Most Recent Note - 11/13/2017 3:55:16 PM
G - Hitting another new all-time high today, adding to recent gains lacking great volume conviction, getting extended from any sound base. Reported Sep '17 quarterly earnings +22% on +32% sales revenues. The 2 latest quarters were below the +25% minimum earnings guideline (C criteria), raising fundamental concerns with regard to the fact-based investment system.
>>> FEATURED STOCK ARTICLE : Technical Strength in Popular Internet Platform - 10/27/2017 |
View all notes |
Set NEW NOTE alert |
Company Profile |
SEC
News |
Chart |
Request a new note
C
A
S
I |
IBP
-
NYSE
Installed Building Prod
DIVERSIFIED SERVICES - Business/Management Services
|
$67.30
|
+4.80
7.68% |
$67.35
|
404,040
229.57% of 50 DAV
50 DAV is 176,000
|
$70.25
-4.20%
|
9/19/2017
|
$59.15
|
PP = $60.10
|
|
MB = $63.11
|
Most Recent Note - 11/14/2017 12:46:32 PM
G - Rebounded above its 50 DMA line ($63.21) helping its outlook improve. Color code is changed to green after rising back above its "max buy" level. Subsequent losses below the recent low ($59.84 on 11/08/17) would raise more serious concerns.
>>> FEATURED STOCK ARTICLE : 50-Day Moving Average Violation Triggered Technical Sell Signal - 11/7/2017 |
View all notes |
Set NEW NOTE alert |
Company Profile |
SEC
News |
Chart |
Request a new note
C
A
S
I |
HQY
-
NASDAQ
"HealthEquity, Inc"
COMPUTER SOFTWARE and SERVICES - Healthcare Information Service
|
$49.77
|
-0.28
-0.56% |
$50.13
|
383,890
71.04% of 50 DAV
50 DAV is 540,400
|
$55.31
-10.02%
|
11/6/2017
|
$54.63
|
PP = $52.87
|
|
MB = $55.51
|
Most Recent Note - 11/14/2017 5:39:28 PM
Y - Abruptly retreated back into the prior base, raising concerns after a recent breakout. Disciplined investors always limit losses by selling any stock that falls more than -7% from their purchase price. Tested and found support at its 50 DMA line ($49.23). Three of the past 4 quarterly comparisons through Jul '17 were above the +25% minimum earnings guideline (C criteria).
>>> FEATURED STOCK ARTICLE : Hit New High With Big Volume-Driven Gain - 11/6/2017 |
View all notes |
Set NEW NOTE alert |
Company Profile |
SEC
News |
Chart |
Request a new note
C
A
S
I |
Symbol/Exchange
Company Name
Industry Group |
PRICE |
CHANGE
(%Change) |
Day High |
Volume
(% DAV)
(% 50 day avg vol) |
52 Wk Hi
% From Hi |
Featured
Date |
Price
Featured |
Pivot Featured |
|
Max Buy |
OLLI
-
NASDAQ
Ollie's Bargain Outlet
Retail-DiscountandVariety
|
$43.95
|
-1.20
-2.66% |
$45.00
|
380,231
84.12% of 50 DAV
50 DAV is 452,000
|
$46.90
-6.29%
|
9/8/2017
|
$45.20
|
PP = $46.18
|
|
MB = $48.49
|
Most Recent Note - 11/14/2017 5:35:24 PM
G - Still sputtering below its 50 DMA line, and a rebound above that important short-term average ($45.19) is needed for its outlook to improve. Prior low ($41.30 on 8/31/17) defines the next important support level where further deterioration would raise more serious concerns.
>>> FEATURED STOCK ARTICLE : Sell Signal Triggered by 50-Day Moving Average Violation on Higher Volume - 10/30/2017 |
View all notes |
Set NEW NOTE alert |
Company Profile |
SEC
News |
Chart |
Request a new note
C
A
S
I |
HLI
-
NYSE
Houlihan Lokey Inc Cl A
Finance-Invest Bnk/Bkrs
|
$42.38
|
+0.29
0.69% |
$42.38
|
245,879
85.37% of 50 DAV
50 DAV is 288,000
|
$44.15
-4.01%
|
9/18/2017
|
$37.04
|
PP = $39.78
|
|
MB = $41.77
|
Most Recent Note - 11/14/2017 5:36:44 PM
G - Color code is changed to green after rising above its "max buy" level. On 10/26/17 it priced a Secondary Offering. Such offerings typically hinder price performance for a short time, yet they also help to attract new or greater institutional interest (I criteria). Reported earnings +51% on +30% sales revenues for its second quarter ended September 30th versus the year-ago period.
>>> FEATURED STOCK ARTICLE : Recent Gains Lacked Volume; Earnings Report Due Soon - 10/23/2017 |
View all notes |
Set NEW NOTE alert |
Company Profile |
SEC
News |
Chart |
Request a new note
C
A
S
I |
ICHR
-
NASDAQ
Ichor Holdings Ltd
ELECTRONICS - Semiconductor Equipment
|
$27.43
|
-1.55
-5.35% |
$29.51
|
1,831,785
229.84% of 50 DAV
50 DAV is 797,000
|
$35.51
-22.75%
|
10/10/2017
|
$29.39
|
PP = $28.36
|
|
MB = $29.78
|
Most Recent Note - 11/13/2017 10:17:54 AM
G - Color code is changed to green after violating its 50 DMA line ($28.03) with today's gap down and 4th consecutive loss raising greater concerns. Only a prompt rebound above the 50 DMA line would help its outlook improve.
>>> FEATURED STOCK ARTICLE : Undercut Prior Highs and Tested 50-Day Moving Average Line - 11/3/2017 |
View all notes |
Set NEW NOTE alert |
Company Profile |
SEC
News |
Chart |
Request a new note
C
A
S
I |