You are not logged in.
This means you
CAN ONLY VIEW reports that were published prior to Thursday, March 20, 2025.
You
MUST UPGRADE YOUR MEMBERSHIP if you want to see any current reports.
AFTER MARKET UPDATE - MONDAY, NOVEMBER 6TH, 2017
Previous After Market Report Next After Market Report >>>
|
|
|
|
DOW |
+9.23 |
23,548.42 |
+0.04% |
|
Volume |
852,603,830 |
+5% |
|
Volume |
2,163,308,890 |
-1% |
|
NASDAQ |
+22.00 |
6,786.44 |
+0.33% |
|
Advancers |
1,701 |
58% |
|
Advancers |
1,426 |
52% |
|
S&P 500 |
+3.29 |
2,591.13 |
+0.13% |
|
Decliners |
1,246 |
42% |
|
Decliners |
1,311 |
48% |
|
Russell 2000 |
+3.05 |
1,497.96 |
+0.20% |
|
52 Wk Highs |
165 |
|
|
52 Wk Highs |
177 |
|
|
S&P 600 |
+1.86 |
902.74 |
+0.21% |
|
52 Wk Lows |
49 |
|
|
52 Wk Lows |
67 |
|
|
 |
Indices Continue to Rally Higher
Kenneth J. Gruneisen - Passed the CAN SLIM® Master's Exam
Stocks finished higher Monday. The Dow added 9 points to 23548. The S&P 500 gained 3 points to 2591. The Nasdaq Composite climbed 22 points to 6786. Volume totals reported were mixed, lighter than the prior session total on the NYSE and slightly higher on the Nasdaq exchange. Advancers led decliners by about 3-2 on the NYSE while the mix was closer to even on the Nasdaq exchange. There were 70 high-ranked companies from the Leaders List that made new 52-week highs and were listed on the BreakOuts Page, versus the total of 74 on the prior session. New 52-week highs totals solidly outnumbered shrinking new 52-week lows totals on both the Nasdaq exchange and NYSE. The Featured Stocks Page provides the latest analysis on noteworthy high-ranked leaders. Charts used courtesy of www.stockcharts.com
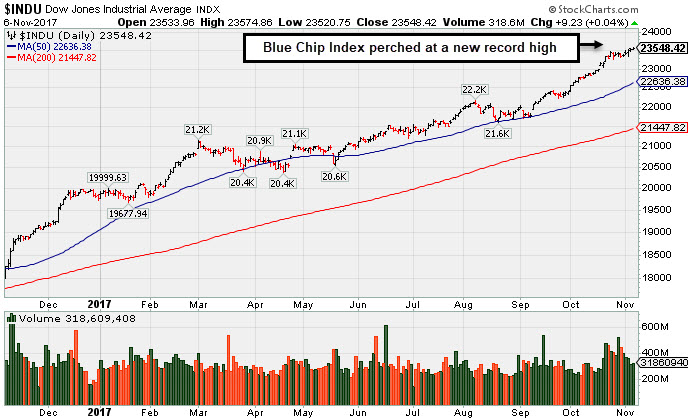 PICTURED: The Dow Jones Industrial Average is perched at a record high.
The major averages' (M criteria) are in a confirmed uptrend. Leadership has remained healthy. Investors should buy stocks meeting all key criteria of the fact-based investment system on a case-by-case basis as they trigger technical buy signals.
The major averages closed at record levels as investors digested a flurry of M&A headlines. NYMEX WTI crude rose 3.1% to $57.34 to a two year high on reports of a political shakeup in Saudi Arabia as several princes and oil billionaires were arrested on corruption charges. In Fed news, New York Regional President William Dudley, announced that he will retire in mid-2018. There were notable economic updates on Monday.
Six of 11 S&P 500 sectors finished lower. Energy provided a strong tailwind to the markets as Baker Hughes (BHGE +8.79%) following the announcement of a $3 billion share buyback. In M&A news, Qualcomm (QCOM +1.15%) rose on reports Broadcom (AVGO +1.42%) made an offer to buy the chipmaker. Telecom was a notable decliner as Sprint (S -11.54%) fell as merger talks with T-Mobile (TMUS -5.72%) collapsed without a deal. Class A shares of 21st Century Fox climbed 9.9% to $27.45 after CNBC reported the media company is exploring the sale of the majority of its assets to Disney. In earnings news, Michael Kors (KORS +14.70%) surged after topping analyst estimates.
Treasuries ended the session higher as the yield on the benchmark 10-year note fell three basis points to 2.31%. In commodities, COMEX gold added 1.0% to $1282.40/ounce. |
 Kenneth J. Gruneisen started out as a licensed stockbroker in August 1987, a couple of months prior to the historic stock market crash that took the Dow Jones Industrial Average down -22.6% in a single day. He has published daily fact-based fundamental and technical analysis on high-ranked stocks online for two decades. Through FACTBASEDINVESTING.COM, Kenneth provides educational articles, news, market commentary, and other information regarding proven investment systems that work in good times and bad.
Comments contained in the body of this report are technical opinions only and are not necessarily those of Gruneisen Growth Corp. The material herein has been obtained from sources believed to be reliable and accurate, however, its accuracy and completeness cannot be guaranteed. Our firm, employees, and customers may effect transactions, including transactions contrary to any recommendation herein, or have positions in the securities mentioned herein or options with respect thereto. Any recommendation contained in this report may not be suitable for all investors and it is not to be deemed an offer or solicitation on our part with respect to the purchase or sale of any securities. |
|
 |
Commodity-Linked Groups Led Gainers
Kenneth J. Gruneisen - Passed the CAN SLIM® Master's Exam
On Monday the Retail Index ($RLX +0.22%) and Broker/Dealer Index ($XBD +0.26%) both edged higher but the Bank Index ($BKX -0.12%) ended slightly to the downside. The tech sector was mixed, with gains from the Semiconductor Index ($SOX +1.34%) and the Networking Index ($NWX +1.31%), but the Biotechnology Index ($BTK -1.25%) ended lower. Commodity-linked groups had a positive bias as the Gold & Silver Index ($XAU +1.92%) and the Integrated Oil Index ($XOI +2.08%) were both outpaced by a standout gain from the Oil Services Index ($OSX +4.49%). Charts courtesy www.stockcharts.com
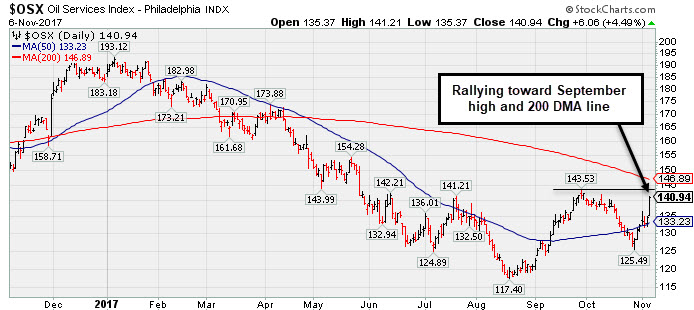 PICTURED: The Oil Services Index ($OSX +4.49%) posted a big gain on Monday, rallying toward its September high and its 200-day moving average (DMA) line.
| Oil Services |
$OSX |
140.94 |
+6.06 |
+4.49% |
-23.31% |
| Integrated Oil |
$XOI |
1,289.96 |
+26.29 |
+2.08% |
+1.73% |
| Semiconductor |
$SOX |
1,317.34 |
+17.37 |
+1.34% |
+45.33% |
| Networking |
$NWX |
466.37 |
+6.05 |
+1.31% |
+4.54% |
| Broker/Dealer |
$XBD |
244.73 |
+0.64 |
+0.26% |
+19.22% |
| Retail |
$RLX |
1,605.39 |
+3.47 |
+0.22% |
+19.54% |
| Gold & Silver |
$XAU |
82.28 |
+1.56 |
+1.93% |
+4.34% |
| Bank |
$BKX |
102.00 |
-0.13 |
-0.13% |
+11.12% |
| Biotech |
$BTK |
4,154.65 |
-52.58 |
-1.25% |
+35.11% |
|
|
|
 |
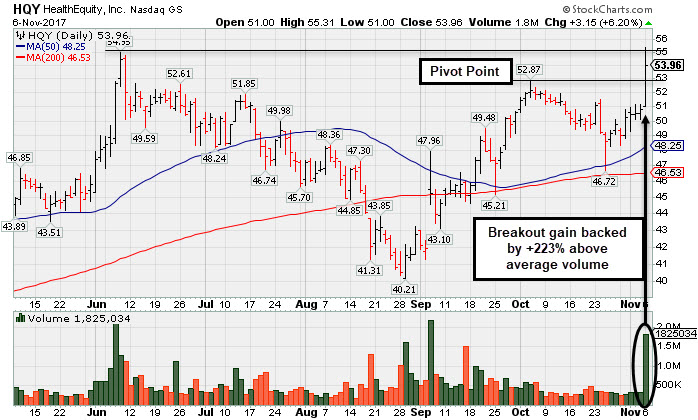
Hit New High With Big Volume-Driven Gain
Kenneth J. Gruneisen - Passed the CAN SLIM® Master's Exam
Healthequity Inc (HQY +$3.15 or +6.20% to $53.96) was highlighted in yellow with new pivot point cited based on its 10/04/17 high in the earlier mid-day report (read here). It hit a new high with today's considerable volume-driven gain triggering a technical buy signal, and it faces no resistance due to overhead supply. Fundamentals remain strong as three of the past 4 quarterly comparisons through Jul '17 were above the +25% minimum earnings guideline (C criteria) and underpinned by strong sales revenues increases.
It tested and found support after rebounding above its 50-day moving average (DMA) line ($48.27) since last noted and dropped from the Featured Stocks list on 8/17/17. HQY was shown in this FSU section on 7/19/17 with an annotated graph under the headline, "50-Day Moving Average Violation Triggers Technical Sell Signal".
The number of top-rated funds owning its shares rose from 369 in Dec '16 to 426 in Sep '17, a reassuring sign concerning the I criteria. Its current Up/Down Volume Ratio of 1.5 is also an unbiased indication its shares have been under accumulation over the past 50 days. It has a fairly small supply of only 48.6 million shares (S criteria) outstanding, which can contribute to greater price volatility in the event of institutional buying or selling. It currently has a Timeliness Rating of B and a Sponsorship Rating of C.
The Commercial Services - Outsourcing industry group currently has a Group Relative Strength Rating of 73, however there are other strong leaders in the group hitting new highs, a reassuring sign concerning the L criteria. It completed its $14 IPO on 7/31/14 followed by an additional Public Offering on 5/05/15 and Secondary Offerings on both 10/20/16 and 9/23/15.
|
|
|
Color Codes Explained :
Y - Better candidates highlighted by our
staff of experts.
G - Previously featured
in past reports as yellow but may no longer be buyable under the
guidelines.
***Last / Change / Volume data in this table is the closing quote data***
Symbol/Exchange
Company Name
Industry Group |
PRICE |
CHANGE
(%Change) |
Day High |
Volume
(% DAV)
(% 50 day avg vol) |
52 Wk Hi
% From Hi |
Featured
Date |
Price
Featured |
Pivot Featured |
|
Max Buy |
THO
-
NYSE
Thor Industries Inc
AUTOMOTIVE - Recreational Vehicles
|
$133.10
|
-3.17
-2.33% |
$136.24
|
751,157
103.18% of 50 DAV
50 DAV is 728,000
|
$138.07
-3.60%
|
8/14/2017
|
$106.67
|
PP = $110.01
|
|
MB = $115.51
|
Most Recent Note - 11/1/2017 5:32:29 PM
G - Volume has been below average while wedging to new all-time highs. Posted 10 consecutive weekly gains, getting very extended from the previously noted base. Its 50 DMA line ($120.69) defines near-term support above prior highs in the $115 area. Fundamentals remain strong.
>>> FEATURED STOCK ARTICLE : Extended From Prior Base With Volume Totals Cooling - 10/13/2017 |
View all notes |
Set NEW NOTE alert |
Company Profile |
SEC
News |
Chart |
Request a new note
C
A
S
I |
PFBC
-
NASDAQ
Preferred Bank Los Angls
BANKING - Regional - Pacific Banks
|
$61.24
|
+0.00
0.00% |
$62.15
|
34,466
44.76% of 50 DAV
50 DAV is 77,000
|
$66.58
-8.02%
|
10/10/2017
|
$59.38
|
PP = $59.08
|
|
MB = $62.03
|
Most Recent Note - 10/30/2017 5:48:58 PM
Y - Pulled back near its "max buy" level today and its color code is changed to yellow. It triggered a technical buy signal on 10/25/17 but quickly got extended. Prior highs in the $60 area define initial support to watch.
>>> FEATURED STOCK ARTICLE : Perched Near High Following Volume-Driven Breakout Gains - 10/11/2017 |
View all notes |
Set NEW NOTE alert |
Company Profile |
SEC
News |
Chart |
Request a new note
C
A
S
I |
AVGO
-
NASDAQ
Broadcom Limited
ELECTRONICS - Semiconductor - Broad Line
|
$277.52
|
+3.89
1.42% |
$281.80
|
7,632,234
258.63% of 50 DAV
50 DAV is 2,951,000
|
$278.00
-0.17%
|
10/30/2017
|
$261.19
|
PP = $259.46
|
|
MB = $272.43
|
 Most Recent Note - 11/6/2017 12:26:28 PM
G - Trading near its "max buy" level, it triggered a new (or add-on) technical buy signal with volume-driven gains noted last week. Churning above average volume today while hitting another new all-time high and reversing into the red following news it made a bid for Qualcomm Inc (QCOM). Its current Relative Strength rating of 86 is above the 80+ minimum guideline for buy candidates. Subsequent losses below the 50 DMA line and recent low ($231.53 on 9/25/17) would raise serious concerns and trigger a more worrisome technical sell signal.
>>> FEATURED STOCK ARTICLE : Slumped Below 50-Day Moving Average Line Again - 10/17/2017 |
View all notes |
Set NEW NOTE alert |
Company Profile |
SEC
News |
Chart |
Request a new note
C
A
S
I |
YY
-
NASDAQ
YY Inc Ads
INTERNET - Internet Service Providers
|
$92.34
|
+1.83
2.02% |
$93.75
|
984,051
69.45% of 50 DAV
50 DAV is 1,417,000
|
$97.59
-5.38%
|
9/25/2017
|
$80.26
|
PP = $83.10
|
|
MB = $87.26
|
Most Recent Note - 10/30/2017 6:07:44 PM
G - Halted its slide with a gain today following 4 consecutive losses. Prior highs in the $83 area coincide with its 50 DMA line ($82.98) defining important neat-term support to watch.
>>> FEATURED STOCK ARTICLE : Extended After Rallying From Base - 10/19/2017 |
View all notes |
Set NEW NOTE alert |
Company Profile |
SEC
News |
Chart |
Request a new note
C
A
S
I |
STMP
-
NASDAQ
Stamps.com Inc
INTERNET - Internet Software and Services
|
$179.65
|
+8.40
4.91% |
$180.93
|
1,955,826
508.01% of 50 DAV
50 DAV is 385,000
|
$233.13
-22.94%
|
9/11/2017
|
$193.65
|
PP = $220.35
|
|
MB = $231.37
|
Most Recent Note - 11/3/2017 12:05:46 PM
G - Gapped down today with a damaging volume-driven loss violating its 50 DMA line ($208.42) and undercutting the recent low ($195.05 on 9/28/17) triggering technical sell signals. Color code is changed to green. A rebound above the 50 DMA line is needed for its outlook to improve. Reported Sep '17 quarterly earnings +73% on +24% sales revenues, continuing its strong earnings track record. Volume and volatility often increase near earnings news. See the latest FSU analysis for more details and an annotated graph.
>>> FEATURED STOCK ARTICLE : Perched Near Record High Ahead of Earnings News - 11/1/2017 |
View all notes |
Set NEW NOTE alert |
Company Profile |
SEC
News |
Chart |
Request a new note
C
A
S
I |
Symbol/Exchange
Company Name
Industry Group |
PRICE |
CHANGE
(%Change) |
Day High |
Volume
(% DAV)
(% 50 day avg vol) |
52 Wk Hi
% From Hi |
Featured
Date |
Price
Featured |
Pivot Featured |
|
Max Buy |
HTHT
-
NASDAQ
China Lodging Group Ads
LEISURE - Lodging
|
$124.63
|
+1.47
1.19% |
$127.55
|
511,557
124.16% of 50 DAV
50 DAV is 412,000
|
$142.80
-12.72%
|
9/29/2016
|
$46.12
|
PP = $47.82
|
|
MB = $50.21
|
Most Recent Note - 11/2/2017 4:54:04 PM
G - Suffered another volume-driven loss today, testing its 50 DMA line ($122.39) and undercutting the recent low, raising concerns. There were "negative reversals" on 10/25/17 and 11/01/17 noted as it abruptly retreated from its all-time high after proposing a new Public Offering. It is very extended from any sound base. Earnings +19% on +18% sales revenues for the Jun '17 quarter were below the +25% minimum earnings guideline (C criteria). See the latest FSU analysis for more details and a new annotated graph.
>>> FEATURED STOCK ARTICLE : Testing 50-Day Moving Average Line After Proposed Offering - 11/2/2017 |
View all notes |
Set NEW NOTE alert |
Company Profile |
SEC
News |
Chart |
Request a new note
C
A
S
I |
LMAT
-
NASDAQ
Lemaitre Vascular Inc
Medical-Products
|
$32.40
|
+0.39
1.22% |
$32.42
|
159,075
73.51% of 50 DAV
50 DAV is 216,400
|
$39.88
-18.76%
|
7/28/2017
|
$33.50
|
PP = $33.32
|
|
MB = $34.99
|
Most Recent Note - 11/1/2017 3:54:12 PM
G - Halted its slide after it gapped down and violated its 50 DMA line on 10/27/17 raising concerns and triggering technical sell signals. Its 200 DMA line ($29.95) is an important long-term average which may act as a support level. Reported Sep '17 quarterly earnings +47% on +7% sales revenues.
>>> FEATURED STOCK ARTICLE : Consolidating Above 50-Day Moving Average Before Earnings - 10/18/2017 |
View all notes |
Set NEW NOTE alert |
Company Profile |
SEC
News |
Chart |
Request a new note
C
A
S
I |
PATK
-
NASDAQ
Patrick Industries Inc
Bldg-Mobile/Mfg and RV
|
$90.45
|
-1.45
-1.58% |
$93.65
|
52,757
65.95% of 50 DAV
50 DAV is 80,000
|
$96.25
-6.03%
|
10/26/2017
|
$90.90
|
PP = $87.90
|
|
MB = $92.30
|
Most Recent Note - 11/1/2017 5:30:20 PM
Y - Pulled back with above average volume today, finishing just below its "max buy" level. Triggered a technical buy signal with a big 10/26/17 gain backed by 4 times average volume. Reported earnings +37% on +34% sales revenues for the Sep '17 quarter. It has earned a 96 Earnings Per Share rating and fundamentals remain strong. Leadership (L criteria) from others in the industry group (Building - Mobile/ Mfg & RV) is a reassuring sign. Went through a long and choppy consolidation since dropped from the Featured Stocks list on 3/09/17.
>>> FEATURED STOCK ARTICLE : Volume 4 Times Average Behind Breakout Gain on Earnings News - 10/26/2017 |
View all notes |
Set NEW NOTE alert |
Company Profile |
SEC
News |
Chart |
Request a new note
C
A
S
I |
ESNT
-
NYSE
Essent Group Ltd
Finance-MrtgandRel Svc
|
$41.82
|
+1.35
3.34% |
$42.14
|
1,742,952
219.52% of 50 DAV
50 DAV is 794,000
|
$45.10
-7.27%
|
10/9/2017
|
$39.75
|
PP = $41.54
|
|
MB = $43.62
|
Most Recent Note - 11/6/2017 12:35:51 PM
Y - Finding prompt support near its 50 DMA line ($40.44) following last week's noted volume-driven losses. More damaging losses would trigger a technical sell signal. Due to report earnings news prior to the open on Thursday, November 9th.
>>> FEATURED STOCK ARTICLE : Perched Near High After Streak of Gains - 10/24/2017 |
View all notes |
Set NEW NOTE alert |
Company Profile |
SEC
News |
Chart |
Request a new note
C
A
S
I |
FIVE
-
NASDAQ
Five Below Inc
Retail-DiscountandVariety
|
$57.24
|
+0.23
0.40% |
$57.53
|
526,962
60.09% of 50 DAV
50 DAV is 877,000
|
$58.07
-1.43%
|
10/6/2017
|
$57.13
|
PP = $54.23
|
|
MB = $56.94
|
Most Recent Note - 10/31/2017 5:05:37 PM
Y - Consolidating above prior highs in the $54 area defining initial support to watch above its 50 DMA line ($52.75). See the latest FSU analysis for more details and a new annotated graph.
>>> FEATURED STOCK ARTICLE : Prior Highs Define Important Support While Consolidating - 10/31/2017 |
View all notes |
Set NEW NOTE alert |
Company Profile |
SEC
News |
Chart |
Request a new note
C
A
S
I |
Symbol/Exchange
Company Name
Industry Group |
PRICE |
CHANGE
(%Change) |
Day High |
Volume
(% DAV)
(% 50 day avg vol) |
52 Wk Hi
% From Hi |
Featured
Date |
Price
Featured |
Pivot Featured |
|
Max Buy |
OLED
-
NASDAQ
Universal Display Corp
Elec-Misc Products
|
$163.40
|
+5.30
3.35% |
$164.00
|
1,507,583
164.40% of 50 DAV
50 DAV is 917,000
|
$160.95
1.52%
|
8/31/2017
|
$128.22
|
PP = $127.78
|
|
MB = $134.17
|
Most Recent Note - 11/6/2017 1:05:37 PM
G - Hitting yet another new high today, getting very extended from a riskier "late stage" base pattern. Reported Sep '17 quarterly earnings of 28 cents per share versus a year-ago loss of 3 cents per share on sales revenues +104%. Volume and volatility often increase near earnings news. Its 50 DMA line ($132.80) and prior highs in the $130 area define important near-term support to watch on pullbacks.
>>> FEATURED STOCK ARTICLE : Prior Highs and 50-Day Average Define Near-Term Support - 10/25/2017 |
View all notes |
Set NEW NOTE alert |
Company Profile |
SEC
News |
Chart |
Request a new note
C
A
S
I |
ANET
-
NYSE
Arista Networks Inc
TELECOMMUNICATIONS - Communication Equipment
|
$206.68
|
+5.19
2.58% |
$207.35
|
1,111,101
161.26% of 50 DAV
50 DAV is 689,000
|
$202.15
2.24%
|
10/27/2017
|
$195.65
|
PP = $196.37
|
|
MB = $206.19
|
Most Recent Note - 11/3/2017 12:23:02 PM
Y - Gapped up today, promptly rebounding above its 50 DMA line ($185.67) with a big volume-driven gain helping its outlook improve. Reported earnings +95% on +51% sales revenues for the Sep '17 quarter. Volume and volatility often increase near earnings news. Recently rallied from an advanced "3-weeks tight" base but then negated the breakout.
>>> FEATURED STOCK ARTICLE : Perched Near All-Time High, Extended From Any Sound Base - 10/16/2017 |
View all notes |
Set NEW NOTE alert |
Company Profile |
SEC
News |
Chart |
Request a new note
C
A
S
I |
GRUB
-
NYSE
Grubhub Inc
COMPUTER SOFTWARE and SERVICES - Technical and System Software
|
$62.92
|
+0.73
1.17% |
$63.16
|
942,080
51.45% of 50 DAV
50 DAV is 1,831,000
|
$62.96
-0.06%
|
6/21/2017
|
$47.33
|
PP = $46.94
|
|
MB = $49.29
|
Most Recent Note - 11/1/2017 5:34:17 PM
G - Quietly hit another new high today but reversed into the red. Holding its ground after an impressive streak of volume-driven gains. Rebound above its 50 DMA line ($54.28) helped its outlook improve this week. However, it reported Sep '17 quarterly earnings +22% on +32% sales revenues, its 2nd consecutive quarter below the +25% minimum earnings guideline (C criteria), so fundamental concerns remain with regard to the fact-based investment system. See the latest FSU analysis for more details and an annotated graph.
>>> FEATURED STOCK ARTICLE : Technical Strength in Popular Internet Platform - 10/27/2017 |
View all notes |
Set NEW NOTE alert |
Company Profile |
SEC
News |
Chart |
Request a new note
C
A
S
I |
IBP
-
NYSE
Installed Building Prod
DIVERSIFIED SERVICES - Business/Management Services
|
$64.80
|
-0.05
-0.08% |
$65.70
|
223,387
137.89% of 50 DAV
50 DAV is 162,000
|
$70.25
-7.76%
|
9/19/2017
|
$59.15
|
PP = $60.10
|
|
MB = $63.11
|
Most Recent Note - 11/3/2017 6:00:08 PM
G - Pulled back with above average volume behind losses this week after wedging into new high territory with gains lacking great volume conviction. Its 50 DMA line ($62.18) defines near-term support above prior highs in the $60 area.
>>> FEATURED STOCK ARTICLE : Building - Maintenance & Service Firm Extended From Latest Base - 10/9/2017 |
View all notes |
Set NEW NOTE alert |
Company Profile |
SEC
News |
Chart |
Request a new note
C
A
S
I |
HQY
-
NASDAQ
Healthequity Inc
COMPUTER SOFTWARE and SERVICES - Healthcare Information Service
|
$53.96
|
+3.15
6.20% |
$55.31
|
1,825,141
333.05% of 50 DAV
50 DAV is 548,000
|
$54.95
-1.80%
|
11/6/2017
|
$54.63
|
PP = $52.87
|
|
MB = $55.51
|
Most Recent Note - 11/6/2017 5:21:43 PM
Y - Highlighted in yellow with new pivot point cited based on its 10/04/17 high in the earlier mid-day report. Hit a new high with today's considerable volume-driven gain triggering a technical buy signal. Faces no resistance due to overhead supply. Tested and found support after rebounding above its 50 DMA line ($48.27). Three of the past 4 quarterly comparisons through Jul '17 were above the +25% minimum earnings guideline (C criteria). See the latest FSU analysis for more details and a new annotated graph.
>>> FEATURED STOCK ARTICLE : Hit New High With Big Volume-Driven Gain - 11/6/2017 |
View all notes |
Set NEW NOTE alert |
Company Profile |
SEC
News |
Chart |
Request a new note
C
A
S
I |
Symbol/Exchange
Company Name
Industry Group |
PRICE |
CHANGE
(%Change) |
Day High |
Volume
(% DAV)
(% 50 day avg vol) |
52 Wk Hi
% From Hi |
Featured
Date |
Price
Featured |
Pivot Featured |
|
Max Buy |
OLLI
-
NASDAQ
Ollie's Bargain Outlet
Retail-DiscountandVariety
|
$44.20
|
-0.30
-0.67% |
$44.85
|
384,159
74.74% of 50 DAV
50 DAV is 514,000
|
$46.90
-5.76%
|
9/8/2017
|
$45.20
|
PP = $46.18
|
|
MB = $48.49
|
Most Recent Note - 10/30/2017 5:39:53 PM
G - Abruptly retreated from its all-time high, violating its 50 DMA line ($45.01) line with a big volume-driven loss triggering a technical sell signal. Only a prompt rebound above the 50 DMA line would help its outlook improve. Color code was changed to green. Recent lows in the $43-44 area may act as support, but further deterioration would raise more serious concerns. See the latest FSU analysis for more details and a new annotated graph.
>>> FEATURED STOCK ARTICLE : Sell Signal Triggered by 50-Day Moving Average Violation on Higher Volume - 10/30/2017 |
View all notes |
Set NEW NOTE alert |
Company Profile |
SEC
News |
Chart |
Request a new note
C
A
S
I |
HLI
-
NYSE
Houlihan Lokey Inc Cl A
Finance-Invest Bnk/Bkrs
|
$41.56
|
+0.13
0.31% |
$41.79
|
133,734
46.12% of 50 DAV
50 DAV is 290,000
|
$44.15
-5.87%
|
9/18/2017
|
$37.04
|
PP = $39.78
|
|
MB = $41.77
|
Most Recent Note - 11/1/2017 5:27:39 PM
G - Color code is changed to green after finishing the session back above the "max buy" level. Gapped down on 10/26/17 after pricing a Secondary Offering, abruptly retreating from its all-time high. Such offerings typically hinder price performance short-term, yet also help attract new or greater institutional interest (I criteria). Reported earnings +51% on +30% sales revenues for its second quarter ended September 30th versus the year-ago period.
>>> FEATURED STOCK ARTICLE : Recent Gains Lacked Volume; Earnings Report Due Soon - 10/23/2017 |
View all notes |
Set NEW NOTE alert |
Company Profile |
SEC
News |
Chart |
Request a new note
C
A
S
I |
ICHR
-
NASDAQ
Ichor Holdings Ltd
ELECTRONICS - Semiconductor Equipment
|
$31.02
|
+1.25
4.20% |
$31.26
|
701,821
93.95% of 50 DAV
50 DAV is 747,000
|
$35.51
-12.64%
|
10/10/2017
|
$29.39
|
PP = $28.36
|
|
MB = $29.78
|
Most Recent Note - 11/3/2017 5:53:09 PM
Y - Found support at its 50 DMA ($27.09) this week after undercutting its "max buy" level and prior highs in the $29 area. More damaging losses would raise greater concerns. See the latest FSU analysis for more details and a new annotated graph.
>>> FEATURED STOCK ARTICLE : Undercut Prior Highs and Tested 50-Day Moving Average Line - 11/3/2017 |
View all notes |
Set NEW NOTE alert |
Company Profile |
SEC
News |
Chart |
Request a new note
C
A
S
I |
|
|
|
THESE ARE NOT BUY RECOMMENDATIONS!
Comments contained in the body of this report are technical
opinions only. The material herein has been obtained
from sources believed to be reliable and accurate, however,
its accuracy and completeness cannot be guaranteed.
This site is not an investment advisor, hence it does
not endorse or recommend any securities or other investments.
Any recommendation contained in this report may not
be suitable for all investors and it is not to be deemed
an offer or solicitation on our part with respect to
the purchase or sale of any securities. All trademarks,
service marks and trade names appearing in this report
are the property of their respective owners, and are
likewise used for identification purposes only.
This report is a service available
only to active Paid Premium Members.
You may opt-out of receiving report notifications
at any time. Questions or comments may be submitted
by writing to Premium Membership Services 665 S.E. 10 Street, Suite 201 Deerfield Beach, FL 33441-5634 or by calling 1-800-965-8307
or 954-785-1121.
|
|
|