You are not logged in.
This means you
CAN ONLY VIEW reports that were published prior to Thursday, March 20, 2025.
You
MUST UPGRADE YOUR MEMBERSHIP if you want to see any current reports.
AFTER MARKET UPDATE - FRIDAY, NOVEMBER 17TH, 2017
Previous After Market Report Next After Market Report >>>
|
|
|
|
DOW |
-100.12 |
23,358.24 |
-0.43% |
|
Volume |
874,953,980 |
+13% |
|
Volume |
2,006,023,620 |
+1% |
|
NASDAQ |
-10.50 |
6,782.79 |
-0.15% |
|
Advancers |
1,902 |
65% |
|
Advancers |
1,727 |
62% |
|
S&P 500 |
-6.79 |
2,578.85 |
-0.26% |
|
Decliners |
1,031 |
35% |
|
Decliners |
1,038 |
38% |
|
Russell 2000 |
+5.94 |
1,492.82 |
+0.40% |
|
52 Wk Highs |
113 |
|
|
52 Wk Highs |
132 |
|
|
S&P 600 |
+15.29 |
905.23 |
+1.72% |
|
52 Wk Lows |
27 |
|
|
52 Wk Lows |
32 |
|
|
 |
Major Indices Fell Even Though Breadth Was Positive
Kenneth J. Gruneisen - Passed the CAN SLIM® Master's Exam
For the week, the S&P 500 fell 0.1%, while the Dow lost 0.2%, and the Nasdaq declined 0.4%. The U.S. equities finished lower Friday. The Dow lost 100 points to 23358. The S&P 500 declined 6 points to 2578 and the Nasdaq Composite was down 10 points to 6782. Volume totals reported were higher than the prior session totals on the NYSE and on the Nasdaq exchange. Breadth was positive as advancers led decliners by a nearly a 2-1 margin on the NYSE and 9-5 on the Nasdaq exchange. There were 57 high-ranked companies from the Leaders List that made new 52-week highs and were listed on the BreakOuts Page, versus the total of 72 on the prior session. New 52-week highs totals outnumbered new 52-week lows on both the NYSE and the Nasdaq exchange. The Featured Stocks Page provides the latest analysis on noteworthy high-ranked leaders. Charts used courtesy of www.stockcharts.com
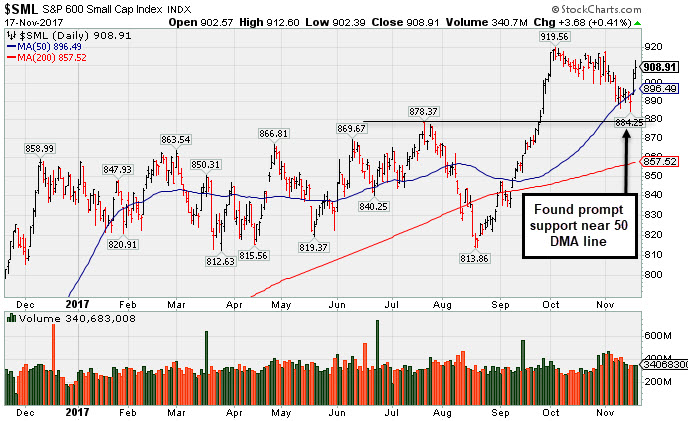 PICTURED: The S&P 600 Small Cap Index found prompt support near its 50-day moving average (DMA) line.
The major averages (M criteria) are in a confirmed uptrend. Investors should only consider stocks meeting all key criteria of the fact-based investment system as they trigger technical buy signals.
The major averages declined for the week amid lingering concerns on potential delays in the timeline for GOP tax reform. A report from CNBC revealed Treasury Secretary Steven Mnuchin anticipates a Republican tax reform bill to be sent to President Trump by Christmas. On the economic front, a report showed housing starts jumped 13.7% in October, the readings strongest pace in a year. Another release revealed building permits increased 5.9% last month versus projections to grow 2.0%.
Seven of 11 S&P 500 sectors finished lower on Friday. Technology shares were a notable decliner as Applied Materials Inc. (AMAT -2.33%) fell even after the semiconductor topped earnings estimates. Consumer Discretionary stocks outperformed as Foot Locker (FL +28.16%) and Ross Stores (ROST +10.0%) rose after both retailers’ revealed positive quarterly results. In M&A news, Twenty-First Century Fox (FOX +6.57%) rose on reports Comcast (CMCSA -2.45%) and Verizon (VZ +1.45%) are interested in purchasing the company’s entertainment units.
Treasuries were higher with the yield on the 10-year note down two basis points to 2.34%. In commodities, NYMEX WTI crude advanced 2.6% to $56.59/barrel. COMEX gold increased 1.3% to $1295.10/ounce amid a weaker dollar. |
 Kenneth J. Gruneisen started out as a licensed stockbroker in August 1987, a couple of months prior to the historic stock market crash that took the Dow Jones Industrial Average down -22.6% in a single day. He has published daily fact-based fundamental and technical analysis on high-ranked stocks online for two decades. Through FACTBASEDINVESTING.COM, Kenneth provides educational articles, news, market commentary, and other information regarding proven investment systems that work in good times and bad.
Comments contained in the body of this report are technical opinions only and are not necessarily those of Gruneisen Growth Corp. The material herein has been obtained from sources believed to be reliable and accurate, however, its accuracy and completeness cannot be guaranteed. Our firm, employees, and customers may effect transactions, including transactions contrary to any recommendation herein, or have positions in the securities mentioned herein or options with respect thereto. Any recommendation contained in this report may not be suitable for all investors and it is not to be deemed an offer or solicitation on our part with respect to the purchase or sale of any securities. |
|
 |
Retail, Networking, and Commodity-Linked Groups Led Gainers
Kenneth J. Gruneisen - Passed the CAN SLIM® Master's Exam
The Retail Index ($RLX +0.59%) posted a modest gain and the Bank Index ($BKX +0.11%) finished slightly higher on Friday. The tech sector was mixed as the Networking Index ($NWX +0.65%) outpaced the Biotechnology Index ($BTK +0.22%) but the Semiconductor Index ($SOX -0.47%) fell. Commodity-linked groups had a positive bias as the Oil Services Index ($OSX +1.38%), Integrated Oil Index ($XOI +0.43%), and the Gold & Silver Index ($XAU +1.30%) rose. Charts courtesy www.stockcharts.com
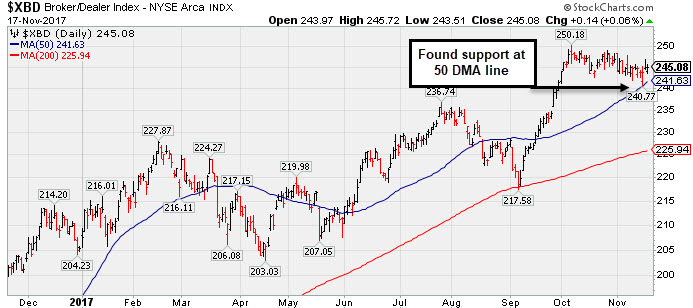 PICTURED: The Broker/Dealer Index ($XBD +0.06%) found support at its 50-day moving average (DMA) line.
| Oil Services |
$OSX |
131.31 |
+1.78 |
+1.37% |
-28.55% |
| Integrated Oil |
$XOI |
1,241.80 |
+5.26 |
+0.43% |
-2.07% |
| Semiconductor |
$SOX |
1,306.93 |
-6.18 |
-0.47% |
+44.18% |
| Networking |
$NWX |
479.71 |
+3.10 |
+0.65% |
+7.53% |
| Broker/Dealer |
$XBD |
245.08 |
+0.14 |
+0.06% |
+19.39% |
| Retail |
$RLX |
1,620.73 |
+9.46 |
+0.59% |
+20.68% |
| Gold & Silver |
$XAU |
80.88 |
+1.04 |
+1.30% |
+2.56% |
| Bank |
$BKX |
99.18 |
+0.11 |
+0.11% |
+8.05% |
| Biotech |
$BTK |
4,150.01 |
+8.94 |
+0.22% |
+34.96% |
|
|
|
 |
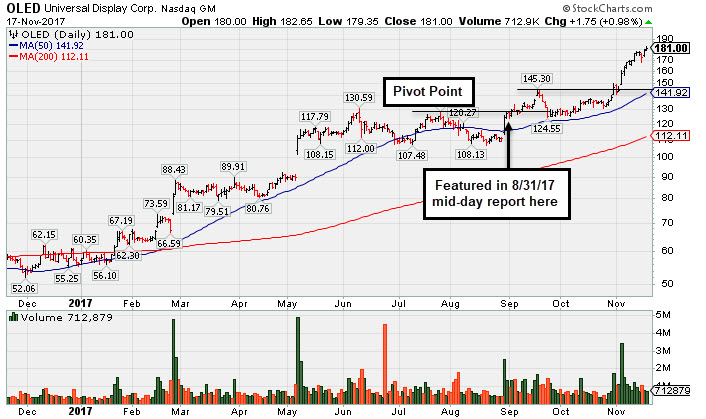
Electronic Products Firm Perched at Record High
Kenneth J. Gruneisen - Passed the CAN SLIM® Master's Exam
Universal Display Corp (OLED +$1.75 or +0.98% to $181.00) hit another new all-time high with today's gain on light volume, very extended from any sound base pattern. Recently it reported Sep '17 quarterly earnings of 28 cents per share versus a year-ago loss of 3 cents per share on sales revenues +104%.
OLED was first featured in yellow in the 8/31/17 mid-day report (read here). It was last shown in this FSU section on 10/25/17 with an annotated graph under the headline, "Prior Highs and 50-Day Average Define Near-Term Support". It reported +115% earnings on +59% sales revenues for the Jun '17 quarter, its 3rd consecutive strong quarter above the +25% minimum guideline (C criteria), helped it better match with the fact-based investment system's fundamental guidelines. Its annual earnings (A criteria) history has been strong.
The high-ranked Electronic Products firm has earned a current Timeliness rating of A and a Sponsorship rating of B. The number of top-rated funds owning its shares rose from 355 in Sep '16 to 418 in Sep '17. Its current Up/Down Volume Ratio of 2.3 is an unbiased indication its shares have been under accumulation over the past 50 days (I criteria). Its small supply of only 40.9 million shares (S criteria) in the public float can contribute to greater volatility in the event of institutional buying or selling. |
|
|
Color Codes Explained :
Y - Better candidates highlighted by our
staff of experts.
G - Previously featured
in past reports as yellow but may no longer be buyable under the
guidelines.
***Last / Change / Volume data in this table is the closing quote data***
Symbol/Exchange
Company Name
Industry Group |
PRICE |
CHANGE
(%Change) |
Day High |
Volume
(% DAV)
(% 50 day avg vol) |
52 Wk Hi
% From Hi |
Featured
Date |
Price
Featured |
Pivot Featured |
|
Max Buy |
THO
-
NYSE
Thor Industries Inc
AUTOMOTIVE - Recreational Vehicles
|
$133.87
|
+2.68
2.04% |
$134.64
|
513,318
75.49% of 50 DAV
50 DAV is 680,000
|
$138.07
-3.04%
|
8/14/2017
|
$106.67
|
PP = $110.01
|
|
MB = $115.51
|
Most Recent Note - 11/16/2017 5:43:04 PM
G - Consolidating after getting extended from the previously noted base. Its 50 DMA line ($126) and recent low ($127.29 on 11/08/17) define near-term support to watch. Fundamentals remain strong.
>>> FEATURED STOCK ARTICLE : Encountered Distributional Pressure After Getting Extended From Base - 11/10/2017 |
View all notes |
Set NEW NOTE alert |
Company Profile |
SEC
News |
Chart |
Request a new note
C
A
S
I |
PFBC
-
NASDAQ
Preferred Bank Los Angls
BANKING - Regional - Pacific Banks
|
$59.97
|
+0.28
0.47% |
$60.45
|
70,075
90.65% of 50 DAV
50 DAV is 77,300
|
$66.58
-9.93%
|
10/10/2017
|
$59.38
|
PP = $59.08
|
|
MB = $62.03
|
Most Recent Note - 11/15/2017 6:23:33 PM
Y - Consolidating above its 50 DMA line ($58.06) which has recently acted as support. Slumped below prior highs in the $60 area raising concerns while completely negating the recent breakout.
>>> FEATURED STOCK ARTICLE : Slump Back Into Prior Base Raised Concerns - 11/8/2017 |
View all notes |
Set NEW NOTE alert |
Company Profile |
SEC
News |
Chart |
Request a new note
C
A
S
I |
AVGO
-
NASDAQ
Broadcom Limited
ELECTRONICS - Semiconductor - Broad Line
|
$271.86
|
-0.25
-0.09% |
$272.11
|
2,357,564
77.86% of 50 DAV
50 DAV is 3,028,000
|
$281.80
-3.53%
|
10/30/2017
|
$261.19
|
PP = $259.46
|
|
MB = $272.43
|
Most Recent Note - 11/13/2017 5:17:18 PM
Y - Quietly consolidating above prior highs in the $259 area defining initial support to watch. Pulled back from its all-time high following 11/06/17 news it made a bid for Qualcomm Inc (QCOM). See the latest FSU analysis for more details and a new annotated graph.
>>> FEATURED STOCK ARTICLE : Consolidating Near Record High Following Volume-Driven Gains - 11/13/2017 |
View all notes |
Set NEW NOTE alert |
Company Profile |
SEC
News |
Chart |
Request a new note
C
A
S
I |
YY
-
NASDAQ
YY Inc Ads
INTERNET - Internet Service Providers
|
$107.23
|
+0.21
0.20% |
$110.45
|
1,863,599
120.93% of 50 DAV
50 DAV is 1,541,000
|
$116.90
-8.27%
|
9/25/2017
|
$80.26
|
PP = $83.10
|
|
MB = $87.26
|
Most Recent Note - 11/16/2017 1:25:06 PM
G - Reversed into the red today after hitting another new high. Spiked to a new all-time high with a gap up and big volume-driven gain on the prior session, getting very extended from any sound base. Reported Sep '17 quarterly earnings +42% on +49% sales revenues. Volume and volatility often increase near earnings news. Found support when consolidating above its 50 DMA line ($87.96). Patient investors may watch for a new base or secondary buy point to possibly develop and be noted in the weeks ahead.
>>> FEATURED STOCK ARTICLE : Chinese Social Media Firm Reported Earnings - 11/14/2017 |
View all notes |
Set NEW NOTE alert |
Company Profile |
SEC
News |
Chart |
Request a new note
C
A
S
I |
STMP
-
NASDAQ
Stamps.com Inc
INTERNET - Internet Software and Services
|
$175.10
|
-0.15
-0.09% |
$175.90
|
311,235
70.10% of 50 DAV
50 DAV is 444,000
|
$233.13
-24.89%
|
9/11/2017
|
$193.65
|
PP = $220.35
|
|
MB = $231.37
|
Most Recent Note - 11/13/2017 3:47:05 PM
G - Holding its ground well above its 200 DMA line ($157) since its gap down on 11/03/17 for a damaging volume-driven loss. Fundamentals remain strong. A rebound above the 50 DMA line ($206.58) is needed for its outlook to improve.
>>> FEATURED STOCK ARTICLE : Perched Near Record High Ahead of Earnings News - 11/1/2017 |
View all notes |
Set NEW NOTE alert |
Company Profile |
SEC
News |
Chart |
Request a new note
C
A
S
I |
Symbol/Exchange
Company Name
Industry Group |
PRICE |
CHANGE
(%Change) |
Day High |
Volume
(% DAV)
(% 50 day avg vol) |
52 Wk Hi
% From Hi |
Featured
Date |
Price
Featured |
Pivot Featured |
|
Max Buy |
HTHT
-
NASDAQ
China Lodging Group Ads
LEISURE - Lodging
|
$124.63
|
-2.83
-2.22% |
$128.70
|
376,713
85.23% of 50 DAV
50 DAV is 442,000
|
$142.80
-12.72%
|
9/29/2016
|
$46.12
|
PP = $47.82
|
|
MB = $50.21
|
Most Recent Note - 11/15/2017 12:32:39 PM
G - Has not formed a sound base and it is sputtering below its 50 DMA line ($124.98) today, still consolidating since proposing a new Public Offering on 10/26/17. Earnings +19% on +18% sales revenues for the Jun '17 quarter were below the +25% minimum earnings guideline (C criteria), raising fundamental concerns.
>>> FEATURED STOCK ARTICLE : Testing 50-Day Moving Average Line After Proposed Offering - 11/2/2017 |
View all notes |
Set NEW NOTE alert |
Company Profile |
SEC
News |
Chart |
Request a new note
C
A
S
I |
LMAT
-
NASDAQ
Lemaitre Vascular Inc
Medical-Products
|
$34.56
|
-0.55
-1.57% |
$35.11
|
201,445
97.32% of 50 DAV
50 DAV is 207,000
|
$39.88
-13.34%
|
7/28/2017
|
$33.50
|
PP = $33.32
|
|
MB = $34.99
|
Most Recent Note - 11/15/2017 6:20:32 PM
G - Its Relative Strength rating has improved to 85, above the 80+ minimum guideline for buy candidates. A rebound above the 50 DMA line ($36.39) is needed for its outlook to improve. Losses below the 200 DMA line and recent low would raise greater concerns. See the latest FSU analysis for more details and a new annotated graph.
>>> FEATURED STOCK ARTICLE : Halted Slide After Damaging 50-Day Moving Average Breach - 11/15/2017 |
View all notes |
Set NEW NOTE alert |
Company Profile |
SEC
News |
Chart |
Request a new note
C
A
S
I |
PATK
-
NASDAQ
Patrick Industries Inc
Bldg-Mobile/Mfg and RV
|
$90.65
|
+0.35
0.39% |
$91.88
|
86,292
105.23% of 50 DAV
50 DAV is 82,000
|
$96.25
-5.82%
|
10/26/2017
|
$90.90
|
PP = $87.90
|
|
MB = $92.30
|
Most Recent Note - 11/16/2017 5:51:23 PM
Y - Posted a solid gain today. Found support when recently consolidating near prior highs in the $86-87 area. Its 50 DMA line ($84.41) also defines near-term support to watch. Fundamentals remain strong.
>>> FEATURED STOCK ARTICLE : Volume 4 Times Average Behind Breakout Gain on Earnings News - 10/26/2017 |
View all notes |
Set NEW NOTE alert |
Company Profile |
SEC
News |
Chart |
Request a new note
C
A
S
I |
ESNT
-
NYSE
Essent Group Ltd
Finance-MrtgandRel Svc
|
$44.80
|
-0.07
-0.16% |
$45.08
|
925,944
100.98% of 50 DAV
50 DAV is 917,000
|
$45.22
-0.93%
|
10/9/2017
|
$39.75
|
PP = $41.54
|
|
MB = $43.62
|
Most Recent Note - 11/16/2017 12:41:35 PM
G - Its 50 DMA line ($41.23) and recent low ($39.79 on 11/03/17) define important near-term support to watch on pullbacks. Fundamentals remain strong. Color code is changed to green after rallying above its "max buy" level and hitting a new all-time high.
>>> FEATURED STOCK ARTICLE : Perched Near High After Streak of Gains - 10/24/2017 |
View all notes |
Set NEW NOTE alert |
Company Profile |
SEC
News |
Chart |
Request a new note
C
A
S
I |
FIVE
-
NASDAQ
Five Below Inc
Retail-DiscountandVariety
|
$59.90
|
+0.75
1.27% |
$60.12
|
698,124
98.19% of 50 DAV
50 DAV is 711,000
|
$59.62
0.47%
|
10/6/2017
|
$57.13
|
PP = $54.23
|
|
MB = $56.94
|
Most Recent Note - 11/13/2017 3:51:48 PM
G - Color code is changed to green after quietly rising above its "max buy" level today and hitting another new all-time high. Prior highs and its 50 DMA line define support in the $54 area.
>>> FEATURED STOCK ARTICLE : Prior Highs Define Important Support While Consolidating - 10/31/2017 |
View all notes |
Set NEW NOTE alert |
Company Profile |
SEC
News |
Chart |
Request a new note
C
A
S
I |
Symbol/Exchange
Company Name
Industry Group |
PRICE |
CHANGE
(%Change) |
Day High |
Volume
(% DAV)
(% 50 day avg vol) |
52 Wk Hi
% From Hi |
Featured
Date |
Price
Featured |
Pivot Featured |
|
Max Buy |
OLED
-
NASDAQ
Universal Display Corp
Elec-Misc Products
|
$181.00
|
+1.75
0.98% |
$182.65
|
712,879
78.51% of 50 DAV
50 DAV is 908,000
|
$179.90
0.61%
|
8/31/2017
|
$128.22
|
PP = $127.78
|
|
MB = $134.17
|
 Most Recent Note - 11/17/2017 5:47:26 PM
G - Hit another new all-time high with today's gain on light volume, very extended from any sound base pattern. Prior highs in the $145 area and its 50 DMA line ($141) define important near-term support to watch on pullbacks. See the latest FSU analysis for more details and a new annotated graph.
>>> FEATURED STOCK ARTICLE : Electronic Products Firm Perched at Record High - 11/17/2017 |
View all notes |
Set NEW NOTE alert |
Company Profile |
SEC
News |
Chart |
Request a new note
C
A
S
I |
ANET
-
NYSE
Arista Networks Inc
TELECOMMUNICATIONS - Communication Equipment
|
$233.82
|
+2.05
0.88% |
$234.63
|
581,189
76.07% of 50 DAV
50 DAV is 764,000
|
$233.34
0.21%
|
10/27/2017
|
$195.65
|
PP = $196.37
|
|
MB = $206.19
|
Most Recent Note - 11/16/2017 5:40:38 PM
G - Rallied further into new high territory today, getting very extended from the previously noted base. Prior highs in the $196 area and its 50 DMA line ($193) define near-term support to watch on pullbacks.
>>> FEATURED STOCK ARTICLE : Perched at Record High Following Volume-Driven Gains - 11/9/2017 |
View all notes |
Set NEW NOTE alert |
Company Profile |
SEC
News |
Chart |
Request a new note
C
A
S
I |
GRUB
-
NYSE
Grubhub Inc
COMPUTER SOFTWARE and SERVICES - Technical and System Software
|
$64.70
|
+0.19
0.29% |
$64.99
|
631,424
35.49% of 50 DAV
50 DAV is 1,779,000
|
$64.87
-0.26%
|
6/21/2017
|
$47.33
|
PP = $46.94
|
|
MB = $49.29
|
Most Recent Note - 11/13/2017 3:55:16 PM
G - Hitting another new all-time high today, adding to recent gains lacking great volume conviction, getting extended from any sound base. Reported Sep '17 quarterly earnings +22% on +32% sales revenues. The 2 latest quarters were below the +25% minimum earnings guideline (C criteria), raising fundamental concerns with regard to the fact-based investment system.
>>> FEATURED STOCK ARTICLE : Technical Strength in Popular Internet Platform - 10/27/2017 |
View all notes |
Set NEW NOTE alert |
Company Profile |
SEC
News |
Chart |
Request a new note
C
A
S
I |
IBP
-
NYSE
Installed Building Prod
DIVERSIFIED SERVICES - Business/Management Services
|
$69.00
|
+0.20
0.29% |
$70.20
|
124,600
66.28% of 50 DAV
50 DAV is 188,000
|
$70.25
-1.78%
|
9/19/2017
|
$59.15
|
PP = $60.10
|
|
MB = $63.11
|
Most Recent Note - 11/14/2017 12:46:32 PM
G - Rebounded above its 50 DMA line ($63.21) helping its outlook improve. Color code is changed to green after rising back above its "max buy" level. Subsequent losses below the recent low ($59.84 on 11/08/17) would raise more serious concerns.
>>> FEATURED STOCK ARTICLE : 50-Day Moving Average Violation Triggered Technical Sell Signal - 11/7/2017 |
View all notes |
Set NEW NOTE alert |
Company Profile |
SEC
News |
Chart |
Request a new note
C
A
S
I |
HQY
-
NASDAQ
"HealthEquity, Inc"
COMPUTER SOFTWARE and SERVICES - Healthcare Information Service
|
$50.17
|
-0.57
-1.12% |
$51.83
|
238,743
48.80% of 50 DAV
50 DAV is 489,200
|
$55.31
-9.29%
|
11/6/2017
|
$54.63
|
PP = $52.87
|
|
MB = $55.51
|
Most Recent Note - 11/14/2017 5:39:28 PM
Y - Abruptly retreated back into the prior base, raising concerns after a recent breakout. Disciplined investors always limit losses by selling any stock that falls more than -7% from their purchase price. Tested and found support at its 50 DMA line ($49.23). Three of the past 4 quarterly comparisons through Jul '17 were above the +25% minimum earnings guideline (C criteria).
>>> FEATURED STOCK ARTICLE : Hit New High With Big Volume-Driven Gain - 11/6/2017 |
View all notes |
Set NEW NOTE alert |
Company Profile |
SEC
News |
Chart |
Request a new note
C
A
S
I |
Symbol/Exchange
Company Name
Industry Group |
PRICE |
CHANGE
(%Change) |
Day High |
Volume
(% DAV)
(% 50 day avg vol) |
52 Wk Hi
% From Hi |
Featured
Date |
Price
Featured |
Pivot Featured |
|
Max Buy |
OLLI
-
NASDAQ
Ollie's Bargain Outlet
Retail-DiscountandVariety
|
$46.00
|
+1.10
2.45% |
$46.30
|
603,535
136.55% of 50 DAV
50 DAV is 442,000
|
$46.90
-1.92%
|
9/8/2017
|
$45.20
|
PP = $46.18
|
|
MB = $48.49
|
Most Recent Note - 11/16/2017 5:49:39 PM
G - Rebounded near its 50 DMA line, but convincing gains above that important short-term average ($45.20) are needed for its outlook to improve. Prior low ($41.30 on 8/31/17) defines the next important support level where further deterioration would raise more serious concerns.
>>> FEATURED STOCK ARTICLE : Sell Signal Triggered by 50-Day Moving Average Violation on Higher Volume - 10/30/2017 |
View all notes |
Set NEW NOTE alert |
Company Profile |
SEC
News |
Chart |
Request a new note
C
A
S
I |
HLI
-
NYSE
Houlihan Lokey Inc Cl A
Finance-Invest Bnk/Bkrs
|
$42.41
|
+0.04
0.09% |
$42.67
|
257,985
90.84% of 50 DAV
50 DAV is 284,000
|
$44.15
-3.94%
|
9/18/2017
|
$37.04
|
PP = $39.78
|
|
MB = $41.77
|
Most Recent Note - 11/16/2017 5:37:16 PM
G - Hovering above its "max buy" level and near its all-time high, extended from any sound base. On 10/26/17 it priced a Secondary Offering. Fundamentals remain strong. See the latest FSU analysis for more details and a new annotated graph.
>>> FEATURED STOCK ARTICLE : Holding Ground Near Record High - 11/16/2017 |
View all notes |
Set NEW NOTE alert |
Company Profile |
SEC
News |
Chart |
Request a new note
C
A
S
I |
ICHR
-
NASDAQ
Ichor Holdings Ltd
ELECTRONICS - Semiconductor Equipment
|
$28.13
|
-0.68
-2.36% |
$29.45
|
1,970,805
230.50% of 50 DAV
50 DAV is 855,000
|
$35.51
-20.78%
|
10/10/2017
|
$29.39
|
PP = $28.36
|
|
MB = $29.78
|
Most Recent Note - 11/16/2017 5:46:41 PM
Y - Color code is changed to yellow after a rebound above its 50 DMA line ($28.38) with today's volume-driven gain helping its outlook improve. Subsequent losses below the recent low ($26.07 on 11/13/17) would raise more serious concerns.
>>> FEATURED STOCK ARTICLE : Undercut Prior Highs and Tested 50-Day Moving Average Line - 11/3/2017 |
View all notes |
Set NEW NOTE alert |
Company Profile |
SEC
News |
Chart |
Request a new note
C
A
S
I |
|
|
|
THESE ARE NOT BUY RECOMMENDATIONS!
Comments contained in the body of this report are technical
opinions only. The material herein has been obtained
from sources believed to be reliable and accurate, however,
its accuracy and completeness cannot be guaranteed.
This site is not an investment advisor, hence it does
not endorse or recommend any securities or other investments.
Any recommendation contained in this report may not
be suitable for all investors and it is not to be deemed
an offer or solicitation on our part with respect to
the purchase or sale of any securities. All trademarks,
service marks and trade names appearing in this report
are the property of their respective owners, and are
likewise used for identification purposes only.
This report is a service available
only to active Paid Premium Members.
You may opt-out of receiving report notifications
at any time. Questions or comments may be submitted
by writing to Premium Membership Services 665 S.E. 10 Street, Suite 201 Deerfield Beach, FL 33441-5634 or by calling 1-800-965-8307
or 954-785-1121.
|
|
|