***Last / Change / Volume data in this table is the closing quote data***
Symbol/Exchange
Company Name
Industry Group |
PRICE |
CHANGE
(%Change) |
Day High |
Volume
(% DAV)
(% 50 day avg vol) |
52 Wk Hi
% From Hi |
Featured
Date |
Price
Featured |
Pivot Featured |
|
Max Buy |
THO
-
NYSE
Thor Industries Inc
AUTOMOTIVE - Recreational Vehicles
|
$136.90
|
-0.71
-0.52% |
$137.80
|
473,579
69.34% of 50 DAV
50 DAV is 683,000
|
$138.07
-0.85%
|
8/14/2017
|
$106.67
|
PP = $110.01
|
|
MB = $115.51
|
 Most Recent Note - 11/22/2017 4:07:25 PM
G - Perched within close striking distance of its all-time high, extended from the previously noted base. Its 50 DMA line ($128) and recent low ($127.29 on 11/08/17) define near-term support to watch. Fundamentals remain strong.
>>> FEATURED STOCK ARTICLE : Encountered Distributional Pressure After Getting Extended From Base - 11/10/2017 |
View all notes |
Set NEW NOTE alert |
Company Profile |
SEC
News |
Chart |
Request a new note
C
A
S
I |
PFBC
-
NASDAQ
Preferred Bank Los Angls
BANKING - Regional - Pacific Banks
|
$60.52
|
-0.90
-1.47% |
$61.74
|
37,081
25.05% of 50 DAV
50 DAV is 148,000
|
$66.58
-9.10%
|
10/10/2017
|
$59.38
|
PP = $59.08
|
|
MB = $62.03
|
Most Recent Note - 11/22/2017 3:59:51 PM
Y - Consolidating above its 50 DMA line ($58.95) after finding prompt support near that important short-term average.
>>> FEATURED STOCK ARTICLE : Slump Back Into Prior Base Raised Concerns - 11/8/2017 |
View all notes |
Set NEW NOTE alert |
Company Profile |
SEC
News |
Chart |
Request a new note
C
A
S
I |
AVGO
-
NASDAQ
Broadcom Limited
ELECTRONICS - Semiconductor - Broad Line
|
$275.37
|
-1.22
-0.44% |
$277.71
|
1,862,787
60.72% of 50 DAV
50 DAV is 3,068,000
|
$281.80
-2.28%
|
10/30/2017
|
$261.19
|
PP = $259.46
|
|
MB = $272.43
|
Most Recent Note - 11/20/2017 7:47:27 PM
G - Color code is changed to green after rising back above its "max buy" level with today's gain on near average volume. Found support while quietly consolidating above prior highs in the $259 area and above its 50 DMA line ($252). Fundamentals remain strong. Pulled back from its all-time high following 11/06/17 news it made a bid for Qualcomm Inc (QCOM).
>>> FEATURED STOCK ARTICLE : Consolidating Near Record High Following Volume-Driven Gains - 11/13/2017 |
View all notes |
Set NEW NOTE alert |
Company Profile |
SEC
News |
Chart |
Request a new note
C
A
S
I |
YY
-
NASDAQ
YY Inc Ads
INTERNET - Internet Service Providers
|
$121.62
|
+2.82
2.37% |
$122.46
|
1,331,012
82.36% of 50 DAV
50 DAV is 1,616,000
|
$123.48
-1.51%
|
9/25/2017
|
$80.26
|
PP = $83.10
|
|
MB = $87.26
|
Most Recent Note - 11/21/2017 1:20:48 PM
G - Hitting another new all-time high with today's gain, getting very extended from any sound base. Disciplined investors avoid chasing stocks that are extended more than +5% above a prior high or pivot point. Reported Sep '17 quarterly earnings +42% on +49% sales revenues. Found support when consolidating above its 50 DMA line ($89.28).
>>> FEATURED STOCK ARTICLE : Chinese Social Media Firm Reported Earnings - 11/14/2017 |
View all notes |
Set NEW NOTE alert |
Company Profile |
SEC
News |
Chart |
Request a new note
C
A
S
I |
STMP
-
NASDAQ
Stamps.com Inc
INTERNET - Internet Software and Services
|
$176.65
|
+0.65
0.37% |
$177.75
|
185,211
41.71% of 50 DAV
50 DAV is 444,000
|
$233.13
-24.23%
|
9/11/2017
|
$193.65
|
PP = $220.35
|
|
MB = $231.37
|
Most Recent Note - 11/20/2017 7:53:28 PM
G - Its Relative Strength rating has slumped to 81. Recently holding its ground above its 200 DMA line ($158), it halted its slide since its gap down on 11/03/17 for a damaging volume-driven loss. Fundamentals remain strong. A rebound above the 50 DMA line ($204.94) is needed for its outlook to improve.
>>> FEATURED STOCK ARTICLE : Perched Near Record High Ahead of Earnings News - 11/1/2017 |
View all notes |
Set NEW NOTE alert |
Company Profile |
SEC
News |
Chart |
Request a new note
C
A
S
I |
Symbol/Exchange
Company Name
Industry Group |
PRICE |
CHANGE
(%Change) |
Day High |
Volume
(% DAV)
(% 50 day avg vol) |
52 Wk Hi
% From Hi |
Featured
Date |
Price
Featured |
Pivot Featured |
|
Max Buy |
HTHT
-
NASDAQ
China Lodging Group Ads
LEISURE - Lodging
|
$123.22
|
+0.67
0.55% |
$123.60
|
233,923
52.57% of 50 DAV
50 DAV is 445,000
|
$142.80
-13.71%
|
9/29/2016
|
$46.12
|
PP = $47.82
|
|
MB = $50.21
|
Most Recent Note - 11/22/2017 4:02:19 PM
G - Has not formed a sound base, and recently sputtering below its 50 DMA line ($126) since proposing a new Public Offering on 10/26/17. Earnings +19% on +18% sales revenues for the Jun '17 quarter were below the +25% minimum earnings guideline (C criteria), raising fundamental concerns.
>>> FEATURED STOCK ARTICLE : Testing 50-Day Moving Average Line After Proposed Offering - 11/2/2017 |
View all notes |
Set NEW NOTE alert |
Company Profile |
SEC
News |
Chart |
Request a new note
C
A
S
I |
LMAT
-
NASDAQ
Lemaitre Vascular Inc
Medical-Products
|
$34.35
|
-0.38
-1.09% |
$35.06
|
64,369
31.10% of 50 DAV
50 DAV is 207,000
|
$39.88
-13.87%
|
7/28/2017
|
$33.50
|
PP = $33.32
|
|
MB = $34.99
|
Most Recent Note - 11/22/2017 3:56:32 PM
G - A rebound above the 50 DMA line ($36.06) is needed for its outlook to improve. Its Relative Strength rating of 82 is above the 80+ minimum guideline for buy candidates. Losses below the 200 DMA line and recent low would raise greater concerns.
>>> FEATURED STOCK ARTICLE : Halted Slide After Damaging 50-Day Moving Average Breach - 11/15/2017 |
View all notes |
Set NEW NOTE alert |
Company Profile |
SEC
News |
Chart |
Request a new note
C
A
S
I |
PATK
-
NASDAQ
Patrick Industries Inc
Bldg-Mobile/Mfg and RV
|
$94.20
|
-0.30
-0.32% |
$96.75
|
63,921
77.01% of 50 DAV
50 DAV is 83,000
|
$96.25
-2.13%
|
10/26/2017
|
$90.90
|
PP = $87.90
|
|
MB = $92.30
|
Most Recent Note - 11/21/2017 6:17:53 PM
Y - Posted a 4th consecutive gain today for a best-ever close. Prior highs in the $86-87 area and its 50 DMA line ($85.51) define important near-term support to watch. Fundamentals remain strong. See the latest FSU analysis for more details and a new annotated graph.
>>> FEATURED STOCK ARTICLE : Best Ever Close After Pullback Found Support Near Prior High - 11/21/2017 |
View all notes |
Set NEW NOTE alert |
Company Profile |
SEC
News |
Chart |
Request a new note
C
A
S
I |
ESNT
-
NYSE
Essent Group Ltd
Finance-MrtgandRel Svc
|
$44.70
|
-0.18
-0.40% |
$45.05
|
562,237
61.65% of 50 DAV
50 DAV is 912,000
|
$45.23
-1.17%
|
10/9/2017
|
$39.75
|
PP = $41.54
|
|
MB = $43.62
|
Most Recent Note - 11/20/2017 7:43:41 PM
G - Its 50 DMA line ($41.55) and recent low ($39.79 on 11/03/17) define important near-term support to watch on pullbacks. Recent consolidation was too brief to be recognized as a valid new base. Fundamentals remain strong. See the latest FSU analysis for more details and a new annotated graph.
>>> FEATURED STOCK ARTICLE : Recent Consolidation Was Not a Sufficient Length New Base - 11/20/2017 |
View all notes |
Set NEW NOTE alert |
Company Profile |
SEC
News |
Chart |
Request a new note
C
A
S
I |
FIVE
-
NASDAQ
Five Below Inc
Retail-DiscountandVariety
|
$59.00
|
-0.07
-0.12% |
$59.65
|
407,885
55.80% of 50 DAV
50 DAV is 731,000
|
$60.12
-1.86%
|
10/6/2017
|
$57.13
|
PP = $54.23
|
|
MB = $56.94
|
Most Recent Note - 11/21/2017 12:52:03 PM
G - Hovering near its all-time high, extended from its prior base. Its 50 DMA line ($55.34) and prior low ($54.71 on 10/27/17) define near-term support to watch on pullbacks.
>>> FEATURED STOCK ARTICLE : Prior Highs Define Important Support While Consolidating - 10/31/2017 |
View all notes |
Set NEW NOTE alert |
Company Profile |
SEC
News |
Chart |
Request a new note
C
A
S
I |
Symbol/Exchange
Company Name
Industry Group |
PRICE |
CHANGE
(%Change) |
Day High |
Volume
(% DAV)
(% 50 day avg vol) |
52 Wk Hi
% From Hi |
Featured
Date |
Price
Featured |
Pivot Featured |
|
Max Buy |
OLED
-
NASDAQ
Universal Display Corp
Elec-Misc Products
|
$189.60
|
+3.10
1.66% |
$189.90
|
910,979
103.05% of 50 DAV
50 DAV is 884,000
|
$186.55
1.63%
|
8/31/2017
|
$128.22
|
PP = $127.78
|
|
MB = $134.17
|
Most Recent Note - 11/22/2017 4:06:04 PM
G - Hit yet another new all-time high with today's 5th consecutive gain on lighter than average volume, getting very extended from any sound base pattern. Prior highs in the $145 area coincide with its 50 DMA line defining important near-term support to watch on pullbacks.
>>> FEATURED STOCK ARTICLE : Electronic Products Firm Perched at Record High - 11/17/2017 |
View all notes |
Set NEW NOTE alert |
Company Profile |
SEC
News |
Chart |
Request a new note
C
A
S
I |
ANET
-
NYSE
Arista Networks Inc
TELECOMMUNICATIONS - Communication Equipment
|
$239.01
|
-2.42
-1.00% |
$243.36
|
611,884
77.75% of 50 DAV
50 DAV is 787,000
|
$245.65
-2.70%
|
10/27/2017
|
$195.65
|
PP = $196.37
|
|
MB = $206.19
|
Most Recent Note - 11/22/2017 4:04:00 PM
G - Perched at its all time high today, very extended from the previously noted base. Its 50 DMA line ($198.90) and prior highs in the $196 area define near-term support to watch on pullbacks.
>>> FEATURED STOCK ARTICLE : Perched at Record High Following Volume-Driven Gains - 11/9/2017 |
View all notes |
Set NEW NOTE alert |
Company Profile |
SEC
News |
Chart |
Request a new note
C
A
S
I |
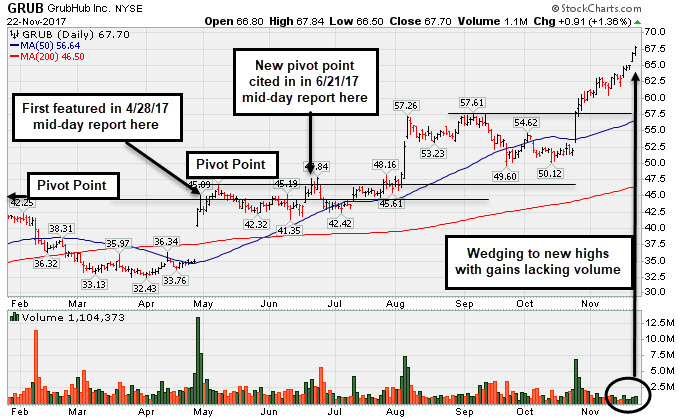
GRUB
-
NYSE
Grubhub Inc
COMPUTER SOFTWARE and SERVICES - Technical and System Software
|
$67.70
|
+0.91
1.36% |
$67.84
|
1,108,551
65.48% of 50 DAV
50 DAV is 1,693,000
|
$66.99
1.06%
|
6/21/2017
|
$47.33
|
PP = $46.94
|
|
MB = $49.29
|
Most Recent Note - 11/22/2017 5:05:55 PM
G - Extended from any sound base after wedging higher with gains lacking great volume conviction. Prior highs and its 50 DMA line define support near $57. Reported Sep '17 quarterly earnings +22% on +32% sales revenues. The 2 latest quarters were below the +25% minimum earnings guideline (C criteria), raising fundamental concerns with regard to the fact-based investment system. See the latest FSU analysis for more details and a new annotated graph.
>>> FEATURED STOCK ARTICLE : Extended From Prior Highs After Gains on Light Volume - 11/22/2017 |
View all notes |
Set NEW NOTE alert |
Company Profile |
SEC
News |
Chart |
Request a new note
C
A
S
I |
IBP
-
NYSE
Installed Building Prod
DIVERSIFIED SERVICES - Business/Management Services
|
$73.65
|
+1.10
1.52% |
$75.05
|
199,450
103.88% of 50 DAV
50 DAV is 192,000
|
$72.60
1.45%
|
9/19/2017
|
$59.15
|
PP = $60.10
|
|
MB = $63.11
|
Most Recent Note - 11/21/2017 6:14:29 PM
G - Rallied to another new all-time high with today's 6th consecutive gain, getting more extended from any sound base. The 50 DMA line ($64.47) and recent low ($59.84 on 11/08/17) define important near-term support to watch on pullbacks.
>>> FEATURED STOCK ARTICLE : 50-Day Moving Average Violation Triggered Technical Sell Signal - 11/7/2017 |
View all notes |
Set NEW NOTE alert |
Company Profile |
SEC
News |
Chart |
Request a new note
C
A
S
I |
HQY
-
NASDAQ
"HealthEquity, Inc"
COMPUTER SOFTWARE and SERVICES - Healthcare Information Service
|
$50.90
|
-0.41
-0.80% |
$51.95
|
257,084
54.41% of 50 DAV
50 DAV is 472,500
|
$55.31
-7.97%
|
11/6/2017
|
$54.63
|
PP = $52.87
|
|
MB = $55.51
|
Most Recent Note - 11/21/2017 6:16:05 PM
Y - Found prompt support at its 50 DMA line ($49.78) after abruptly retreating back into the prior base, raising concerns after a recent breakout. Disciplined investors always limit losses by selling any stock that falls more than -7% from their purchase price. Three of the past 4 quarterly comparisons through Jul '17 were above the +25% minimum earnings guideline (C criteria).
>>> FEATURED STOCK ARTICLE : Hit New High With Big Volume-Driven Gain - 11/6/2017 |
View all notes |
Set NEW NOTE alert |
Company Profile |
SEC
News |
Chart |
Request a new note
C
A
S
I |
Symbol/Exchange
Company Name
Industry Group |
PRICE |
CHANGE
(%Change) |
Day High |
Volume
(% DAV)
(% 50 day avg vol) |
52 Wk Hi
% From Hi |
Featured
Date |
Price
Featured |
Pivot Featured |
|
Max Buy |
OLLI
-
NASDAQ
Ollie's Bargain Outlet
Retail-DiscountandVariety
|
$46.85
|
-0.15
-0.32% |
$47.50
|
376,368
83.82% of 50 DAV
50 DAV is 449,000
|
$47.20
-0.74%
|
11/21/2017
|
$46.78
|
PP = $47.00
|
|
MB = $49.35
|
Most Recent Note - 11/21/2017 1:06:43 PM
Y - Color code is changed to yellow with new pivot point cited based on its 10/05/17 high plus 10 cents. A gain above the pivot point backed by at least +40% above average volume may trigger a new (or add-on) technical buy signal. Rebounded above its 50 DMA line with convincing volume-driven gains helping its outlook to improve. Prior lows in the $41-42 defines the next important support level where further deterioration would raise more serious concerns.
>>> FEATURED STOCK ARTICLE : Sell Signal Triggered by 50-Day Moving Average Violation on Higher Volume - 10/30/2017 |
View all notes |
Set NEW NOTE alert |
Company Profile |
SEC
News |
Chart |
Request a new note
C
A
S
I |
HLI
-
NYSE
Houlihan Lokey Inc Cl A
Finance-Invest Bnk/Bkrs
|
$43.99
|
-0.20
-0.45% |
$44.39
|
122,741
45.63% of 50 DAV
50 DAV is 269,000
|
$44.43
-0.99%
|
9/18/2017
|
$37.04
|
PP = $39.78
|
|
MB = $41.77
|
Most Recent Note - 11/20/2017 7:51:31 PM
G - Posted a gain today on below average volume yet managed a best-ever close while challenging its all-time high. It is extended from any sound base. On 10/26/17 it priced a Secondary Offering. Fundamentals remain strong. See the latest FSU analysis for more details and an annotated graph.
>>> FEATURED STOCK ARTICLE : Holding Ground Near Record High - 11/16/2017 |
View all notes |
Set NEW NOTE alert |
Company Profile |
SEC
News |
Chart |
Request a new note
C
A
S
I |
ICHR
-
NASDAQ
Ichor Holdings Ltd
ELECTRONICS - Semiconductor Equipment
|
$29.52
|
-2.83
-8.75% |
$32.99
|
2,534,276
269.89% of 50 DAV
50 DAV is 939,000
|
$35.51
-16.87%
|
10/10/2017
|
$29.39
|
PP = $28.36
|
|
MB = $29.78
|
Most Recent Note - 11/22/2017 3:54:10 PM
Y - Color code is changed to yellow after slumping below its "max buy" level with today's volume-driven loss. Its 50 DMA line ($28.91) and recent low ($26.07 on 11/13/17) define near-term support to watch where violations would raise more serious concerns.
>>> FEATURED STOCK ARTICLE : Undercut Prior Highs and Tested 50-Day Moving Average Line - 11/3/2017 |
View all notes |
Set NEW NOTE alert |
Company Profile |
SEC
News |
Chart |
Request a new note
C
A
S
I |