You are not logged in.
This means you
CAN ONLY VIEW reports that were published prior to Thursday, March 20, 2025.
You
MUST UPGRADE YOUR MEMBERSHIP if you want to see any current reports.
AFTER MARKET UPDATE - FRIDAY, NOVEMBER 10TH, 2017
Previous After Market Report Next After Market Report >>>
|
|
|
|
DOW |
-39.73 |
23,422.21 |
-0.17% |
|
Volume |
853,284,800 |
-4% |
|
Volume |
1,977,160,407 |
-11% |
|
NASDAQ |
+0.89 |
6,750.94 |
+0.01% |
|
Advancers |
1,291 |
45% |
|
Advancers |
1,431 |
52% |
|
S&P 500 |
-2.32 |
2,582.30 |
-0.09% |
|
Decliners |
1,606 |
55% |
|
Decliners |
1,301 |
48% |
|
Russell 2000 |
+0.26 |
1,475.27 |
+0.02% |
|
52 Wk Highs |
74 |
|
|
52 Wk Highs |
76 |
|
|
S&P 600 |
+0.61 |
893.77 |
+0.07% |
|
52 Wk Lows |
59 |
|
|
52 Wk Lows |
60 |
|
|
 |
Indices Ended Quietly Lower With Less Leadership
Kenneth J. Gruneisen - Passed the CAN SLIM® Master's Exam
For the week, the S&P 500 fell 0.2%, while the Dow lost 0.5%, and the Nasdaq declined 0.2%. Stocks were slightly lower Friday. The Dow fell 39 points to 23422. The S&P 500 lost 2 points to 2582. The Nasdaq Composite was flat at 6750. Volume totals reported were lighter than the prior session totals on the NYSE and on the Nasdaq exchange. Decliners led advancers by almost a 4-3 margin on the NYSE, yet advancers narrowly outnumbered decliners on the Nasdaq exchange. There were 29 high-ranked companies from the Leaders List that made new 52-week highs and were listed on the BreakOuts Page, versus the total of 22 on the prior session. New 52-week highs outnumbered new 52-week lows totals on the NYSE and on the Nasdaq exchange. The Featured Stocks Page provides the latest analysis on noteworthy high-ranked leaders. Charts used courtesy of www.stockcharts.com
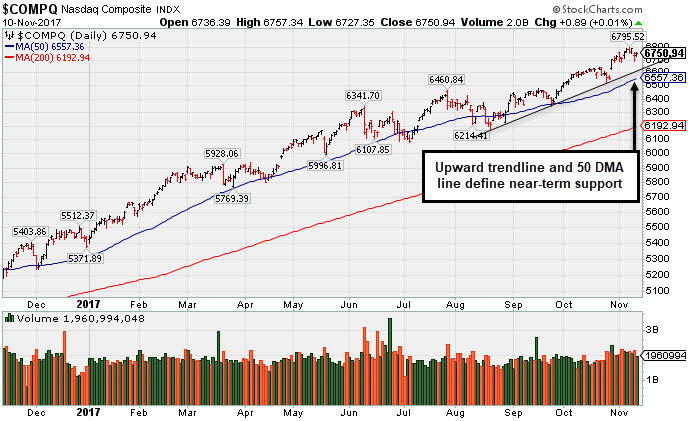 PICTURED: The Nasdaq Composite Index is consolidating above an upward trendline and its 50-day moving average (DMA) line defining near-term support to watch.
Leadership has recently been waning, however, the major averages (M criteria) are still in a confirmed uptrend. Investors should only consider stocks meeting all key criteria of the fact-based investment system as they trigger technical buy signals.
The major averages rebounded from early session lows and ended the day little changed as investors remained concerned on the prospects of the GOP tax reform. A Wall Street Journal report stated there could be potential delays in the tax bills timeline as the House and Senate work to reconcile the key differences in their respective proposals. On the economic front, the University of Michigan revealed consumer sentiment unexpectedly dropped in November to 97.8 well below the previous month’s reading of 100.7.
Seven of 11 S&P 500 sectors were lower on the session. Healthcare was a notable decliner as shares of Medtronic (MDT -1.83%) and Merck (MRK --1.30%) fell. In earnings news, chipmaker Nvidia (NVDA +5.27%) rose after it easily exceeded consensus profit estimates. Consumer stocks outperformed today as Disney (DIS +2.05%) and News Corp (NWS +5.42%) rose on positive analyst commentary surrounding both companies’ quarterly releases.
Treasuries are lower with the yield on the benchmark 10-year note up seven basis points to 2.40%. In commodities, NYMEX WTI crude dropped 0.6% to $56.83/barrel. COMEX gold is declining 0.9% to $1276.20/ounce. |
 Kenneth J. Gruneisen started out as a licensed stockbroker in August 1987, a couple of months prior to the historic stock market crash that took the Dow Jones Industrial Average down -22.6% in a single day. He has published daily fact-based fundamental and technical analysis on high-ranked stocks online for two decades. Through FACTBASEDINVESTING.COM, Kenneth provides educational articles, news, market commentary, and other information regarding proven investment systems that work in good times and bad.
Comments contained in the body of this report are technical opinions only and are not necessarily those of Gruneisen Growth Corp. The material herein has been obtained from sources believed to be reliable and accurate, however, its accuracy and completeness cannot be guaranteed. Our firm, employees, and customers may effect transactions, including transactions contrary to any recommendation herein, or have positions in the securities mentioned herein or options with respect thereto. Any recommendation contained in this report may not be suitable for all investors and it is not to be deemed an offer or solicitation on our part with respect to the purchase or sale of any securities. |
|
 |
Semiconductor, Networking, and Retail Indexes Posted Small Gains
Kenneth J. Gruneisen - Passed the CAN SLIM® Master's Exam
The Retail Index ($RLX +0.22%) posted a modest gain, meanwhile the Broker/Dealer Index ($XBD +0.03%) finished flat and the Bank Index ($BKX -0.41%) fell. The tech sector saw modest gains from the Networking Index ($NWX +0.76%) and the Semiconductor Index ($SOX +0.65%) but the Biotechnology Index ($BTK -0.64%) fell. The Integrated Oil Index ($XOI -0.46%) and the Oil Services Index ($OSX -0.87%) both edged lower. Charts courtesy www.stockcharts.com
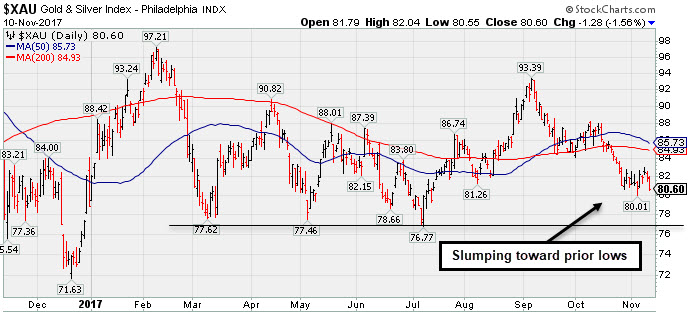 PICTURED: The Gold & Silver Index ($XAU -1.56%) has been slumping toward prior lows.
| Oil Services |
$OSX |
140.98 |
-1.23 |
-0.86% |
-23.29% |
| Integrated Oil |
$XOI |
1,276.03 |
-5.92 |
-0.46% |
+0.63% |
| Semiconductor |
$SOX |
1,303.06 |
+8.40 |
+0.65% |
+43.75% |
| Networking |
$NWX |
461.94 |
+3.48 |
+0.76% |
+3.55% |
| Broker/Dealer |
$XBD |
244.84 |
+0.07 |
+0.03% |
+19.27% |
| Retail |
$RLX |
1,596.01 |
+3.44 |
+0.22% |
+18.84% |
| Gold & Silver |
$XAU |
80.60 |
-1.28 |
-1.56% |
+2.21% |
| Bank |
$BKX |
97.59 |
-0.40 |
-0.41% |
+6.32% |
| Biotech |
$BTK |
4,088.06 |
-26.38 |
-0.64% |
+32.94% |
|
|
|
 |
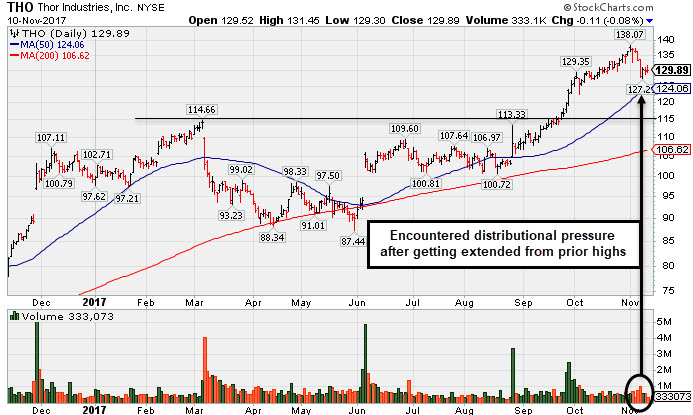
Encountered Distributional Pressure After Getting Extended From Base
Kenneth J. Gruneisen - Passed the CAN SLIM® Master's Exam
Thor Industries Inc (THO -$0.11 or -0.08% to $129.89) encountered some distributional pressure in recent weeks after wedging to new all-time highs with gains lacking great volume conviction. It is still very extended from the previously noted base. Its 50-day moving average (DMA) line ($124.29) defines near-term support above prior highs in the $115 area.
Fundamentals remain strong. It was last shown in this FSU section on 10/13/17 with an annotated graph under the headline, "Extended From Prior Base With Volume Totals Cooling". The Building - Mobile/Mfg & RV firm was highlighted in yellow with pivot point cited based on its 4/27/17 high in the 6/07/17 mid-day report (read here). It had gapped up on 6/06/17, clearing a "double bottom" base while rebounding toward prior highs.
THO reported earnings +44% on +50% sales revenues for the Jul '17 quarter, continuing its strong earnings history. The past 4 quarters were above the +25% minimum earnings guideline (C criteria) of the fact-based investment system. Its annual earnings history (A criteria) has been good. Return on Equity is reported at 26%, well above the 17% minimum guideline.
It has earned a current Timeliness rating of A and a Sponsorship rating of C. The number of top-rated funds owning its shares rose from 489 in Mar '16 to 603 in Sep '17. Its current Up/Down Volume Ratio of 2.4 is an unbiased indication its shares have been under accumulation over the past 50 days (I criteria). Its small supply of only 48.9 million shares (S criteria) in the public float can contribute to greater volatility in the event of institutional buying or selling. |
|
|
Color Codes Explained :
Y - Better candidates highlighted by our
staff of experts.
G - Previously featured
in past reports as yellow but may no longer be buyable under the
guidelines.
***Last / Change / Volume data in this table is the closing quote data***
Symbol/Exchange
Company Name
Industry Group |
PRICE |
CHANGE
(%Change) |
Day High |
Volume
(% DAV)
(% 50 day avg vol) |
52 Wk Hi
% From Hi |
Featured
Date |
Price
Featured |
Pivot Featured |
|
Max Buy |
THO
-
NYSE
Thor Industries Inc
AUTOMOTIVE - Recreational Vehicles
|
$129.89
|
-0.11
-0.08% |
$131.45
|
333,073
48.27% of 50 DAV
50 DAV is 690,000
|
$138.07
-5.92%
|
8/14/2017
|
$106.67
|
PP = $110.01
|
|
MB = $115.51
|
 Most Recent Note - 11/10/2017 4:58:55 PM
G - Still very extended from the previously noted base. Its 50 DMA line ($124.29) defines near-term support above prior highs in the $115 area. Fundamentals remain strong. See the latest FSU analysis for more details and a new annotated graph.
>>> FEATURED STOCK ARTICLE : Encountered Distributional Pressure After Getting Extended From Base - 11/10/2017 |
View all notes |
Set NEW NOTE alert |
Company Profile |
SEC
News |
Chart |
Request a new note
C
A
S
I |
PFBC
-
NASDAQ
Preferred Bank Los Angls
BANKING - Regional - Pacific Banks
|
$57.77
|
+0.12
0.21% |
$58.65
|
63,787
80.64% of 50 DAV
50 DAV is 79,100
|
$66.58
-13.23%
|
10/10/2017
|
$59.38
|
PP = $59.08
|
|
MB = $62.03
|
Most Recent Note - 11/8/2017 5:16:12 PM
Y - Slumped below prior highs in the $60 area raising concerns while completely negating the recent breakout. Its 50 DMA line ($57.56) defines important near-term support where a violation would raise greater concerns. See the latest FSU analysis for more details and a new annotated graph.
>>> FEATURED STOCK ARTICLE : Slump Back Into Prior Base Raised Concerns - 11/8/2017 |
View all notes |
Set NEW NOTE alert |
Company Profile |
SEC
News |
Chart |
Request a new note
C
A
S
I |
AVGO
-
NASDAQ
Broadcom Limited
ELECTRONICS - Semiconductor - Broad Line
|
$264.96
|
-0.68
-0.26% |
$266.64
|
2,015,355
67.49% of 50 DAV
50 DAV is 2,986,000
|
$281.80
-5.98%
|
10/30/2017
|
$261.19
|
PP = $259.46
|
|
MB = $272.43
|
Most Recent Note - 11/6/2017 12:26:28 PM
G - Trading near its "max buy" level, it triggered a new (or add-on) technical buy signal with volume-driven gains noted last week. Churning above average volume today while hitting another new all-time high and reversing into the red following news it made a bid for Qualcomm Inc (QCOM). Its current Relative Strength rating of 86 is above the 80+ minimum guideline for buy candidates. Subsequent losses below the 50 DMA line and recent low ($231.53 on 9/25/17) would raise serious concerns and trigger a more worrisome technical sell signal.
>>> FEATURED STOCK ARTICLE : Slumped Below 50-Day Moving Average Line Again - 10/17/2017 |
View all notes |
Set NEW NOTE alert |
Company Profile |
SEC
News |
Chart |
Request a new note
C
A
S
I |
YY
-
NASDAQ
YY Inc Ads
INTERNET - Internet Service Providers
|
$88.90
|
-1.75
-1.93% |
$90.40
|
549,619
40.62% of 50 DAV
50 DAV is 1,353,000
|
$97.59
-8.90%
|
9/25/2017
|
$80.26
|
PP = $83.10
|
|
MB = $87.26
|
Most Recent Note - 11/7/2017 2:03:11 PM
G - Found support above prior highs in the $83 area and above its 50 DMA line ($84.95) defining important near-term support to watch.
>>> FEATURED STOCK ARTICLE : Extended After Rallying From Base - 10/19/2017 |
View all notes |
Set NEW NOTE alert |
Company Profile |
SEC
News |
Chart |
Request a new note
C
A
S
I |
STMP
-
NASDAQ
Stamps.com Inc
INTERNET - Internet Software and Services
|
$175.00
|
+0.70
0.40% |
$176.25
|
462,852
105.43% of 50 DAV
50 DAV is 439,000
|
$233.13
-24.93%
|
9/11/2017
|
$193.65
|
PP = $220.35
|
|
MB = $231.37
|
Most Recent Note - 11/7/2017 4:22:00 PM
G - A rebound above the 50 DMA line ($207.87) is needed for its outlook to improve. Holding its ground since it gapped down on 11/03/17 with a damaging volume-driven loss. Violated its 50 DMA line and undercut the recent low ($195.05 on 9/28/17) triggering technical sell signals. Fundamentals remain strong.
>>> FEATURED STOCK ARTICLE : Perched Near Record High Ahead of Earnings News - 11/1/2017 |
View all notes |
Set NEW NOTE alert |
Company Profile |
SEC
News |
Chart |
Request a new note
C
A
S
I |
Symbol/Exchange
Company Name
Industry Group |
PRICE |
CHANGE
(%Change) |
Day High |
Volume
(% DAV)
(% 50 day avg vol) |
52 Wk Hi
% From Hi |
Featured
Date |
Price
Featured |
Pivot Featured |
|
Max Buy |
HTHT
-
NASDAQ
China Lodging Group Ads
LEISURE - Lodging
|
$125.97
|
-0.45
-0.36% |
$127.95
|
301,473
70.77% of 50 DAV
50 DAV is 426,000
|
$142.80
-11.79%
|
9/29/2016
|
$46.12
|
PP = $47.82
|
|
MB = $50.21
|
Most Recent Note - 11/7/2017 4:09:56 PM
G - Found support at its 50 DMA line ($123.36) since proposing a new Public Offering on 10/26/17 and enduring distributional pressure. It is very extended from any sound base. Earnings +19% on +18% sales revenues for the Jun '17 quarter were below the +25% minimum earnings guideline (C criteria), raising fundamental concerns.
>>> FEATURED STOCK ARTICLE : Testing 50-Day Moving Average Line After Proposed Offering - 11/2/2017 |
View all notes |
Set NEW NOTE alert |
Company Profile |
SEC
News |
Chart |
Request a new note
C
A
S
I |
LMAT
-
NASDAQ
Lemaitre Vascular Inc
Medical-Products
|
$33.50
|
+0.11
0.33% |
$33.73
|
171,321
81.97% of 50 DAV
50 DAV is 209,000
|
$39.88
-16.00%
|
7/28/2017
|
$33.50
|
PP = $33.32
|
|
MB = $34.99
|
Most Recent Note - 11/7/2017 4:18:22 PM
G - Halted its slide at its 200 DMA line after gapping down and violating its 50 DMA line with a volume-driven loss on 10/27/17 triggering technical sell signals. Its Relative Strength rating has slumped to 78, below the 80+ minimum guideline for buy candidates. A rebound above the 50 DMA line is needed for its outlook to improve. More damaging losses would raise greater concerns. Reported Sep '17 quarterly earnings +47% on +7% sales revenues.
>>> FEATURED STOCK ARTICLE : Consolidating Above 50-Day Moving Average Before Earnings - 10/18/2017 |
View all notes |
Set NEW NOTE alert |
Company Profile |
SEC
News |
Chart |
Request a new note
C
A
S
I |
PATK
-
NASDAQ
Patrick Industries Inc
Bldg-Mobile/Mfg and RV
|
$87.40
|
-0.45
-0.51% |
$90.20
|
51,540
65.24% of 50 DAV
50 DAV is 79,000
|
$96.25
-9.19%
|
10/26/2017
|
$90.90
|
PP = $87.90
|
|
MB = $92.30
|
Most Recent Note - 11/7/2017 3:59:45 PM
Y - Pulling back with 3 consecutive losses on lighter than average volume. Prior highs in the $86-87 area define initial support to watch above its 50 DMA line. Fundamentals remain strong.
>>> FEATURED STOCK ARTICLE : Volume 4 Times Average Behind Breakout Gain on Earnings News - 10/26/2017 |
View all notes |
Set NEW NOTE alert |
Company Profile |
SEC
News |
Chart |
Request a new note
C
A
S
I |
ESNT
-
NYSE
Essent Group Ltd
Finance-MrtgandRel Svc
|
$41.58
|
-0.64
-1.52% |
$42.69
|
806,053
93.51% of 50 DAV
50 DAV is 862,000
|
$45.10
-7.80%
|
10/9/2017
|
$39.75
|
PP = $41.54
|
|
MB = $43.62
|
Most Recent Note - 11/6/2017 12:35:51 PM
Y - Finding prompt support near its 50 DMA line ($40.44) following last week's noted volume-driven losses. More damaging losses would trigger a technical sell signal. Due to report earnings news prior to the open on Thursday, November 9th.
>>> FEATURED STOCK ARTICLE : Perched Near High After Streak of Gains - 10/24/2017 |
View all notes |
Set NEW NOTE alert |
Company Profile |
SEC
News |
Chart |
Request a new note
C
A
S
I |
FIVE
-
NASDAQ
Five Below Inc
Retail-DiscountandVariety
|
$57.53
|
+0.14
0.24% |
$58.14
|
416,042
51.24% of 50 DAV
50 DAV is 812,000
|
$58.34
-1.38%
|
10/6/2017
|
$57.13
|
PP = $54.23
|
|
MB = $56.94
|
Most Recent Note - 11/7/2017 2:08:54 PM
Y - Quietly hovering near its "max buy" level and perched near its all-time high. Stayed above prior highs in the $54 area during its recent consolidation while it stayed well above its 50 DMA line.
>>> FEATURED STOCK ARTICLE : Prior Highs Define Important Support While Consolidating - 10/31/2017 |
View all notes |
Set NEW NOTE alert |
Company Profile |
SEC
News |
Chart |
Request a new note
C
A
S
I |
Symbol/Exchange
Company Name
Industry Group |
PRICE |
CHANGE
(%Change) |
Day High |
Volume
(% DAV)
(% 50 day avg vol) |
52 Wk Hi
% From Hi |
Featured
Date |
Price
Featured |
Pivot Featured |
|
Max Buy |
OLED
-
NASDAQ
Universal Display Corp
Elec-Misc Products
|
$175.90
|
+6.30
3.71% |
$176.50
|
1,188,189
128.04% of 50 DAV
50 DAV is 928,000
|
$170.00
3.47%
|
8/31/2017
|
$128.22
|
PP = $127.78
|
|
MB = $134.17
|
Most Recent Note - 11/10/2017 12:40:08 PM
G - Hitting yet another new high with today's 7th consecutive gain, getting very extended from a riskier "late stage" base pattern. Reported Sep '17 quarterly earnings of 28 cents per share versus a year-ago loss of 3 cents per share on sales revenues +104%. Prior highs in the $145 area and its 50 DMA line ($137) define important near-term support to watch on pullbacks.
>>> FEATURED STOCK ARTICLE : Prior Highs and 50-Day Average Define Near-Term Support - 10/25/2017 |
View all notes |
Set NEW NOTE alert |
Company Profile |
SEC
News |
Chart |
Request a new note
C
A
S
I |
ANET
-
NYSE
Arista Networks Inc
TELECOMMUNICATIONS - Communication Equipment
|
$221.05
|
+7.50
3.51% |
$221.67
|
1,148,586
153.76% of 50 DAV
50 DAV is 747,000
|
$217.92
1.44%
|
10/27/2017
|
$195.65
|
PP = $196.37
|
|
MB = $206.19
|
Most Recent Note - 11/10/2017 12:13:25 PM
G - Rallying further into new high territory today, getting very extended from the previously noted base. See the latest FSU analysis for more details and an annotated graph.
>>> FEATURED STOCK ARTICLE : Perched at Record High Following Volume-Driven Gains - 11/9/2017 |
View all notes |
Set NEW NOTE alert |
Company Profile |
SEC
News |
Chart |
Request a new note
C
A
S
I |
GRUB
-
NYSE
Grubhub Inc
COMPUTER SOFTWARE and SERVICES - Technical and System Software
|
$63.10
|
+1.46
2.37% |
$63.16
|
1,266,258
69.80% of 50 DAV
50 DAV is 1,814,000
|
$63.16
-0.09%
|
6/21/2017
|
$47.33
|
PP = $46.94
|
|
MB = $49.29
|
Most Recent Note - 11/7/2017 4:06:39 PM
G - Quietly holding its ground near its all-time high after impressive volume-driven gains. Rebound above its 50 DMA line ($54.90) helped its outlook improve. Reported Sep '17 quarterly earnings +22% on +32% sales revenues. The 2 latest quarters were below the +25% minimum earnings guideline (C criteria), raising fundamental concerns with regard to the fact-based investment system.
>>> FEATURED STOCK ARTICLE : Technical Strength in Popular Internet Platform - 10/27/2017 |
View all notes |
Set NEW NOTE alert |
Company Profile |
SEC
News |
Chart |
Request a new note
C
A
S
I |
IBP
-
NYSE
Installed Building Prod
DIVERSIFIED SERVICES - Business/Management Services
|
$62.85
|
+2.10
3.46% |
$64.20
|
226,477
130.91% of 50 DAV
50 DAV is 173,000
|
$70.25
-10.53%
|
9/19/2017
|
$59.15
|
PP = $60.10
|
|
MB = $63.11
|
Most Recent Note - 11/7/2017 5:26:59 PM
G - Raised concerns with today's 5th consecutive volume-driven loss and 50 DMA line ($62.54) violation triggering a technical sell signal. Only a prompt rebound above the 50 DMA line would help its outlook improve. Prior highs in the $60 area also define important near-term support to watch. See the latest FSU analysis for more details and a new annotated graph.
>>> FEATURED STOCK ARTICLE : 50-Day Moving Average Violation Triggered Technical Sell Signal - 11/7/2017 |
View all notes |
Set NEW NOTE alert |
Company Profile |
SEC
News |
Chart |
Request a new note
C
A
S
I |
HQY
-
NASDAQ
"HealthEquity, Inc"
COMPUTER SOFTWARE and SERVICES - Healthcare Information Service
|
$49.74
|
-1.03
-2.03% |
$50.63
|
308,206
55.81% of 50 DAV
50 DAV is 552,200
|
$55.31
-10.07%
|
11/6/2017
|
$54.63
|
PP = $52.87
|
|
MB = $55.51
|
Most Recent Note - 11/7/2017 1:51:28 PM
Y - Abruptly retreating back into the prior base with today's volume-driven loss, raising concerns. Disciplined investors always limit losses by selling any stock that falls more than -7% from their purchase price. Highlighted in yellow with new pivot point cited based on its 10/04/17 high in the 11/06/17 mid-day report as it hit a new high with a considerable volume-driven gain triggering a technical buy signal. Recently tested and found support after rebounding above its 50 DMA line ($48.42). Three of the past 4 quarterly comparisons through Jul '17 were above the +25% minimum earnings guideline (C criteria). See the latest FSU analysis for more details and an annotated graph.
>>> FEATURED STOCK ARTICLE : Hit New High With Big Volume-Driven Gain - 11/6/2017 |
View all notes |
Set NEW NOTE alert |
Company Profile |
SEC
News |
Chart |
Request a new note
C
A
S
I |
Symbol/Exchange
Company Name
Industry Group |
PRICE |
CHANGE
(%Change) |
Day High |
Volume
(% DAV)
(% 50 day avg vol) |
52 Wk Hi
% From Hi |
Featured
Date |
Price
Featured |
Pivot Featured |
|
Max Buy |
OLLI
-
NASDAQ
Ollie's Bargain Outlet
Retail-DiscountandVariety
|
$44.95
|
+1.40
3.21% |
$45.00
|
324,163
69.86% of 50 DAV
50 DAV is 464,000
|
$46.90
-4.16%
|
9/8/2017
|
$45.20
|
PP = $46.18
|
|
MB = $48.49
|
Most Recent Note - 11/7/2017 2:01:30 PM
G - Slumping further below its 50 DMA line ($45.05) line with today's loss on light volume. A rebound above the 50 DMA line is needed for its outlook to improve. Prior low ($41.30 on 8/31/17) defines the next important support level where further deterioration would raise more serious concerns.
>>> FEATURED STOCK ARTICLE : Sell Signal Triggered by 50-Day Moving Average Violation on Higher Volume - 10/30/2017 |
View all notes |
Set NEW NOTE alert |
Company Profile |
SEC
News |
Chart |
Request a new note
C
A
S
I |
HLI
-
NYSE
Houlihan Lokey Inc Cl A
Finance-Invest Bnk/Bkrs
|
$41.78
|
+0.11
0.26% |
$41.95
|
204,951
72.42% of 50 DAV
50 DAV is 283,000
|
$44.15
-5.37%
|
9/18/2017
|
$37.04
|
PP = $39.78
|
|
MB = $41.77
|
Most Recent Note - 11/7/2017 4:02:51 PM
Y - Color code is changed to yellow while quietly consolidating below its "max buy" level. On 10/26/17 it priced a Secondary Offering, and abruptly retreated from its all-time high. Such offerings typically hinder price performance for a short time, yet they also help to attract new or greater institutional interest (I criteria). Reported earnings +51% on +30% sales revenues for its second quarter ended September 30th versus the year-ago period.
>>> FEATURED STOCK ARTICLE : Recent Gains Lacked Volume; Earnings Report Due Soon - 10/23/2017 |
View all notes |
Set NEW NOTE alert |
Company Profile |
SEC
News |
Chart |
Request a new note
C
A
S
I |
ICHR
-
NASDAQ
Ichor Holdings Ltd
ELECTRONICS - Semiconductor Equipment
|
$27.98
|
-1.84
-6.17% |
$30.98
|
1,586,994
212.16% of 50 DAV
50 DAV is 748,000
|
$35.51
-21.21%
|
10/10/2017
|
$29.39
|
PP = $28.36
|
|
MB = $29.78
|
Most Recent Note - 11/10/2017 2:54:23 PM
Y - Reported Sep '17 quarterly earnings +77% on +56% sales revenues. Volume and volatility often increase near earnings news. Color code is changed to yellow after slumping back below its "max buy" level again, undercutting prior highs in the $29 area and testing its 50 DMA line ($27.97). More damaging losses would raise greater concerns.
>>> FEATURED STOCK ARTICLE : Undercut Prior Highs and Tested 50-Day Moving Average Line - 11/3/2017 |
View all notes |
Set NEW NOTE alert |
Company Profile |
SEC
News |
Chart |
Request a new note
C
A
S
I |
|
|
|
THESE ARE NOT BUY RECOMMENDATIONS!
Comments contained in the body of this report are technical
opinions only. The material herein has been obtained
from sources believed to be reliable and accurate, however,
its accuracy and completeness cannot be guaranteed.
This site is not an investment advisor, hence it does
not endorse or recommend any securities or other investments.
Any recommendation contained in this report may not
be suitable for all investors and it is not to be deemed
an offer or solicitation on our part with respect to
the purchase or sale of any securities. All trademarks,
service marks and trade names appearing in this report
are the property of their respective owners, and are
likewise used for identification purposes only.
This report is a service available
only to active Paid Premium Members.
You may opt-out of receiving report notifications
at any time. Questions or comments may be submitted
by writing to Premium Membership Services 665 S.E. 10 Street, Suite 201 Deerfield Beach, FL 33441-5634 or by calling 1-800-965-8307
or 954-785-1121.
|
|
|