You are not logged in.
This means you
CAN ONLY VIEW reports that were published prior to Wednesday, March 19, 2025.
You
MUST UPGRADE YOUR MEMBERSHIP if you want to see any current reports.
AFTER MARKET UPDATE - THURSDAY, NOVEMBER 2ND, 2017
Previous After Market Report Next After Market Report >>>
|
|
|
|
DOW |
+81.25 |
23,516.26 |
+0.35% |
|
Volume |
911,046,010 |
+4% |
|
Volume |
2,261,198,130 |
+10% |
|
NASDAQ |
-1.59 |
6,714.94 |
-0.02% |
|
Advancers |
1,453 |
49% |
|
Advancers |
1,520 |
58% |
|
S&P 500 |
+0.49 |
2,579.85 |
+0.02% |
|
Decliners |
1,485 |
51% |
|
Decliners |
1,121 |
42% |
|
Russell 2000 |
+3.76 |
1,496.54 |
+0.25% |
|
52 Wk Highs |
152 |
|
|
52 Wk Highs |
124 |
|
|
S&P 600 |
+0.25 |
906.67 |
+0.03% |
|
52 Wk Lows |
85 |
|
|
52 Wk Lows |
73 |
|
|
 |
Major Indices Ended Mixed as Leadership Waned
Kenneth J. Gruneisen - Passed the CAN SLIM® Master's Exam
Stocks were mixed Thursday. The Dow added 81 points to 23516. The S&P 500 finished flat at 2579. The Nasdaq Composite lost 1 point to 6714. Volume totals reported were higher than the prior session totals on the NYSE and on the Nasdaq exchange. Advancers led decliners by a 7-5 margin on the Nasdaq exchange while the mix was even on the NYSE. There were 57 high-ranked companies from the Leaders List that made new 52-week highs and were listed on the BreakOuts Page, versus the total of 88 on the prior session. New 52-week highs totals contracted yet solidly outnumbered rising new 52-week lows tallies on both the Nasdaq exchange and NYSE. The Featured Stocks Page provides the latest analysis on noteworthy high-ranked leaders. Charts used courtesy of www.stockcharts.com
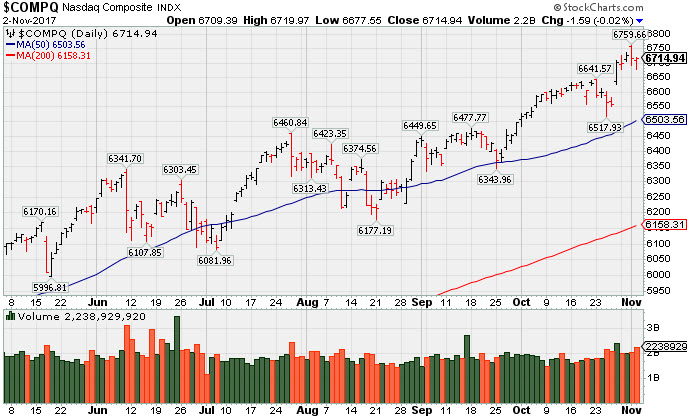 PICTURED: The Nasdaq Composite Index is perched near a record high.
The major averages' (M criteria) are in a confirmed uptrend. Leadership has remained healthy. Investors should buy stocks meeting all key criteria of the fact-based investment system on a case-by-case basis as they trigger technical buy signals.
The major averages fluctuated on heavy trading as investors gauged the announcement of a new Fed Chairman and the release of Republican tax reform measures. Key features of the GOP tax proposal include permanently lowering the corporate tax rate to 20% and cutting the number of individual tax brackets to just three. In central bank news, President Trump announced the nomination of Jerome Powell as the next chairman of the Federal Reserve.
Six of 11 sectors in the S&P 500 finished lower with Telecom and Consumer Discretionary shares lagging and Financials outperforming. In earnings, Facebook (FB -2.05%) fell despite beating analyst expectations on the top and bottom line. Symantec (SYMC -8.68%) fell after releasing tepid forward guidance. Yum! Brands (YUM +6.51%) rose as the restaurant company’s profits topped Wall Street forecasts. Teva Pharmaceuticals (TEVA -19.90%) and Newell Brands (NWL -26.80%) fell hard after each company missed earnings projections. In M&A news, Time Warner (TWX -3.75%) fell amid reports the Justice Department is considering an antitrust lawsuit to block the company’s pending sale to AT&T (T -1.13%).
Treasuries were higher as the yield on the benchmark 10-year note fell two basis points to 2.35%. In commodities, NYMEX WTI crude added 0.8% to $54.76/barrel. |
 Kenneth J. Gruneisen started out as a licensed stockbroker in August 1987, a couple of months prior to the historic stock market crash that took the Dow Jones Industrial Average down -22.6% in a single day. He has published daily fact-based fundamental and technical analysis on high-ranked stocks online for two decades. Through FACTBASEDINVESTING.COM, Kenneth provides educational articles, news, market commentary, and other information regarding proven investment systems that work in good times and bad.
Comments contained in the body of this report are technical opinions only and are not necessarily those of Gruneisen Growth Corp. The material herein has been obtained from sources believed to be reliable and accurate, however, its accuracy and completeness cannot be guaranteed. Our firm, employees, and customers may effect transactions, including transactions contrary to any recommendation herein, or have positions in the securities mentioned herein or options with respect thereto. Any recommendation contained in this report may not be suitable for all investors and it is not to be deemed an offer or solicitation on our part with respect to the purchase or sale of any securities. |
|
 |
Financial and Most Tech Groups Rose
Kenneth J. Gruneisen - Passed the CAN SLIM® Master's Exam
On Thursday the Broker/Dealer Index ($XBD -+0.89%) and the Bank Index ($BKX +0.61%) both posted solid gains, but the Retail Index ($RLX -0.36%) ended the session in the red. The tech sector saw gains from the Semiconductor Index ($SOX +0.46%) and the Biotechnology Index ($BTK +1.29%), but the Networking Index ($NWX -0.95) finished lower on the session. The Gold & Silver Index ($XAU +0.03%) finished flat while the Oil Services Index ($OSX -0.47%) edged lower and the Integrated Oil Index ($XOI +0.80%) posted a solid gain. Charts courtesy www.stockcharts.com
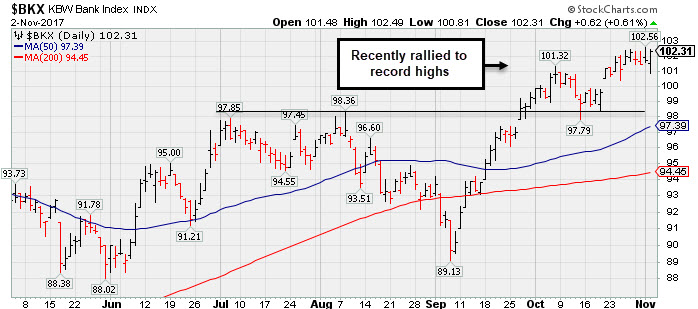 PICTURED: The Bank Index ($BKX +0.61%) found support near prior highs when recently consolidating, then rallied to new record highs.
| Oil Services |
$OSX |
132.89 |
-0.63 |
-0.47% |
-27.69% |
| Integrated Oil |
$XOI |
1,261.86 |
+10.93 |
+0.87% |
-0.48% |
| Semiconductor |
$SOX |
1,277.34 |
+5.83 |
+0.46% |
+40.91% |
| Networking |
$NWX |
457.47 |
-4.42 |
-0.96% |
+2.55% |
| Broker/Dealer |
$XBD |
246.51 |
+2.26 |
+0.93% |
+20.09% |
| Retail |
$RLX |
1,592.48 |
-5.68 |
-0.36% |
+18.58% |
| Gold & Silver |
$XAU |
81.30 |
+0.02 |
+0.02% |
+3.09% |
| Bank |
$BKX |
102.31 |
+0.62 |
+0.61% |
+11.46% |
| Biotech |
$BTK |
4,145.28 |
+59.50 |
+1.46% |
+34.80% |
|
|
|
 |
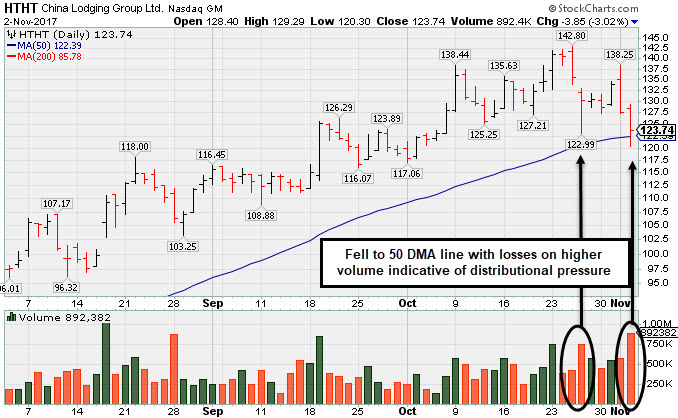
Testing 50-Day Moving Average Line After Proposed Offering
Kenneth J. Gruneisen - Passed the CAN SLIM® Master's Exam
China Lodging Group Ads (HTHT -$3.91 or -3.06% to $123.68) suffered recent volume-driven losses and yet found prompt support near its 50-day moving average (DMA) line ($122.39) today after violating that important short-term average and undercutting the recent low, raising concerns. There were "negative reversals" on 10/25/17 and 11/01/17 noted as it abruptly retreated from its all-time high after proposing a new Public Offering. It is very extended from any sound base.
It is due to report Sep '17 earnings on 11/13/17. Earnings rose +19% on +18% sales revenues for the Jun '17 quarter were below the +25% minimum earnings guideline (C criteria). It was last shown in this FSU section on 10/05/17 with an annotated graph under the headline, "Holding Ground Stubbornly After Considerable Rally". HTHT traded up as much as +267.4% since first featured in yellow in the 7/13/16 mid-day report (read here). The number of top-rated funds owing its shares rose from 87 in Sep '15 to 210 in Sep '17 a reassuring sign concerning the I criteria. Currently the high-ranked Leisure- Lodging firm has an A Timeliness rating and an A Sponsorship rating. Its small supply of 27.2 million shares (S criteria) in the public float may contribute to greater price volatility in the event of institutional buying or selling.
|
|
|
Color Codes Explained :
Y - Better candidates highlighted by our
staff of experts.
G - Previously featured
in past reports as yellow but may no longer be buyable under the
guidelines.
***Last / Change / Volume data in this table is the closing quote data***
Symbol/Exchange
Company Name
Industry Group |
PRICE |
CHANGE
(%Change) |
Day High |
Volume
(% DAV)
(% 50 day avg vol) |
52 Wk Hi
% From Hi |
Featured
Date |
Price
Featured |
Pivot Featured |
|
Max Buy |
THO
-
NYSE
Thor Industries Inc
AUTOMOTIVE - Recreational Vehicles
|
$136.72
|
-0.10
-0.07% |
$137.16
|
699,600
97.85% of 50 DAV
50 DAV is 715,000
|
$138.07
-0.98%
|
8/14/2017
|
$106.67
|
PP = $110.01
|
|
MB = $115.51
|
Most Recent Note - 11/1/2017 5:32:29 PM
G - Volume has been below average while wedging to new all-time highs. Posted 10 consecutive weekly gains, getting very extended from the previously noted base. Its 50 DMA line ($120.69) defines near-term support above prior highs in the $115 area. Fundamentals remain strong.
>>> FEATURED STOCK ARTICLE : Extended From Prior Base With Volume Totals Cooling - 10/13/2017 |
View all notes |
Set NEW NOTE alert |
Company Profile |
SEC
News |
Chart |
Request a new note
C
A
S
I |
PFBC
-
NASDAQ
Preferred Bank Los Angls
BANKING - Regional - Pacific Banks
|
$62.07
|
+0.38
0.62% |
$62.23
|
58,896
77.49% of 50 DAV
50 DAV is 76,000
|
$66.58
-6.77%
|
10/10/2017
|
$59.38
|
PP = $59.08
|
|
MB = $62.03
|
Most Recent Note - 10/30/2017 5:48:58 PM
Y - Pulled back near its "max buy" level today and its color code is changed to yellow. It triggered a technical buy signal on 10/25/17 but quickly got extended. Prior highs in the $60 area define initial support to watch.
>>> FEATURED STOCK ARTICLE : Perched Near High Following Volume-Driven Breakout Gains - 10/11/2017 |
View all notes |
Set NEW NOTE alert |
Company Profile |
SEC
News |
Chart |
Request a new note
C
A
S
I |
AVGO
-
NASDAQ
Broadcom Limited
ELECTRONICS - Semiconductor - Broad Line
|
$259.50
|
+0.21
0.08% |
$264.64
|
6,662,061
243.50% of 50 DAV
50 DAV is 2,736,000
|
$266.70
-2.70%
|
10/30/2017
|
$261.19
|
PP = $259.46
|
|
MB = $272.43
|
Most Recent Note - 10/30/2017 12:59:39 PM
Y - Powering to new 52-week and all-time highs with today's 2nd consecutive volume-driven gain. Color code is changed to yellow with new pivot point cited based on its 8/24/17 high plus 10 cents. A gain above the pivot point backed by at least +40% above average volume is needed to trigger a proper new (or add-on) technical buy signal. Prior session's gain above its 50 DMA line ($246) helped its outlook improve, however its current Relative Strength rating of 78 remains below the 80+ minimum guideline for buy candidates. Subsequent losses below the recent low ($231.53 on 9/25/17) would raise serious concerns and trigger a more worrisome technical sell signal.
>>> FEATURED STOCK ARTICLE : Slumped Below 50-Day Moving Average Line Again - 10/17/2017 |
View all notes |
Set NEW NOTE alert |
Company Profile |
SEC
News |
Chart |
Request a new note
C
A
S
I |
YY
-
NASDAQ
YY Inc Ads
INTERNET - Internet Service Providers
|
$88.09
|
-1.15
-1.29% |
$90.69
|
623,986
43.73% of 50 DAV
50 DAV is 1,427,000
|
$97.59
-9.73%
|
9/25/2017
|
$80.26
|
PP = $83.10
|
|
MB = $87.26
|
Most Recent Note - 10/30/2017 6:07:44 PM
G - Halted its slide with a gain today following 4 consecutive losses. Prior highs in the $83 area coincide with its 50 DMA line ($82.98) defining important neat-term support to watch.
>>> FEATURED STOCK ARTICLE : Extended After Rallying From Base - 10/19/2017 |
View all notes |
Set NEW NOTE alert |
Company Profile |
SEC
News |
Chart |
Request a new note
C
A
S
I |
STMP
-
NASDAQ
Stamps.com Inc
INTERNET - Internet Software and Services
|
$221.25
|
-5.10
-2.25% |
$227.18
|
389,423
118.01% of 50 DAV
50 DAV is 330,000
|
$233.13
-5.09%
|
9/11/2017
|
$193.65
|
PP = $220.35
|
|
MB = $231.37
|
Most Recent Note - 11/1/2017 5:24:38 PM
Y - Posted 4 consecutive gains since reversing from a new all-time high on 10/26/17, falling back into the prior base and raising concerns. Its 50 DMA line ($208.45) defines important near-term support above the recent low ($195.05 on 9/28/17). Subsequent losses leading to violations would trigger technical sell signals. Due to report Sep '17 quarterly results after the close on Thursday, November 2nd. Volume and volatility often increase near earnings news. See the latest FSU analysis for more details and a new annotated graph.
>>> FEATURED STOCK ARTICLE : Perched Near Record High Ahead of Earnings News - 11/1/2017 |
View all notes |
Set NEW NOTE alert |
Company Profile |
SEC
News |
Chart |
Request a new note
C
A
S
I |
Symbol/Exchange
Company Name
Industry Group |
PRICE |
CHANGE
(%Change) |
Day High |
Volume
(% DAV)
(% 50 day avg vol) |
52 Wk Hi
% From Hi |
Featured
Date |
Price
Featured |
Pivot Featured |
|
Max Buy |
HTHT
-
NASDAQ
China Lodging Group Ads
LEISURE - Lodging
|
$123.68
|
-3.91
-3.06% |
$129.29
|
892,382
224.22% of 50 DAV
50 DAV is 398,000
|
$142.80
-13.39%
|
9/29/2016
|
$46.12
|
PP = $47.82
|
|
MB = $50.21
|
 Most Recent Note - 11/2/2017 4:54:04 PM
G - Suffered another volume-driven loss today, testing its 50 DMA line ($122.39) and undercutting the recent low, raising concerns. There were "negative reversals" on 10/25/17 and 11/01/17 noted as it abruptly retreated from its all-time high after proposing a new Public Offering. It is very extended from any sound base. Earnings +19% on +18% sales revenues for the Jun '17 quarter were below the +25% minimum earnings guideline (C criteria). See the latest FSU analysis for more details and a new annotated graph.
>>> FEATURED STOCK ARTICLE : Testing 50-Day Moving Average Line After Proposed Offering - 11/2/2017 |
View all notes |
Set NEW NOTE alert |
Company Profile |
SEC
News |
Chart |
Request a new note
C
A
S
I |
LMAT
-
NASDAQ
Lemaitre Vascular Inc
Medical-Products
|
$32.01
|
+0.03
0.09% |
$32.32
|
267,691
125.91% of 50 DAV
50 DAV is 212,600
|
$39.88
-19.73%
|
7/28/2017
|
$33.50
|
PP = $33.32
|
|
MB = $34.99
|
Most Recent Note - 11/1/2017 3:54:12 PM
G - Halted its slide after it gapped down and violated its 50 DMA line on 10/27/17 raising concerns and triggering technical sell signals. Its 200 DMA line ($29.95) is an important long-term average which may act as a support level. Reported Sep '17 quarterly earnings +47% on +7% sales revenues.
>>> FEATURED STOCK ARTICLE : Consolidating Above 50-Day Moving Average Before Earnings - 10/18/2017 |
View all notes |
Set NEW NOTE alert |
Company Profile |
SEC
News |
Chart |
Request a new note
C
A
S
I |
PATK
-
NASDAQ
Patrick Industries Inc
Bldg-Mobile/Mfg and RV
|
$93.10
|
+1.10
1.20% |
$93.45
|
76,222
96.48% of 50 DAV
50 DAV is 79,000
|
$96.25
-3.27%
|
10/26/2017
|
$90.90
|
PP = $87.90
|
|
MB = $92.30
|
Most Recent Note - 11/1/2017 5:30:20 PM
Y - Pulled back with above average volume today, finishing just below its "max buy" level. Triggered a technical buy signal with a big 10/26/17 gain backed by 4 times average volume. Reported earnings +37% on +34% sales revenues for the Sep '17 quarter. It has earned a 96 Earnings Per Share rating and fundamentals remain strong. Leadership (L criteria) from others in the industry group (Building - Mobile/ Mfg & RV) is a reassuring sign. Went through a long and choppy consolidation since dropped from the Featured Stocks list on 3/09/17.
>>> FEATURED STOCK ARTICLE : Volume 4 Times Average Behind Breakout Gain on Earnings News - 10/26/2017 |
View all notes |
Set NEW NOTE alert |
Company Profile |
SEC
News |
Chart |
Request a new note
C
A
S
I |
ESNT
-
NYSE
Essent Group Ltd
Finance-MrtgandRel Svc
|
$42.51
|
-0.40
-0.93% |
$43.77
|
1,119,063
146.86% of 50 DAV
50 DAV is 762,000
|
$45.10
-5.74%
|
10/9/2017
|
$39.75
|
PP = $41.54
|
|
MB = $43.62
|
Most Recent Note - 10/30/2017 5:51:07 PM
Y - Color code is changed to yellow while quietly consolidating below its "max buy" level. Prior highs in the $41 area define near term support to watch above its 50 DMA line.
>>> FEATURED STOCK ARTICLE : Perched Near High After Streak of Gains - 10/24/2017 |
View all notes |
Set NEW NOTE alert |
Company Profile |
SEC
News |
Chart |
Request a new note
C
A
S
I |
FIVE
-
NASDAQ
Five Below Inc
Retail-DiscountandVariety
|
$56.90
|
+1.48
2.67% |
$57.00
|
904,591
103.62% of 50 DAV
50 DAV is 873,000
|
$58.07
-2.01%
|
10/6/2017
|
$57.13
|
PP = $54.23
|
|
MB = $56.94
|
Most Recent Note - 10/31/2017 5:05:37 PM
Y - Consolidating above prior highs in the $54 area defining initial support to watch above its 50 DMA line ($52.75). See the latest FSU analysis for more details and a new annotated graph.
>>> FEATURED STOCK ARTICLE : Prior Highs Define Important Support While Consolidating - 10/31/2017 |
View all notes |
Set NEW NOTE alert |
Company Profile |
SEC
News |
Chart |
Request a new note
C
A
S
I |
Symbol/Exchange
Company Name
Industry Group |
PRICE |
CHANGE
(%Change) |
Day High |
Volume
(% DAV)
(% 50 day avg vol) |
52 Wk Hi
% From Hi |
Featured
Date |
Price
Featured |
Pivot Featured |
|
Max Buy |
OLED
-
NASDAQ
Universal Display Corp
Elec-Misc Products
|
$144.35
|
+1.65
1.16% |
$147.25
|
943,282
111.63% of 50 DAV
50 DAV is 845,000
|
$149.85
-3.67%
|
8/31/2017
|
$128.22
|
PP = $127.78
|
|
MB = $134.17
|
Most Recent Note - 10/31/2017 12:53:13 PM
G - Hitting a new high with today's big gain, rising from a riskier "late stage" base pattern. Due to report Sep '17 quarterly results after the close on Thursday, November 2nd. Volume and volatility often increase near earnings news. Its 50 DMA line ($129.66) and prior highs in the $130 area define important near-term support to watch on pullbacks.
>>> FEATURED STOCK ARTICLE : Prior Highs and 50-Day Average Define Near-Term Support - 10/25/2017 |
View all notes |
Set NEW NOTE alert |
Company Profile |
SEC
News |
Chart |
Request a new note
C
A
S
I |
ANET
-
NYSE
Arista Networks Inc
TELECOMMUNICATIONS - Communication Equipment
|
$181.17
|
-16.09
-8.16% |
$197.50
|
2,485,139
413.50% of 50 DAV
50 DAV is 601,000
|
$201.95
-10.29%
|
10/27/2017
|
$195.65
|
PP = $196.37
|
|
MB = $206.19
|
Most Recent Note - 11/2/2017 12:17:12 PM
Y - Due to report earnings for the Sep '17 quarter after today's close. Volume and volatility often increase near earnings news. Raised concerns as it undercut the 50 DMA line ($185.26) and prior low earlier with today's big volume-driven loss, then it found prompt support. Recently rallied from an advanced "3-weeks tight" base, however, it has negated the breakout.
>>> FEATURED STOCK ARTICLE : Perched Near All-Time High, Extended From Any Sound Base - 10/16/2017 |
View all notes |
Set NEW NOTE alert |
Company Profile |
SEC
News |
Chart |
Request a new note
C
A
S
I |
GRUB
-
NYSE
Grubhub Inc
COMPUTER SOFTWARE and SERVICES - Technical and System Software
|
$60.83
|
+0.00
0.00% |
$61.12
|
889,715
48.83% of 50 DAV
50 DAV is 1,822,000
|
$61.37
-0.87%
|
6/21/2017
|
$47.33
|
PP = $46.94
|
|
MB = $49.29
|
Most Recent Note - 11/1/2017 5:34:17 PM
G - Quietly hit another new high today but reversed into the red. Holding its ground after an impressive streak of volume-driven gains. Rebound above its 50 DMA line ($54.28) helped its outlook improve this week. However, it reported Sep '17 quarterly earnings +22% on +32% sales revenues, its 2nd consecutive quarter below the +25% minimum earnings guideline (C criteria), so fundamental concerns remain with regard to the fact-based investment system. See the latest FSU analysis for more details and an annotated graph.
>>> FEATURED STOCK ARTICLE : Technical Strength in Popular Internet Platform - 10/27/2017 |
View all notes |
Set NEW NOTE alert |
Company Profile |
SEC
News |
Chart |
Request a new note
C
A
S
I |
IBP
-
NYSE
Installed Building Prod
DIVERSIFIED SERVICES - Business/Management Services
|
$67.15
|
-2.20
-3.17% |
$69.35
|
213,793
137.93% of 50 DAV
50 DAV is 155,000
|
$70.25
-4.41%
|
9/19/2017
|
$59.15
|
PP = $60.10
|
|
MB = $63.11
|
Most Recent Note - 10/30/2017 5:56:08 PM
G - Posted a 3rd consecutive gain backed by light volume, wedging into new high territory. Its 50 DMA line defines near-term support along with prior highs in the $60 area.
>>> FEATURED STOCK ARTICLE : Building - Maintenance & Service Firm Extended From Latest Base - 10/9/2017 |
View all notes |
Set NEW NOTE alert |
Company Profile |
SEC
News |
Chart |
Request a new note
C
A
S
I |
OLLI
-
NASDAQ
Ollie's Bargain Outlet
Retail-DiscountandVariety
|
$44.65
|
+0.75
1.71% |
$44.70
|
309,709
59.10% of 50 DAV
50 DAV is 524,000
|
$46.90
-4.80%
|
9/8/2017
|
$45.20
|
PP = $46.18
|
|
MB = $48.49
|
Most Recent Note - 10/30/2017 5:39:53 PM
G - Abruptly retreated from its all-time high, violating its 50 DMA line ($45.01) line with a big volume-driven loss triggering a technical sell signal. Only a prompt rebound above the 50 DMA line would help its outlook improve. Color code was changed to green. Recent lows in the $43-44 area may act as support, but further deterioration would raise more serious concerns. See the latest FSU analysis for more details and a new annotated graph.
>>> FEATURED STOCK ARTICLE : Sell Signal Triggered by 50-Day Moving Average Violation on Higher Volume - 10/30/2017 |
View all notes |
Set NEW NOTE alert |
Company Profile |
SEC
News |
Chart |
Request a new note
C
A
S
I |
Symbol/Exchange
Company Name
Industry Group |
PRICE |
CHANGE
(%Change) |
Day High |
Volume
(% DAV)
(% 50 day avg vol) |
52 Wk Hi
% From Hi |
Featured
Date |
Price
Featured |
Pivot Featured |
|
Max Buy |
HLI
-
NYSE
Houlihan Lokey Inc Cl A
Finance-Invest Bnk/Bkrs
|
$41.63
|
-0.15
-0.36% |
$41.95
|
175,337
60.67% of 50 DAV
50 DAV is 289,000
|
$44.15
-5.71%
|
9/18/2017
|
$37.04
|
PP = $39.78
|
|
MB = $41.77
|
Most Recent Note - 11/1/2017 5:27:39 PM
G - Color code is changed to green after finishing the session back above the "max buy" level. Gapped down on 10/26/17 after pricing a Secondary Offering, abruptly retreating from its all-time high. Such offerings typically hinder price performance short-term, yet also help attract new or greater institutional interest (I criteria). Reported earnings +51% on +30% sales revenues for its second quarter ended September 30th versus the year-ago period.
>>> FEATURED STOCK ARTICLE : Recent Gains Lacked Volume; Earnings Report Due Soon - 10/23/2017 |
View all notes |
Set NEW NOTE alert |
Company Profile |
SEC
News |
Chart |
Request a new note
C
A
S
I |
ICHR
-
NASDAQ
Ichor Holdings Ltd
ELECTRONICS - Semiconductor Equipment
|
$28.91
|
+0.33
1.15% |
$29.93
|
715,401
98.07% of 50 DAV
50 DAV is 729,500
|
$35.51
-18.59%
|
10/10/2017
|
$29.39
|
PP = $28.36
|
|
MB = $29.78
|
Most Recent Note - 11/1/2017 1:29:39 PM
Y - Tested support at its 50 DMA ($26.70) line today after undercutting its "max buy" level and prior highs in the $29 area, and its color code is changed to yellow. More damaging losses would raise greater concerns.
>>> FEATURED STOCK ARTICLE : Semiconductor Equipment Firm Finished Strong After Highlighted - 10/10/2017 |
View all notes |
Set NEW NOTE alert |
Company Profile |
SEC
News |
Chart |
Request a new note
C
A
S
I |
|
|
|
THESE ARE NOT BUY RECOMMENDATIONS!
Comments contained in the body of this report are technical
opinions only. The material herein has been obtained
from sources believed to be reliable and accurate, however,
its accuracy and completeness cannot be guaranteed.
This site is not an investment advisor, hence it does
not endorse or recommend any securities or other investments.
Any recommendation contained in this report may not
be suitable for all investors and it is not to be deemed
an offer or solicitation on our part with respect to
the purchase or sale of any securities. All trademarks,
service marks and trade names appearing in this report
are the property of their respective owners, and are
likewise used for identification purposes only.
This report is a service available
only to active Paid Premium Members.
You may opt-out of receiving report notifications
at any time. Questions or comments may be submitted
by writing to Premium Membership Services 665 S.E. 10 Street, Suite 201 Deerfield Beach, FL 33441-5634 or by calling 1-800-965-8307
or 954-785-1121.
|
|
|