You are not logged in.
This means you
CAN ONLY VIEW reports that were published prior to Thursday, March 20, 2025.
You
MUST UPGRADE YOUR MEMBERSHIP if you want to see any current reports.
AFTER MARKET UPDATE - TUESDAY, OCTOBER 31ST, 2017
Previous After Market Report Next After Market Report >>>
|
|
|
|
DOW |
+28.50 |
23,377.24 |
+0.12% |
|
Volume |
959,336,820 |
+10% |
|
Volume |
2,032,788,050 |
+1% |
|
NASDAQ |
+28.71 |
6,727.67 |
+0.43% |
|
Advancers |
1,840 |
62% |
|
Advancers |
1,751 |
64% |
|
S&P 500 |
+2.43 |
2,575.26 |
+0.09% |
|
Decliners |
1,106 |
38% |
|
Decliners |
1,002 |
36% |
|
Russell 2000 |
+11.97 |
1,502.87 |
+0.80% |
|
52 Wk Highs |
169 |
|
|
52 Wk Highs |
178 |
|
|
S&P 600 |
+8.56 |
912.04 |
+0.95% |
|
52 Wk Lows |
55 |
|
|
52 Wk Lows |
57 |
|
|
 |
Leadership Improved as Major Indices Marched Higher
Kenneth J. Gruneisen - Passed the CAN SLIM® Master's Exam
For the month, the Dow added 4.3% and the S&P 500 climbed 2.2%, the seventh straight monthly gain for the two averages. The Nasdaq was up 3.6% its fourth consecutive monthly gain. Stocks were higher Tuesday. The Dow added 28 points to 23377. The S&P 500 gained 2 points to 2575. The Nasdaq Composite climbed 28 points to 6727. Volume totals reported were higher than the prior session totals on the NYSE and on the Nasdaq exchange. Breadth was positive as advancers led decliners by a 3-2 margin on the NYSE and by nearly 9-5 on the Nasdaq exchange. There were 101 high-ranked companies from the Leaders List that made new 52-week highs and were listed on the BreakOuts Page, versus the total of 65 on the prior session. New 52-week highs totals expanded and solidly outnumbered new 52-week lows on both the Nasdaq exchange and NYSE. The Featured Stocks Page provides the latest analysis on noteworthy high-ranked leaders. Charts used courtesy of www.stockcharts.com
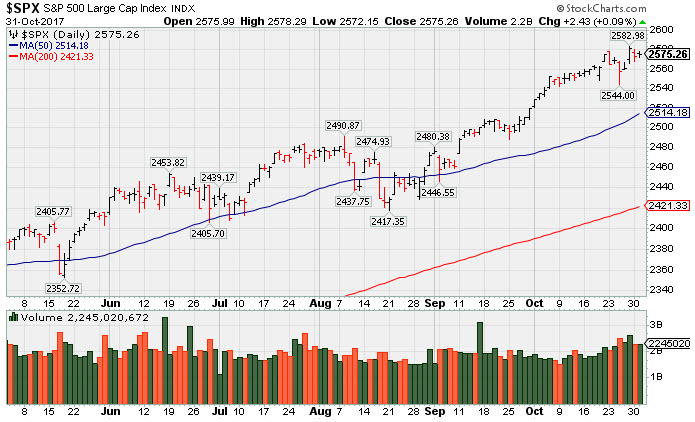 PICTURED: The S&P 500 Index is perched near its record high.
The major averages' (M criteria) are in a confirmed uptrend. Leadership has remained healthy. Investors should buy stocks meeting all key criteria of the fact-based investment system on a case-by-case basis as they trigger technical buy signals.
The major averages closed out October on a positive note as investors digested several economic updates and earnings reports. On the data front, a release disclosed that consumer confidence rose to its highest level since 2000 in October. An additional report revealed the pace of business activity in the Midwest increased to 66.2 well above consensus estimates for October. A separate release showed home prices in the 20 major U.S. cities rose 5.9% year-over-year in August in line with expectations.
Seven of 11 S&P 500 sectors were higher as Consumer Staples outperformed. Kellogg (K +6.22%) and Mondelez (MDLZ +5.42%) climbed after both companies topped consensus estimates. Semi-Conductor Qualcomm (QCOM -6.68%) fell on negative analyst commentary. Shares of Under Armour (UA -21.78%) plunged after the athletic apparel maker missed earnings projections and reduced full-year guidance.
Treasuries were little changed on the session. The benchmark 10-year note yield was flat at 2.38%. In commodities, NYMEX WTI crude lost 0.2% to $54.07/barrel. COMEX gold fell 0.5% to $1271.60/ounce.
|
 Kenneth J. Gruneisen started out as a licensed stockbroker in August 1987, a couple of months prior to the historic stock market crash that took the Dow Jones Industrial Average down -22.6% in a single day. He has published daily fact-based fundamental and technical analysis on high-ranked stocks online for two decades. Through FACTBASEDINVESTING.COM, Kenneth provides educational articles, news, market commentary, and other information regarding proven investment systems that work in good times and bad.
Comments contained in the body of this report are technical opinions only and are not necessarily those of Gruneisen Growth Corp. The material herein has been obtained from sources believed to be reliable and accurate, however, its accuracy and completeness cannot be guaranteed. Our firm, employees, and customers may effect transactions, including transactions contrary to any recommendation herein, or have positions in the securities mentioned herein or options with respect thereto. Any recommendation contained in this report may not be suitable for all investors and it is not to be deemed an offer or solicitation on our part with respect to the purchase or sale of any securities. |
|
 |
Semiconductor, Broker/Dealer, and Energy Linked Groups Rose
Kenneth J. Gruneisen - Passed the CAN SLIM® Master's Exam
On Tuesday the Bank Index ($BKX -0.31%) fell while the Broker/Dealer Index ($XBD +0.35%) posted a small gain and the Retail Index ($RLX +0.02%) finished flat. The tech sector was mixed as the Semiconductor Index ($SOX +0.77%) and Networking Index ($NWX +0.40%) both edged higher but the Biotechnology Index ($BTK -0.32%) finished slightly lower on the session. Commodity-linked groups were mixed as Gold & Silver Index ($XAU -1.42%) fell while the Oil Services Index ($OSX +0.81%) and the Integrated Oil Index ($XOI +0.47%) posted gains. Charts courtesy www.stockcharts.com
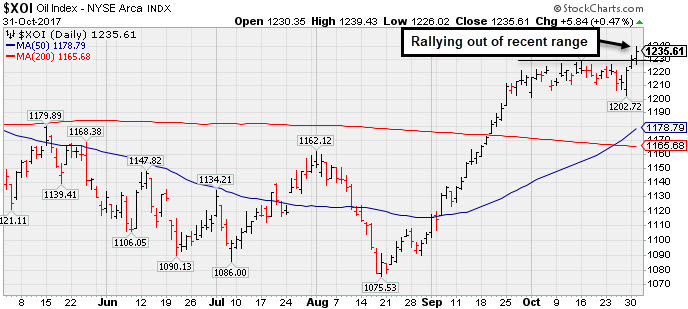 PICTURED: The Integrated Oil Index ($XOI +0.47%) is rallying out of a recent tight trading range.
| Oil Services |
$OSX |
132.38 |
+1.06 |
+0.81% |
-27.97% |
| Integrated Oil |
$XOI |
1,235.61 |
+5.84 |
+0.47% |
-2.55% |
| Semiconductor |
$SOX |
1,275.61 |
+9.70 |
+0.77% |
+40.72% |
| Networking |
$NWX |
463.10 |
+1.86 |
+0.40% |
+3.81% |
| Broker/Dealer |
$XBD |
246.90 |
+0.85 |
+0.35% |
+20.27% |
| Retail |
$RLX |
1,599.75 |
+0.36 |
+0.02% |
+19.12% |
| Gold & Silver |
$XAU |
81.20 |
-1.17 |
-1.42% |
+2.97% |
| Bank |
$BKX |
101.45 |
-0.31 |
-0.30% |
+10.52% |
| Biotech |
$BTK |
4,103.24 |
-13.10 |
-0.32% |
+33.44% |
|
|
|
 |
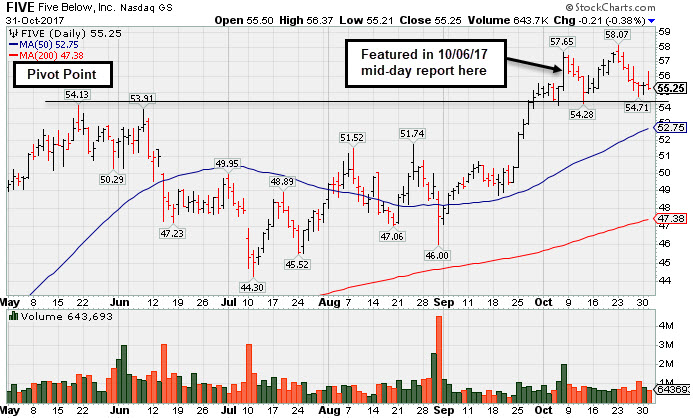
Prior Highs Define Important Support While Consolidating
Kenneth J. Gruneisen - Passed the CAN SLIM® Master's Exam
Five Below Inc (FIVE -$0.21 or -0.38% to $55.25) is consolidating above prior highs in the $54 area defining initial support to watch above its 50-day moving average (DMA) line ($52.75).
It was last shown in this FSU section on 10/06/17 with an annotated graph under the headline, "Finished Strong With Above Average Volume Behind Big Gain". It finished strong after highlighted in yellow with new pivot point cited based on its 5/19/17 high plus 10 cents in the earlier mid-day report.
Quarterly and annual earnings history (C and A criteria) has been strong. Also showing acceleration in sales revenues and earnings in sequential quarterly comparisons through Jul '17..
The Retail - Discount & Variety firm has a 99 Earnings Per Share Rating. It posted earnings +67% on +29% sales revenues for the Jul '17 quarter, and 3 of the past 4 earnings increases were above the +25% minimum guideline (C criteria), helping it better match the fact-based investment system's winning models. It has a good annual earnings (A criteria) track record.
FIVE had a choppy history since its $17 IPO in July 2012 and 3 subsequent Secondary Offerings. It has a small supply of 55.2 million shares outstanding (S criteria). Its current Timeliness Rating is A and its Sponsorship Rating is B. The number of top-rated funds owning its shares rose from 432 in Jun '16 to 479 in Jun '17, a reassuring sign concerning the I criteria. Its current Up/Down Volume Ratio of 1.6 is an unbiased indication its shares have been under slight accumulation over the past 50 days.
|
|
|
Color Codes Explained :
Y - Better candidates highlighted by our
staff of experts.
G - Previously featured
in past reports as yellow but may no longer be buyable under the
guidelines.
***Last / Change / Volume data in this table is the closing quote data***
Symbol/Exchange
Company Name
Industry Group |
PRICE |
CHANGE
(%Change) |
Day High |
Volume
(% DAV)
(% 50 day avg vol) |
52 Wk Hi
% From Hi |
Featured
Date |
Price
Featured |
Pivot Featured |
|
Max Buy |
THO
-
NYSE
Thor Industries Inc
AUTOMOTIVE - Recreational Vehicles
|
$136.22
|
+1.54
1.14% |
$136.37
|
501,590
70.25% of 50 DAV
50 DAV is 714,000
|
$135.12
0.81%
|
8/14/2017
|
$106.67
|
PP = $110.01
|
|
MB = $115.51
|
Most Recent Note - 10/26/2017 4:06:27 PM
G - Volume totals have been cooling in recent weeks while wedging to new all-time highs. On track for a 10th consecutive weekly gain, very extended from the previously noted base. Its 50 DMA line ($118) defines near-term support above prior highs in the $115 area. Fundamentals remain strong.
>>> FEATURED STOCK ARTICLE : Extended From Prior Base With Volume Totals Cooling - 10/13/2017 |
View all notes |
Set NEW NOTE alert |
Company Profile |
SEC
News |
Chart |
Request a new note
C
A
S
I |
PFBC
-
NASDAQ
Preferred Bank Los Angls
BANKING - Regional - Pacific Banks
|
$61.73
|
-0.27
-0.44% |
$62.87
|
59,330
80.18% of 50 DAV
50 DAV is 74,000
|
$66.58
-7.28%
|
10/10/2017
|
$59.38
|
PP = $59.08
|
|
MB = $62.03
|
Most Recent Note - 10/30/2017 5:48:58 PM
Y - Pulled back near its "max buy" level today and its color code is changed to yellow. It triggered a technical buy signal on 10/25/17 but quickly got extended. Prior highs in the $60 area define initial support to watch.
>>> FEATURED STOCK ARTICLE : Perched Near High Following Volume-Driven Breakout Gains - 10/11/2017 |
View all notes |
Set NEW NOTE alert |
Company Profile |
SEC
News |
Chart |
Request a new note
C
A
S
I |
AVGO
-
NASDAQ
Broadcom Limited
ELECTRONICS - Semiconductor - Broad Line
|
$263.91
|
+2.68
1.03% |
$266.70
|
3,174,167
117.08% of 50 DAV
50 DAV is 2,711,000
|
$262.20
0.65%
|
10/30/2017
|
$261.19
|
PP = $259.46
|
|
MB = $272.43
|
Most Recent Note - 10/30/2017 12:59:39 PM
Y - Powering to new 52-week and all-time highs with today's 2nd consecutive volume-driven gain. Color code is changed to yellow with new pivot point cited based on its 8/24/17 high plus 10 cents. A gain above the pivot point backed by at least +40% above average volume is needed to trigger a proper new (or add-on) technical buy signal. Prior session's gain above its 50 DMA line ($246) helped its outlook improve, however its current Relative Strength rating of 78 remains below the 80+ minimum guideline for buy candidates. Subsequent losses below the recent low ($231.53 on 9/25/17) would raise serious concerns and trigger a more worrisome technical sell signal.
>>> FEATURED STOCK ARTICLE : Slumped Below 50-Day Moving Average Line Again - 10/17/2017 |
View all notes |
Set NEW NOTE alert |
Company Profile |
SEC
News |
Chart |
Request a new note
C
A
S
I |
YY
-
NASDAQ
YY Inc Ads
INTERNET - Internet Service Providers
|
$90.39
|
+3.02
3.46% |
$90.59
|
871,635
59.01% of 50 DAV
50 DAV is 1,477,000
|
$97.59
-7.38%
|
9/25/2017
|
$80.26
|
PP = $83.10
|
|
MB = $87.26
|
Most Recent Note - 10/30/2017 6:07:44 PM
G - Halted its slide with a gain today following 4 consecutive losses. Prior highs in the $83 area coincide with its 50 DMA line ($82.98) defining important neat-term support to watch.
>>> FEATURED STOCK ARTICLE : Extended After Rallying From Base - 10/19/2017 |
View all notes |
Set NEW NOTE alert |
Company Profile |
SEC
News |
Chart |
Request a new note
C
A
S
I |
STMP
-
NASDAQ
Stamps.com Inc
INTERNET - Internet Software and Services
|
$224.40
|
+1.10
0.49% |
$225.00
|
332,516
102.00% of 50 DAV
50 DAV is 326,000
|
$233.13
-3.74%
|
9/11/2017
|
$193.65
|
PP = $220.35
|
|
MB = $231.37
|
Most Recent Note - 10/26/2017 3:56:28 PM
Y - Reversed into the red today for a big loss on higher volume after hitting yet another new all-time high. Posted a solid gain backed by +71% above average volume on 10/24/17, however today's damaging loss has it falling back into the prior base, raising concerns. Its 50 DMA line ($207.32) defines important near-term support above the recent low ($195.05 on 9/28/17). Subsequent losses leading to violations would trigger technical sell signals.
>>> FEATURED STOCK ARTICLE : Perched Near Pivot Point With No Resistance Remaining - 10/4/2017 |
View all notes |
Set NEW NOTE alert |
Company Profile |
SEC
News |
Chart |
Request a new note
C
A
S
I |
Symbol/Exchange
Company Name
Industry Group |
PRICE |
CHANGE
(%Change) |
Day High |
Volume
(% DAV)
(% 50 day avg vol) |
52 Wk Hi
% From Hi |
Featured
Date |
Price
Featured |
Pivot Featured |
|
Max Buy |
HTHT
-
NASDAQ
China Lodging Group Ads
LEISURE - Lodging
|
$133.89
|
+5.23
4.06% |
$134.52
|
553,090
139.32% of 50 DAV
50 DAV is 397,000
|
$142.80
-6.24%
|
9/29/2016
|
$46.12
|
PP = $47.82
|
|
MB = $50.21
|
Most Recent Note - 10/26/2017 3:59:43 PM
G - Gapped down today yet rebounded from early lows near its 50 DMA line ($120.70). There was a "negative reversal" on the prior session and it is very extended from any sound base. Earnings +19% on +18% sales revenues for the Jun '17 quarter were below the +25% minimum earnings guideline (C criteria).
>>> FEATURED STOCK ARTICLE : Holding Ground Stubbornly After Considerable Rally - 10/5/2017 |
View all notes |
Set NEW NOTE alert |
Company Profile |
SEC
News |
Chart |
Request a new note
C
A
S
I |
LMAT
-
NASDAQ
Lemaitre Vascular Inc
Medical-Products
|
$32.01
|
+1.11
3.59% |
$32.15
|
340,363
167.50% of 50 DAV
50 DAV is 203,200
|
$39.88
-19.73%
|
7/28/2017
|
$33.50
|
PP = $33.32
|
|
MB = $34.99
|
Most Recent Note - 10/27/2017 10:10:28 AM
G - Gapped down today violating its 50 DMA line, raising concerns and triggering technical sell signals. Briefly undercut its 200 DMA line ($29.83), an important long-term average which may act as a support level. Reported Sep '17 quarterly earnings +47% on +7% sales revenues.
>>> FEATURED STOCK ARTICLE : Consolidating Above 50-Day Moving Average Before Earnings - 10/18/2017 |
View all notes |
Set NEW NOTE alert |
Company Profile |
SEC
News |
Chart |
Request a new note
C
A
S
I |
PATK
-
NASDAQ
Patrick Industries Inc
Bldg-Mobile/Mfg and RV
|
$93.00
|
+0.10
0.11% |
$96.25
|
123,593
164.79% of 50 DAV
50 DAV is 75,000
|
$94.45
-1.54%
|
10/26/2017
|
$90.90
|
PP = $87.90
|
|
MB = $92.30
|
Most Recent Note - 10/26/2017 6:08:38 PM
Y - Finished strong after highlighted in yellow in the mid-day report with new pivot point cited based on its 10/04/17 high. Hit a new high, triggering a technical buy signal with a big gain backed by 4 times average volume. Reported earnings +37% on +34% sales revenues for the Sep '17 quarter. It has earned a 96 Earnings Per Share rating and fundamentals remain strong. Leadership (L criteria) from others in the industry group (Building - Mobile/ Mfg & RV) is a reassuring sign. Went through a long and choppy consolidation since dropped from the Featured Stocks list on 3/09/17. See the latest FSU analysis for more details and a new annotated graph.
>>> FEATURED STOCK ARTICLE : Volume 4 Times Average Behind Breakout Gain on Earnings News - 10/26/2017 |
View all notes |
Set NEW NOTE alert |
Company Profile |
SEC
News |
Chart |
Request a new note
C
A
S
I |
ESNT
-
NYSE
Essent Group Ltd
Finance-MrtgandRel Svc
|
$42.62
|
-0.64
-1.48% |
$43.55
|
1,408,469
192.15% of 50 DAV
50 DAV is 733,000
|
$45.10
-5.50%
|
10/9/2017
|
$39.75
|
PP = $41.54
|
|
MB = $43.62
|
Most Recent Note - 10/30/2017 5:51:07 PM
Y - Color code is changed to yellow while quietly consolidating below its "max buy" level. Prior highs in the $41 area define near term support to watch above its 50 DMA line.
>>> FEATURED STOCK ARTICLE : Perched Near High After Streak of Gains - 10/24/2017 |
View all notes |
Set NEW NOTE alert |
Company Profile |
SEC
News |
Chart |
Request a new note
C
A
S
I |
FIVE
-
NASDAQ
Five Below Inc
Retail-DiscountandVariety
|
$55.25
|
-0.21
-0.38% |
$56.37
|
641,893
72.61% of 50 DAV
50 DAV is 884,000
|
$58.07
-4.86%
|
10/6/2017
|
$57.13
|
PP = $54.23
|
|
MB = $56.94
|
 Most Recent Note - 10/31/2017 5:05:37 PM
Y - Consolidating above prior highs in the $54 area defining initial support to watch above its 50 DMA line ($52.75). See the latest FSU analysis for more details and a new annotated graph.
>>> FEATURED STOCK ARTICLE : Prior Highs Define Important Support While Consolidating - 10/31/2017 |
View all notes |
Set NEW NOTE alert |
Company Profile |
SEC
News |
Chart |
Request a new note
C
A
S
I |
Symbol/Exchange
Company Name
Industry Group |
PRICE |
CHANGE
(%Change) |
Day High |
Volume
(% DAV)
(% 50 day avg vol) |
52 Wk Hi
% From Hi |
Featured
Date |
Price
Featured |
Pivot Featured |
|
Max Buy |
OLED
-
NASDAQ
Universal Display Corp
Elec-Misc Products
|
$146.50
|
+7.90
5.70% |
$149.85
|
1,717,761
211.03% of 50 DAV
50 DAV is 814,000
|
$145.30
0.83%
|
8/31/2017
|
$128.22
|
PP = $127.78
|
|
MB = $134.17
|
Most Recent Note - 10/31/2017 12:53:13 PM
G - Hitting a new high with today's big gain, rising from a riskier "late stage" base pattern. Due to report Sep '17 quarterly results after the close on Thursday, November 2nd. Volume and volatility often increase near earnings news. Its 50 DMA line ($129.66) and prior highs in the $130 area define important near-term support to watch on pullbacks.
>>> FEATURED STOCK ARTICLE : Prior Highs and 50-Day Average Define Near-Term Support - 10/25/2017 |
View all notes |
Set NEW NOTE alert |
Company Profile |
SEC
News |
Chart |
Request a new note
C
A
S
I |
ANET
-
NYSE
Arista Networks Inc
TELECOMMUNICATIONS - Communication Equipment
|
$199.89
|
+3.73
1.90% |
$201.95
|
806,364
135.52% of 50 DAV
50 DAV is 595,000
|
$200.82
-0.46%
|
10/27/2017
|
$195.65
|
PP = $196.37
|
|
MB = $206.19
|
Most Recent Note - 10/30/2017 12:50:35 PM
Y - Gapped up and hit another new high today then erased the gain and dipped into the red. Gains have recently lacked great volume conviction after it formed an advanced "3-weeks tight" base. Subsequent volume-driven gains above the new pivot point cited may trigger a new (or add-on) technical buy signal. Its 50 DMA line ($184) defines near-term support to watch on pullbacks. Fundamentals remain very strong. Due to report earnings for the Sep '17 quarter after U.S. markets close on Thursday, November 2nd. Volume and volatility often increase near earnings news.
>>> FEATURED STOCK ARTICLE : Perched Near All-Time High, Extended From Any Sound Base - 10/16/2017 |
View all notes |
Set NEW NOTE alert |
Company Profile |
SEC
News |
Chart |
Request a new note
C
A
S
I |
GRUB
-
NYSE
Grubhub Inc
COMPUTER SOFTWARE and SERVICES - Technical and System Software
|
$61.02
|
+1.34
2.25% |
$61.05
|
1,957,054
108.79% of 50 DAV
50 DAV is 1,799,000
|
$61.07
-0.08%
|
6/21/2017
|
$47.33
|
PP = $46.94
|
|
MB = $49.29
|
Most Recent Note - 10/27/2017 6:58:27 PM
G - Technically strong, it hit another new high with today's 4th consecutive gain in an impressive streak of gains. Rebound above its 50 DMA line ($53.92) helped its outlook improve this week. However, it reported Sep '17 quarterly earnings +22% on +32% sales revenues, its 2nd consecutive quarter below the +25% minimum earnings guideline (C criteria), so fundamental concerns remain with regard to the fact-based investment system. See the latest FSU analysis for more details and a new annotated graph.
>>> FEATURED STOCK ARTICLE : Technical Strength in Popular Internet Platform - 10/27/2017 |
View all notes |
Set NEW NOTE alert |
Company Profile |
SEC
News |
Chart |
Request a new note
C
A
S
I |
IBP
-
NYSE
Installed Building Prod
DIVERSIFIED SERVICES - Business/Management Services
|
$69.70
|
+2.50
3.72% |
$69.85
|
144,658
93.33% of 50 DAV
50 DAV is 155,000
|
$67.50
3.26%
|
9/19/2017
|
$59.15
|
PP = $60.10
|
|
MB = $63.11
|
Most Recent Note - 10/30/2017 5:56:08 PM
G - Posted a 3rd consecutive gain backed by light volume, wedging into new high territory. Its 50 DMA line defines near-term support along with prior highs in the $60 area.
>>> FEATURED STOCK ARTICLE : Building - Maintenance & Service Firm Extended From Latest Base - 10/9/2017 |
View all notes |
Set NEW NOTE alert |
Company Profile |
SEC
News |
Chart |
Request a new note
C
A
S
I |
OLLI
-
NASDAQ
Ollie's Bargain Outlet
Retail-DiscountandVariety
|
$44.65
|
+1.20
2.76% |
$45.13
|
481,883
90.41% of 50 DAV
50 DAV is 533,000
|
$46.90
-4.80%
|
9/8/2017
|
$45.20
|
PP = $46.18
|
|
MB = $48.49
|
Most Recent Note - 10/30/2017 5:39:53 PM
G - Abruptly retreated from its all-time high, violating its 50 DMA line ($45.01) line with a big volume-driven loss triggering a technical sell signal. Only a prompt rebound above the 50 DMA line would help its outlook improve. Color code was changed to green. Recent lows in the $43-44 area may act as support, but further deterioration would raise more serious concerns. See the latest FSU analysis for more details and a new annotated graph.
>>> FEATURED STOCK ARTICLE : Sell Signal Triggered by 50-Day Moving Average Violation on Higher Volume - 10/30/2017 |
View all notes |
Set NEW NOTE alert |
Company Profile |
SEC
News |
Chart |
Request a new note
C
A
S
I |
Symbol/Exchange
Company Name
Industry Group |
PRICE |
CHANGE
(%Change) |
Day High |
Volume
(% DAV)
(% 50 day avg vol) |
52 Wk Hi
% From Hi |
Featured
Date |
Price
Featured |
Pivot Featured |
|
Max Buy |
HLI
-
NYSE
Houlihan Lokey Inc Cl A
Finance-Invest Bnk/Bkrs
|
$41.63
|
+0.35
0.85% |
$41.91
|
450,739
162.14% of 50 DAV
50 DAV is 278,000
|
$44.15
-5.71%
|
9/18/2017
|
$37.04
|
PP = $39.78
|
|
MB = $41.77
|
Most Recent Note - 10/26/2017 12:58:36 PM
Y - Gapped down today after pricing a Secondary Offering, abruptly retreating from its all-time high hit on the prior session. Such offerings typically hinder price performance short-term, yet also help attract new or greater institutional interest (I criteria). Its color code is changed to yellow after pulling back below the "max buy" level. Reported earnings +51% on +30% sales revenues for its second quarter ended September 30th versus the year-ago period. See the latest FSU analysis for more details and an annotated graph.
>>> FEATURED STOCK ARTICLE : Recent Gains Lacked Volume; Earnings Report Due Soon - 10/23/2017 |
View all notes |
Set NEW NOTE alert |
Company Profile |
SEC
News |
Chart |
Request a new note
C
A
S
I |
ICHR
-
NASDAQ
Ichor Holdings Ltd
ELECTRONICS - Semiconductor Equipment
|
$31.19
|
+0.24
0.78% |
$32.25
|
657,303
94.17% of 50 DAV
50 DAV is 698,000
|
$35.51
-12.17%
|
10/10/2017
|
$29.39
|
PP = $28.36
|
|
MB = $29.78
|
Most Recent Note - 10/27/2017 12:35:02 PM
G - Pulling back today for a 4th consecutive loss with above average volume. Prior highs in the $29 area define initial support to watch above its 50 DMA line.
>>> FEATURED STOCK ARTICLE : Semiconductor Equipment Firm Finished Strong After Highlighted - 10/10/2017 |
View all notes |
Set NEW NOTE alert |
Company Profile |
SEC
News |
Chart |
Request a new note
C
A
S
I |
|
|
|
THESE ARE NOT BUY RECOMMENDATIONS!
Comments contained in the body of this report are technical
opinions only. The material herein has been obtained
from sources believed to be reliable and accurate, however,
its accuracy and completeness cannot be guaranteed.
This site is not an investment advisor, hence it does
not endorse or recommend any securities or other investments.
Any recommendation contained in this report may not
be suitable for all investors and it is not to be deemed
an offer or solicitation on our part with respect to
the purchase or sale of any securities. All trademarks,
service marks and trade names appearing in this report
are the property of their respective owners, and are
likewise used for identification purposes only.
This report is a service available
only to active Paid Premium Members.
You may opt-out of receiving report notifications
at any time. Questions or comments may be submitted
by writing to Premium Membership Services 665 S.E. 10 Street, Suite 201 Deerfield Beach, FL 33441-5634 or by calling 1-800-965-8307
or 954-785-1121.
|
|
|