You are not logged in.
This means you
CAN ONLY VIEW reports that were published prior to Thursday, March 20, 2025.
You
MUST UPGRADE YOUR MEMBERSHIP if you want to see any current reports.
AFTER MARKET UPDATE - FRIDAY, OCTOBER 27TH, 2017
Previous After Market Report Next After Market Report >>>
|
|
|
|
DOW |
+33.33 |
23,434.19 |
+0.14% |
|
Volume |
892,637,080 |
+2% |
|
Volume |
2,415,348,180 |
+14% |
|
NASDAQ |
+144.49 |
6,701.26 |
+2.20% |
|
Advancers |
1,782 |
61% |
|
Advancers |
1,465 |
61% |
|
S&P 500 |
+20.67 |
2,581.07 |
+0.81% |
|
Decliners |
1,141 |
39% |
|
Decliners |
942 |
39% |
|
Russell 2000 |
+10.86 |
1,508.32 |
+0.73% |
|
52 Wk Highs |
181 |
|
|
52 Wk Highs |
197 |
|
|
S&P 600 |
+5.21 |
916.43 |
+0.57% |
|
52 Wk Lows |
77 |
|
|
52 Wk Lows |
76 |
|
|
 |
Indices Rally to Close Week at Record Levels Again
Kenneth J. Gruneisen - Passed the CAN SLIM® Master's Exam
For the week, the S&P 500 climbed 0.2% while the Dow gained 0.4% and the Nasdaq advanced 1.1%. Stocks were higher Friday. The Dow added 33 points to 23434. The S&P 500 gained 20 points to 2581. The Nasdaq Composite climbed 144 points to 6701. Volume totals reported were higher than the prior session totals on the NYSE and on the Nasdaq exchange. Breadth was positive as advancers led decliners by a 3-2 margin on both the NYSE and the Nasdaq exchange. There were 97 high-ranked companies from the Leaders List that made new 52-week highs and were listed on the BreakOuts Page, versus the total of 103 on the prior session. New 52-week highs totals solidly outnumbered new 52-week lows on both the Nasdaq exchange and NYSE. The Featured Stocks Page provides the latest analysis on noteworthy high-ranked leaders. Charts used courtesy of www.stockcharts.com
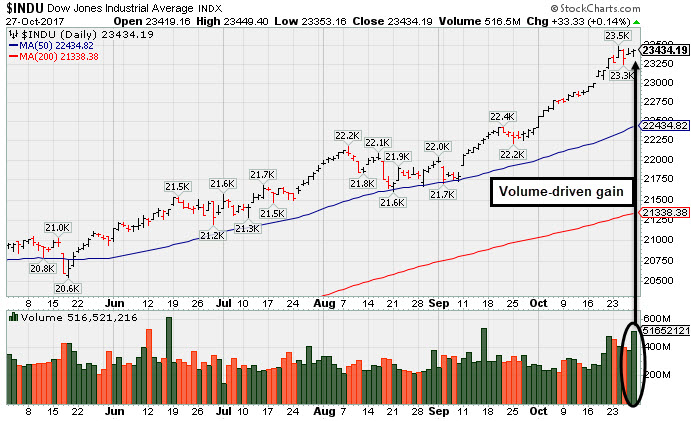 PICTURED: The Dow Jones Industrial Average posted a gain with higher volume, ending perched near its record high.
The major averages' (M criteria) are in a confirmed uptrend. Leadership has remained healthy. Investors should buy stocks meeting all key criteria of the fact-based investment system on a case-by-case basis as they trigger technical buy signals.
The major averages closed at record levels as investors digested positive earnings releases from the world’s largest technology firms. Amazon, Alphabet, and Microsoft added over $130 billion in market-cap today, equivalent to the size of McDonalds. In economic news, the Commerce Department reported third-quarter GDP annualized growth rate was 3.0%, higher than consensus expectations of 2.5%. In a separate release, The University of Michigan revealed its consumer sentiment index climbed in October to 100.7 from 95.1 in September, the highest level since 2004. In central bank news, reports indicated John Powell is the top candidate to head the Federal Reserve once Janet Yellen’s term ends.
Six of 11 S&P 500 sectors were higher with Technology a sizeable outperformer. Amazon.com (AMZN +13.22%), Google parent Alphabet (GOOGL +4.26%), and Microsoft (MSFT +6.41%) rallied after all three posted quarterly results above consensus expectations. Expedia (EXPE -15.99%) fell after a disappointing quarterly release.
Treasuries were higher with the yield on the benchmark 10-year note falling 3 basis points to 2.42%. In commodities, NYMEX WTI crude gained 2.5% to $53.93/barrel. COMEX gold was down 0.8% to $1268.50 amid a stronger dollar. |
 Kenneth J. Gruneisen started out as a licensed stockbroker in August 1987, a couple of months prior to the historic stock market crash that took the Dow Jones Industrial Average down -22.6% in a single day. He has published daily fact-based fundamental and technical analysis on high-ranked stocks online for two decades. Through FACTBASEDINVESTING.COM, Kenneth provides educational articles, news, market commentary, and other information regarding proven investment systems that work in good times and bad.
Comments contained in the body of this report are technical opinions only and are not necessarily those of Gruneisen Growth Corp. The material herein has been obtained from sources believed to be reliable and accurate, however, its accuracy and completeness cannot be guaranteed. Our firm, employees, and customers may effect transactions, including transactions contrary to any recommendation herein, or have positions in the securities mentioned herein or options with respect thereto. Any recommendation contained in this report may not be suitable for all investors and it is not to be deemed an offer or solicitation on our part with respect to the purchase or sale of any securities. |
|
 |
Retail Index Posted Standout Gain
Kenneth J. Gruneisen - Passed the CAN SLIM® Master's Exam
On Friday the Financials were mixed as the Bank Index ($BKX +0.26%) edged higher but the Broker/Dealer Index ($XBD -0.44%) fell. The Retail Index ($RLX +3.65%) was a standout gainer. The tech sector saw its best gains coming from the Semiconductor Index ($SOX +2.14%) and the Biotechnology Index ($BTK +0.86%), meanwhile the Networking Index ($NWX +0.02%) finished the session unchanged. Commodity-linked groups had a positive bias as Gold & Silver Index ($XAU +0.59%), Oil Services Index ($OSX +0.56%), and the Integrated Oil Index ($XOI +0.80%) posted unanimous gains. Charts courtesy www.stockcharts.com
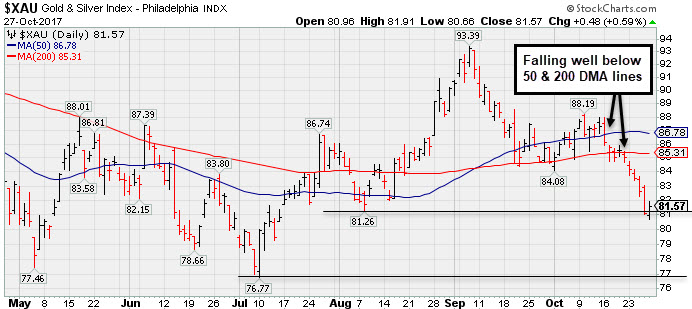 PICTURED: The Gold & Silver Index ($XAU +0.59%) in the past 2 weeks has slumped below its 50-day and 200-day moving average (DMA) lines again. Friday's gain halted its slide near the August low.
| Oil Services |
$OSX |
128.32 |
+0.71 |
+0.56% |
-30.18% |
| Integrated Oil |
$XOI |
1,221.93 |
+9.67 |
+0.80% |
-3.63% |
| Semiconductor |
$SOX |
1,263.55 |
+26.52 |
+2.14% |
+39.39% |
| Networking |
$NWX |
463.15 |
+0.11 |
+0.02% |
+3.82% |
| Broker/Dealer |
$XBD |
247.22 |
-1.08 |
-0.44% |
+20.43% |
| Retail |
$RLX |
1,604.97 |
+56.47 |
+3.65% |
+19.51% |
| Gold & Silver |
$XAU |
81.57 |
+0.48 |
+0.59% |
+3.44% |
| Bank |
$BKX |
102.23 |
+0.27 |
+0.26% |
+11.37% |
| Biotech |
$BTK |
4,116.16 |
+35.14 |
+0.86% |
+33.86% |
|
|
|
 |
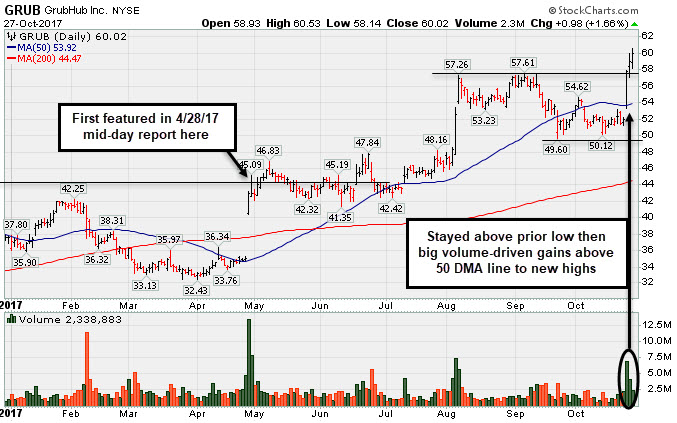
Technical Strength in Popular Internet Platform
Kenneth J. Gruneisen - Passed the CAN SLIM® Master's Exam
Grubhub Inc (GRUB +$0.98 or +1.66% to $60.02) has been very strong technically, and it hit another new high with today's 4th consecutive gain. The impressive rebound above its 50-day moving average (DMA) line on 10/25/17 helped its outlook improve as volume behind the big gain was +310% above its average daily volume. However, it reported Sep '17 quarterly earnings +22% on +32% sales revenues, marking its 2nd consecutive quarter below the +25% minimum earnings guideline (C criteria). So, fundamental concerns remain with regard to the fact-based investment system's guidelines for buy candidates.
GRUB has earned a current Timeliness rating of B and also a Sponsorship rating of B. It is up +35.3% since first highlighted in yellow with pivot point cited based on its 9/29/16 high plus 10 cents in the 4/28/17 mid-day report (read here). Its annual earnings (A criteria) history has been very strong since the high ranked Internet Content firm completed a new Public Offering on 9/03/14.
It slumped but avoided undercutting its prior low ($49.60 on 9/22/17) since last shown in this FSU section on 10/02/17 with an annotated graph under the headline, "Gain Above 50-Day Moving Average Line Helped Technical Stance". The number of top-rated funds owning its shares rose from 318 in Jun '16 to 428 in Sep '17, a reassuring sign concerning the I criteria. The current Up/Down Volume Ratio of 1.1 is an unbiased indication its shares have been under slight accumulation over the past 50 days. It has a fairly small supply of only 83.8 million shares (S criteria) outstanding, which can contribute to greater price volatility in the event of institutional buying or selling.
|
|
|
Color Codes Explained :
Y - Better candidates highlighted by our
staff of experts.
G - Previously featured
in past reports as yellow but may no longer be buyable under the
guidelines.
***Last / Change / Volume data in this table is the closing quote data***
Symbol/Exchange
Company Name
Industry Group |
PRICE |
CHANGE
(%Change) |
Day High |
Volume
(% DAV)
(% 50 day avg vol) |
52 Wk Hi
% From Hi |
Featured
Date |
Price
Featured |
Pivot Featured |
|
Max Buy |
MPX
-
NYSE
Marine Products Corp
AUTOMOTIVE - Recreational Vehicles
|
$14.37
|
+0.01
0.07% |
$14.67
|
47,307
157.69% of 50 DAV
50 DAV is 30,000
|
$17.12
-16.06%
|
9/26/2017
|
$16.30
|
PP = $16.35
|
|
MB = $17.17
|
Most Recent Note - 10/25/2017 6:40:30 PM
G - Slumped below its 50 DMA line ($15.44) with a volume-driven loss. Only a prompt rebound above the 50 DMA would help its outlook improve. Reported earnings +18% on +7% sales revenues for the Sep '17 quarter, below the +25% minimum earnings guideline (C criteria), raising fundamental concerns.
>>> FEATURED STOCK ARTICLE : Violation of 50 Day Moving Average Line Hurt Technical Stance - 10/20/2017 |
View all notes |
Set NEW NOTE alert |
Company Profile |
SEC
News |
Chart |
Request a new note
C
A
S
I |
THO
-
NYSE
Thor Industries Inc
AUTOMOTIVE - Recreational Vehicles
|
$134.96
|
+1.72
1.29% |
$135.04
|
464,232
65.85% of 50 DAV
50 DAV is 705,000
|
$133.86
0.82%
|
8/14/2017
|
$106.67
|
PP = $110.01
|
|
MB = $115.51
|
Most Recent Note - 10/26/2017 4:06:27 PM
G - Volume totals have been cooling in recent weeks while wedging to new all-time highs. On track for a 10th consecutive weekly gain, very extended from the previously noted base. Its 50 DMA line ($118) defines near-term support above prior highs in the $115 area. Fundamentals remain strong.
>>> FEATURED STOCK ARTICLE : Extended From Prior Base With Volume Totals Cooling - 10/13/2017 |
View all notes |
Set NEW NOTE alert |
Company Profile |
SEC
News |
Chart |
Request a new note
C
A
S
I |
PFBC
-
NASDAQ
Preferred Bank Los Angls
BANKING - Regional - Pacific Banks
|
$64.40
|
-1.19
-1.81% |
$66.03
|
85,387
115.39% of 50 DAV
50 DAV is 74,000
|
$66.58
-3.27%
|
10/10/2017
|
$59.38
|
PP = $59.08
|
|
MB = $62.03
|
Most Recent Note - 10/26/2017 6:15:10 PM
G - Hit another new high today. Triggered a technical buy signal on the prior session and quickly rallied above its "max buy" level. Its Relative Strength rating improved to 89. Prior highs in the $58 area define initial support to watch above its 50 DMA line ($56.28)
>>> FEATURED STOCK ARTICLE : Perched Near High Following Volume-Driven Breakout Gains - 10/11/2017 |
View all notes |
Set NEW NOTE alert |
Company Profile |
SEC
News |
Chart |
Request a new note
C
A
S
I |
AVGO
-
NASDAQ
Avago Technologies Ltd
ELECTRONICS - Semiconductor - Broad Line
|
$252.90
|
+9.14
3.75% |
$252.99
|
4,467,980
171.39% of 50 DAV
50 DAV is 2,606,900
|
$259.36
-2.49%
|
8/24/2017
|
$252.44
|
PP = $256.89
|
|
MB = $269.73
|
Most Recent Note - 10/26/2017 4:01:55 PM
G - Still quietly sputtering near its 50 DMA line ($245.95). Its Relative Strength rating has slumped to 73, below the 80+ minimum guideline for buy candidates. Subsequent losses below the recent low ($231.53 on 9/25/17) would raise serious concerns and trigger a more worrisome technical sell signal.
>>> FEATURED STOCK ARTICLE : Slumped Below 50-Day Moving Average Line Again - 10/17/2017 |
View all notes |
Set NEW NOTE alert |
Company Profile |
SEC
News |
Chart |
Request a new note
C
A
S
I |
YY
-
NASDAQ
YY Inc Ads
INTERNET - Internet Service Providers
|
$85.34
|
-1.81
-2.08% |
$88.00
|
1,365,596
90.38% of 50 DAV
50 DAV is 1,511,000
|
$97.59
-12.55%
|
9/25/2017
|
$80.26
|
PP = $83.10
|
|
MB = $87.26
|
Most Recent Note - 10/25/2017 6:37:19 PM
G - Encountered distributional pressure today with a big loss on higher (near average) volume. Extended from its prior base and prior highs in the $83 area defining support along with its 50 DMA line ($82.13).
>>> FEATURED STOCK ARTICLE : Extended After Rallying From Base - 10/19/2017 |
View all notes |
Set NEW NOTE alert |
Company Profile |
SEC
News |
Chart |
Request a new note
C
A
S
I |
Symbol/Exchange
Company Name
Industry Group |
PRICE |
CHANGE
(%Change) |
Day High |
Volume
(% DAV)
(% 50 day avg vol) |
52 Wk Hi
% From Hi |
Featured
Date |
Price
Featured |
Pivot Featured |
|
Max Buy |
STMP
-
NASDAQ
Stamps.com Inc
INTERNET - Internet Software and Services
|
$220.20
|
+6.20
2.90% |
$221.20
|
322,362
98.88% of 50 DAV
50 DAV is 326,000
|
$233.13
-5.54%
|
9/11/2017
|
$193.65
|
PP = $220.35
|
|
MB = $231.37
|
Most Recent Note - 10/26/2017 3:56:28 PM
Y - Reversed into the red today for a big loss on higher volume after hitting yet another new all-time high. Posted a solid gain backed by +71% above average volume on 10/24/17, however today's damaging loss has it falling back into the prior base, raising concerns. Its 50 DMA line ($207.32) defines important near-term support above the recent low ($195.05 on 9/28/17). Subsequent losses leading to violations would trigger technical sell signals.
>>> FEATURED STOCK ARTICLE : Perched Near Pivot Point With No Resistance Remaining - 10/4/2017 |
View all notes |
Set NEW NOTE alert |
Company Profile |
SEC
News |
Chart |
Request a new note
C
A
S
I |
HTHT
-
NASDAQ
China Lodging Group Ads
LEISURE - Lodging
|
$130.44
|
+0.26
0.20% |
$131.82
|
572,116
140.92% of 50 DAV
50 DAV is 406,000
|
$142.80
-8.66%
|
9/29/2016
|
$46.12
|
PP = $47.82
|
|
MB = $50.21
|
Most Recent Note - 10/26/2017 3:59:43 PM
G - Gapped down today yet rebounded from early lows near its 50 DMA line ($120.70). There was a "negative reversal" on the prior session and it is very extended from any sound base. Earnings +19% on +18% sales revenues for the Jun '17 quarter were below the +25% minimum earnings guideline (C criteria).
>>> FEATURED STOCK ARTICLE : Holding Ground Stubbornly After Considerable Rally - 10/5/2017 |
View all notes |
Set NEW NOTE alert |
Company Profile |
SEC
News |
Chart |
Request a new note
C
A
S
I |
LMAT
-
NASDAQ
Lemaitre Vascular Inc
Medical-Products
|
$31.26
|
-5.94
-15.97% |
$35.75
|
1,720,831
1,012.25% of 50 DAV
50 DAV is 170,000
|
$39.88
-21.61%
|
7/28/2017
|
$33.50
|
PP = $33.32
|
|
MB = $34.99
|
 Most Recent Note - 10/27/2017 10:10:28 AM
G - Gapped down today violating its 50 DMA line, raising concerns and triggering technical sell signals. Briefly undercut its 200 DMA line ($29.83), an important long-term average which may act as a support level. Reported Sep '17 quarterly earnings +47% on +7% sales revenues.
>>> FEATURED STOCK ARTICLE : Consolidating Above 50-Day Moving Average Before Earnings - 10/18/2017 |
View all notes |
Set NEW NOTE alert |
Company Profile |
SEC
News |
Chart |
Request a new note
C
A
S
I |
PATK
-
NASDAQ
Patrick Industries Inc
Bldg-Mobile/Mfg and RV
|
$91.80
|
-0.35
-0.38% |
$94.45
|
167,203
229.05% of 50 DAV
50 DAV is 73,000
|
$92.50
-0.76%
|
10/26/2017
|
$90.90
|
PP = $87.90
|
|
MB = $92.30
|
Most Recent Note - 10/26/2017 6:08:38 PM
Y - Finished strong after highlighted in yellow in the mid-day report with new pivot point cited based on its 10/04/17 high. Hit a new high, triggering a technical buy signal with a big gain backed by 4 times average volume. Reported earnings +37% on +34% sales revenues for the Sep '17 quarter. It has earned a 96 Earnings Per Share rating and fundamentals remain strong. Leadership (L criteria) from others in the industry group (Building - Mobile/ Mfg & RV) is a reassuring sign. Went through a long and choppy consolidation since dropped from the Featured Stocks list on 3/09/17. See the latest FSU analysis for more details and a new annotated graph.
>>> FEATURED STOCK ARTICLE : Volume 4 Times Average Behind Breakout Gain on Earnings News - 10/26/2017 |
View all notes |
Set NEW NOTE alert |
Company Profile |
SEC
News |
Chart |
Request a new note
C
A
S
I |
ESNT
-
NYSE
Essent Group Ltd
Finance-MrtgandRel Svc
|
$43.96
|
+0.23
0.53% |
$44.26
|
1,010,397
139.94% of 50 DAV
50 DAV is 722,000
|
$45.10
-2.53%
|
10/9/2017
|
$39.75
|
PP = $41.54
|
|
MB = $43.62
|
Most Recent Note - 10/24/2017 6:41:09 PM
G - Perched near its all-time high after a steak of gains. Color code is changed to green after getting extended from its previously noted base. Prior highs in the $41 area define near term support to watch above its 50 DMA line. See the latest FSU analysis for more details and a new annotated graph.
>>> FEATURED STOCK ARTICLE : Perched Near High After Streak of Gains - 10/24/2017 |
View all notes |
Set NEW NOTE alert |
Company Profile |
SEC
News |
Chart |
Request a new note
C
A
S
I |
Symbol/Exchange
Company Name
Industry Group |
PRICE |
CHANGE
(%Change) |
Day High |
Volume
(% DAV)
(% 50 day avg vol) |
52 Wk Hi
% From Hi |
Featured
Date |
Price
Featured |
Pivot Featured |
|
Max Buy |
FIVE
-
NASDAQ
Five Below Inc
Retail-DiscountandVariety
|
$55.45
|
-0.18
-0.32% |
$55.61
|
1,096,974
124.80% of 50 DAV
50 DAV is 879,000
|
$58.07
-4.51%
|
10/6/2017
|
$57.13
|
PP = $54.23
|
|
MB = $56.94
|
Most Recent Note - 10/24/2017 6:43:41 PM
Y - Perched near its "max buy" level after wedging higher with gains lacking great volume conviction. Prior highs in the $54 area define initial support to watch on pullbacks along with its 50 DMA line.
>>> FEATURED STOCK ARTICLE : Finished Strong With Above Average Volume Behind Big Gain - 10/6/2017 |
View all notes |
Set NEW NOTE alert |
Company Profile |
SEC
News |
Chart |
Request a new note
C
A
S
I |
OLED
-
NASDAQ
Universal Display Corp
Elec-Misc Products
|
$136.10
|
+2.55
1.91% |
$137.00
|
580,504
71.40% of 50 DAV
50 DAV is 813,000
|
$145.30
-6.33%
|
8/31/2017
|
$128.22
|
PP = $127.78
|
|
MB = $134.17
|
Most Recent Note - 10/25/2017 6:23:39 PM
Y - Consolidating below its "max buy" level and building on a new base, its color code is changed to yellow. Due to report Sep '17 quarterly results after the close on Thursday, November 2nd. Its 50 DMA line ($126) and recent lows define important near-term support to watch on pullbacks. See the latest FSU analysis for more details and a new annotated graph.
>>> FEATURED STOCK ARTICLE : Prior Highs and 50-Day Average Define Near-Term Support - 10/25/2017 |
View all notes |
Set NEW NOTE alert |
Company Profile |
SEC
News |
Chart |
Request a new note
C
A
S
I |
ANET
-
NYSE
Arista Networks Inc
TELECOMMUNICATIONS - Communication Equipment
|
$195.65
|
+3.82
1.99% |
$196.68
|
556,244
93.49% of 50 DAV
50 DAV is 595,000
|
$196.27
-0.32%
|
10/27/2017
|
$195.65
|
PP = $196.37
|
|
MB = $206.19
|
Most Recent Note - 10/27/2017 6:55:57 PM
Y - Posted a solid gain with average volume and touched a new all-time high. Color code is changed to yellow as it formed an advanced "3-weeks tight" base. Subsequent volume-driven gains above the new pivot point cited may trigger a new (or add-on) technical buy signal. Its 50 DMA line ($183.55) defines near-term support to watch on pullbacks. Fundamentals remain very strong. Due to report earnings for the Sep '17 quarter after U.S. markets close on Thursday, November 2nd. Volume and volatility often increase near earnings news.
>>> FEATURED STOCK ARTICLE : Perched Near All-Time High, Extended From Any Sound Base - 10/16/2017 |
View all notes |
Set NEW NOTE alert |
Company Profile |
SEC
News |
Chart |
Request a new note
C
A
S
I |
GRUB
-
NYSE
Grubhub Inc
COMPUTER SOFTWARE and SERVICES - Technical and System Software
|
$60.02
|
+0.98
1.66% |
$60.53
|
2,338,882
133.57% of 50 DAV
50 DAV is 1,751,000
|
$59.99
0.05%
|
6/21/2017
|
$47.33
|
PP = $46.94
|
|
MB = $49.29
|
Most Recent Note - 10/27/2017 6:58:27 PM
G - Technically strong, it hit another new high with today's 4th consecutive gain in an impressive streak of gains. Rebound above its 50 DMA line ($53.92) helped its outlook improve this week. However, it reported Sep '17 quarterly earnings +22% on +32% sales revenues, its 2nd consecutive quarter below the +25% minimum earnings guideline (C criteria), so fundamental concerns remain with regard to the fact-based investment system. See the latest FSU analysis for more details and a new annotated graph.
>>> FEATURED STOCK ARTICLE : Technical Strength in Popular Internet Platform - 10/27/2017 |
View all notes |
Set NEW NOTE alert |
Company Profile |
SEC
News |
Chart |
Request a new note
C
A
S
I |
IBP
-
NYSE
Installed Building Prod
DIVERSIFIED SERVICES - Business/Management Services
|
$66.65
|
+0.55
0.83% |
$66.90
|
102,937
65.99% of 50 DAV
50 DAV is 156,000
|
$67.15
-0.74%
|
9/19/2017
|
$59.15
|
PP = $60.10
|
|
MB = $63.11
|
Most Recent Note - 10/24/2017 6:47:10 PM
G - Extended from its prior base. Prior highs in the $60 area that define initial support coinciding with its 50 DMA line.
>>> FEATURED STOCK ARTICLE : Building - Maintenance & Service Firm Extended From Latest Base - 10/9/2017 |
View all notes |
Set NEW NOTE alert |
Company Profile |
SEC
News |
Chart |
Request a new note
C
A
S
I |
Symbol/Exchange
Company Name
Industry Group |
PRICE |
CHANGE
(%Change) |
Day High |
Volume
(% DAV)
(% 50 day avg vol) |
52 Wk Hi
% From Hi |
Featured
Date |
Price
Featured |
Pivot Featured |
|
Max Buy |
NCOM
-
NASDAQ
National Commerce Corporation
BANKING - Regional - Southeast Banks
|
$42.05
|
+0.15
0.36% |
$42.50
|
27,773
69.78% of 50 DAV
50 DAV is 39,800
|
$43.80
-4.00%
|
4/25/2017
|
$38.95
|
PP = $40.09
|
|
MB = $42.09
|
Most Recent Note - 10/25/2017 5:23:28 PM
G - Gapped down today and undercut its 50 DMA line then found prompt support and managed a "positive reversal". Prior highs and its 50 DMA line define support in the $41 area. Recently reported Jun '17 earnings +23% on +45% sales revenues, below the +25% minimum earnings guideline (C criteria), raising fundamental concerns.
>>> FEATURED STOCK ARTICLE : Holding Ground Following Impressive Volume-Driven Gains - 10/12/2017 |
View all notes |
Set NEW NOTE alert |
Company Profile |
SEC
News |
Chart |
Request a new note
C
A
S
I |
OLLI
-
NASDAQ
Ollie's Bargain Outlet
Retail-DiscountandVariety
|
$46.85
|
+0.40
0.86% |
$46.88
|
429,094
81.27% of 50 DAV
50 DAV is 528,000
|
$46.90
-0.11%
|
9/8/2017
|
$45.20
|
PP = $46.18
|
|
MB = $48.49
|
Most Recent Note - 10/24/2017 6:49:14 PM
Y - Volume totals have been cooling while hovering near its all-time high. Its 50 DMA line and recent lows in the $43-44 area define near-term support to watch on pullbacks. Recent gains above the latest pivot point did not meet the minimum +40% above average volume threshold necessary to trigger a proper new (or add-on) technical buy signal. Confirming volume-driven gains would be a reassuring sign of fresh institutional buying demand. Fundamentals remain strong.
>>> FEATURED STOCK ARTICLE : Quietly Hit New Highs Without Great Volume Conviction - 10/3/2017 |
View all notes |
Set NEW NOTE alert |
Company Profile |
SEC
News |
Chart |
Request a new note
C
A
S
I |
HLI
-
NYSE
Houlihan Lokey Inc Cl A
Finance-Invest Bnk/Bkrs
|
$41.73
|
+0.40
0.97% |
$41.87
|
297,940
111.17% of 50 DAV
50 DAV is 268,000
|
$44.15
-5.48%
|
9/18/2017
|
$37.04
|
PP = $39.78
|
|
MB = $41.77
|
Most Recent Note - 10/26/2017 12:58:36 PM
Y - Gapped down today after pricing a Secondary Offering, abruptly retreating from its all-time high hit on the prior session. Such offerings typically hinder price performance short-term, yet also help attract new or greater institutional interest (I criteria). Its color code is changed to yellow after pulling back below the "max buy" level. Reported earnings +51% on +30% sales revenues for its second quarter ended September 30th versus the year-ago period. See the latest FSU analysis for more details and an annotated graph.
>>> FEATURED STOCK ARTICLE : Recent Gains Lacked Volume; Earnings Report Due Soon - 10/23/2017 |
View all notes |
Set NEW NOTE alert |
Company Profile |
SEC
News |
Chart |
Request a new note
C
A
S
I |
ICHR
-
NASDAQ
Ichor Holdings Ltd
ELECTRONICS - Semiconductor Equipment
|
$31.08
|
-0.12
-0.38% |
$31.69
|
1,086,771
157.05% of 50 DAV
50 DAV is 692,000
|
$35.51
-12.48%
|
10/10/2017
|
$29.39
|
PP = $28.36
|
|
MB = $29.78
|
Most Recent Note - 10/27/2017 12:35:02 PM
G - Pulling back today for a 4th consecutive loss with above average volume. Prior highs in the $29 area define initial support to watch above its 50 DMA line.
>>> FEATURED STOCK ARTICLE : Semiconductor Equipment Firm Finished Strong After Highlighted - 10/10/2017 |
View all notes |
Set NEW NOTE alert |
Company Profile |
SEC
News |
Chart |
Request a new note
C
A
S
I |
|
|
|
THESE ARE NOT BUY RECOMMENDATIONS!
Comments contained in the body of this report are technical
opinions only. The material herein has been obtained
from sources believed to be reliable and accurate, however,
its accuracy and completeness cannot be guaranteed.
This site is not an investment advisor, hence it does
not endorse or recommend any securities or other investments.
Any recommendation contained in this report may not
be suitable for all investors and it is not to be deemed
an offer or solicitation on our part with respect to
the purchase or sale of any securities. All trademarks,
service marks and trade names appearing in this report
are the property of their respective owners, and are
likewise used for identification purposes only.
This report is a service available
only to active Paid Premium Members.
You may opt-out of receiving report notifications
at any time. Questions or comments may be submitted
by writing to Premium Membership Services 665 S.E. 10 Street, Suite 201 Deerfield Beach, FL 33441-5634 or by calling 1-800-965-8307
or 954-785-1121.
|
|
|