You are not logged in.
This means you
CAN ONLY VIEW reports that were published prior to Thursday, March 20, 2025.
You
MUST UPGRADE YOUR MEMBERSHIP if you want to see any current reports.
AFTER MARKET UPDATE - MONDAY, OCTOBER 30TH, 2017
Previous After Market Report Next After Market Report >>>
|
|
|
|
DOW |
-85.45 |
23,348.74 |
-0.36% |
|
Volume |
870,716,700 |
-2% |
|
Volume |
2,014,200,630 |
-17% |
|
NASDAQ |
-2.30 |
6,698.96 |
-0.03% |
|
Advancers |
1,141 |
39% |
|
Advancers |
918 |
35% |
|
S&P 500 |
-8.24 |
2,572.83 |
-0.32% |
|
Decliners |
1,795 |
61% |
|
Decliners |
1,722 |
65% |
|
Russell 2000 |
-17.42 |
1,490.90 |
-1.15% |
|
52 Wk Highs |
112 |
|
|
52 Wk Highs |
112 |
|
|
S&P 600 |
-12.95 |
903.48 |
-1.41% |
|
52 Wk Lows |
45 |
|
|
52 Wk Lows |
57 |
|
|
 |
Leadership Wanes as Indices Retreat from Record Highs
Kenneth J. Gruneisen - Passed the CAN SLIM® Master's Exam
Stocks were lower Monday. The Dow lost 85 points to 23348. The S&P 500 dropped 8 points to 2572. The Nasdaq Composite fell 2 points to 6698. Volume totals reported were higher than the prior session totals on the NYSE and on the Nasdaq exchange. Breadth was negative as decliners led advancers by a 3-2 margin on the NYSE and by nearly 2-1 on the Nasdaq exchange. Leadership waned as there were 65 high-ranked companies from the Leaders List that made new 52-week highs and were listed on the BreakOuts Page, versus the total of 97 on the prior session. New 52-week highs totals still outnumbered new 52-week lows on both the Nasdaq exchange and NYSE. The Featured Stocks Page provides the latest analysis on noteworthy high-ranked leaders. Charts used courtesy of www.stockcharts.com
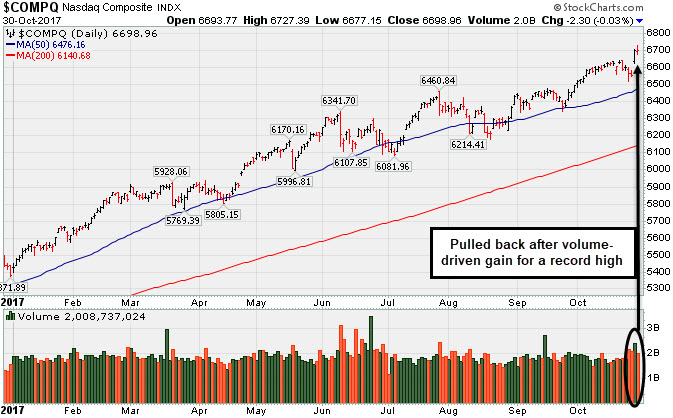 PICTURED: The Nasdaq Composite Index pulled back after a gain with higher volume for a record high.
The major averages' (M criteria) are in a confirmed uptrend. Leadership has remained healthy. Investors should buy stocks meeting all key criteria of the fact-based investment system on a case-by-case basis as they trigger technical buy signals.
The major averages dropped from last week’s record levels as investors assessed the latest tax reform updates. A release from Bloomberg reported the House is discussing plans to build in a gradual reduction to the corporate tax rate over a five year span as opposed to a onetime adjustment. On the data front, personal income rose 0.4% and spending increased 1.0% in September, matching consensus estimates. In central bank news, an additional Bloomberg report revealed President Trump will make his selection for the next Fed chair on Thursday.
Seven of 11 S&P 500 sectors were lower on the session. Technology outperformed as Apple (AAPL +2.25%) on reports of high demand for the IPhone X. In other news, Merck & Co (MRK -6.06%) and General Motors (GM -2.84%) fell on negative analyst commentary surrounding both companies. In M&A news, T-Mobile (TMUS -5.35%) and Sprint (S -9.30%) fell following reports the companies ended merger talks without a deal.
Treasuries were higher with the yield on the benchmark 10-year note down five basis points to 2.36%. In commodities, NYMEX WTI crude added 0.5% to $54.17/barrel. COMEX gold gained 0.4% to $1277.20/ounce amid a weaker dollar. |
 Kenneth J. Gruneisen started out as a licensed stockbroker in August 1987, a couple of months prior to the historic stock market crash that took the Dow Jones Industrial Average down -22.6% in a single day. He has published daily fact-based fundamental and technical analysis on high-ranked stocks online for two decades. Through FACTBASEDINVESTING.COM, Kenneth provides educational articles, news, market commentary, and other information regarding proven investment systems that work in good times and bad.
Comments contained in the body of this report are technical opinions only and are not necessarily those of Gruneisen Growth Corp. The material herein has been obtained from sources believed to be reliable and accurate, however, its accuracy and completeness cannot be guaranteed. Our firm, employees, and customers may effect transactions, including transactions contrary to any recommendation herein, or have positions in the securities mentioned herein or options with respect thereto. Any recommendation contained in this report may not be suitable for all investors and it is not to be deemed an offer or solicitation on our part with respect to the purchase or sale of any securities. |
|
 |
Commodity-Linked Groups Rose; Financials and Retail Index Fell
Kenneth J. Gruneisen - Passed the CAN SLIM® Master's Exam
On Monday the Bank Index ($BKX -0.46%), Broker/Dealer Index ($XBD -0.48%), and the Retail Index ($RLX -0.35%) each fell half a percentage point or less. The tech sector was indecisive as the Semiconductor Index ($SOX +0.19%) edged higher and the Biotechnology Index ($BTK +0.00%) finished flat while the Networking Index ($NWX -0.41%) ended slightly lower on the session. Commodity-linked groups had a positive bias as Gold & Silver Index ($XAU +0.99%), Oil Services Index ($OSX +2.34%), and the Integrated Oil Index ($XOI +0.64%) posted unanimous gains. Charts courtesy www.stockcharts.com
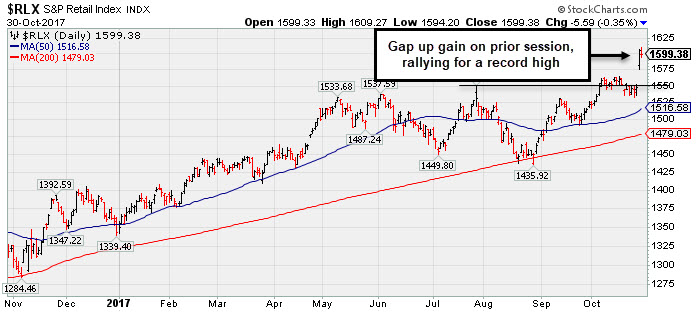 PICTURED: The Retail Index ($RLX -0.35%) is perched at a record high following Friday's considerable gap up gain.
| Oil Services |
$OSX |
131.32 |
+3.00 |
+2.34% |
-28.55% |
| Integrated Oil |
$XOI |
1,229.77 |
+7.84 |
+0.64% |
-3.01% |
| Semiconductor |
$SOX |
1,265.91 |
+2.36 |
+0.19% |
+39.65% |
| Networking |
$NWX |
461.24 |
-1.91 |
-0.41% |
+3.39% |
| Broker/Dealer |
$XBD |
246.04 |
-1.18 |
-0.48% |
+19.86% |
| Retail |
$RLX |
1,599.38 |
-5.59 |
-0.35% |
+19.09% |
| Gold & Silver |
$XAU |
82.37 |
+0.80 |
+0.98% |
+4.45% |
| Bank |
$BKX |
101.76 |
-0.47 |
-0.46% |
+10.86% |
| Biotech |
$BTK |
4,116.34 |
+0.18 |
+0.00% |
+33.86% |
|
|
|
 |
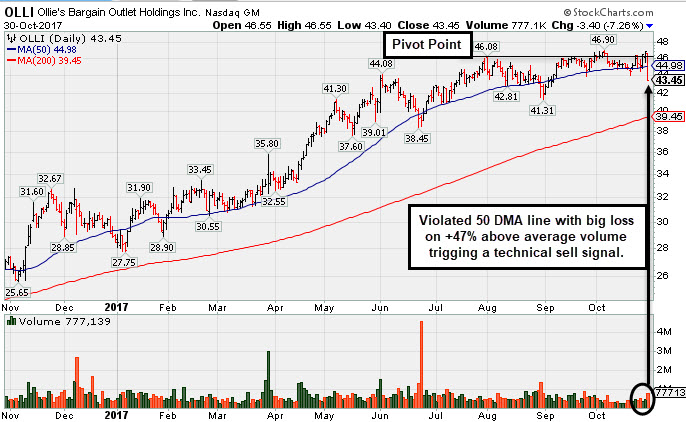
Sell Signal Triggered by 50-Day Moving Average Violation on Higher Volume
Kenneth J. Gruneisen - Passed the CAN SLIM® Master's Exam
Ollie's Bargain Outlet (OLLI -$3.40 or -7.26% to $43.45) abruptly retreated from its all-time high with a big loss today, violating its 50 DMA line ($45.01) line and triggering a technical sell signal. Its color code was changed to green. Only a prompt rebound above the 50 DMA line would help its outlook improve. It may find support near recent lows in the $43-44 area, but further deterioration would raise more serious concerns.
OLLI was last shown in this FSU section on 10/03/17 with an annotated graph under the headline, "Quietly Hit New Highs Without Great Volume Conviction". After a new pivot point was cited based on its 8/01/17 high plus 10 cents, members were repeatedly reminded - "Recent gains above the latest pivot point did not meet the minimum +40% above average volume threshold necessary to trigger a proper new (or add-on) technical buy signal. Confirming volume-driven gains would be a reassuring sign of fresh institutional buying demand."
Fundamentals remain strong. Recently it reported earnings +29% on +21% sales revenues for the Jul '17 quarter, continuing its strong earnings track record and meeting the +25% minimum earnings guideline (C criteria). It has earned a very strong 97 Earnings Per Share (EPS) rating.
The Retail - Discount & Variety firm traded up as much as +77.4% since highlighted in yellow with a pivot point based on its 4/28/16 high plus 10 cents in 7/19/16 mid-day report (read here). OLLI completed its $16 IPO on 7/16/15. It completed a Secondary Offerings on 6/06/16 and 2/18/16. The number of top-rated funds owning its shares rose from 98 in Sep '15 to 405 in Sep '17, a reassuring sign concerning the I criteria. Its small supply of only 61.4 million shares outstanding (S criteria) can contribute to greater price volatility in the event of institutional buying or selling.
|
|
|
Color Codes Explained :
Y - Better candidates highlighted by our
staff of experts.
G - Previously featured
in past reports as yellow but may no longer be buyable under the
guidelines.
***Last / Change / Volume data in this table is the closing quote data***
Symbol/Exchange
Company Name
Industry Group |
PRICE |
CHANGE
(%Change) |
Day High |
Volume
(% DAV)
(% 50 day avg vol) |
52 Wk Hi
% From Hi |
Featured
Date |
Price
Featured |
Pivot Featured |
|
Max Buy |
MPX
-
NYSE
Marine Products Corp
AUTOMOTIVE - Recreational Vehicles
|
$13.97
|
-0.40
-2.78% |
$14.38
|
41,600
138.67% of 50 DAV
50 DAV is 30,000
|
$17.12
-18.40%
|
9/26/2017
|
$16.30
|
PP = $16.35
|
|
MB = $17.17
|
 Most Recent Note - 10/30/2017 5:42:24 PM
Slumped further below its 50 DMA line ($15.41) with today's volume-driven loss. It will be dropped from the Featured Stocks list tonight. Recently reported earnings +18% on +7% sales revenues for the Sep '17 quarter, below the +25% minimum earnings guideline (C criteria), raising fundamental concerns.
>>> FEATURED STOCK ARTICLE : Violation of 50 Day Moving Average Line Hurt Technical Stance - 10/20/2017 |
View all notes |
Set NEW NOTE alert |
Company Profile |
SEC
News |
Chart |
Request a new note
C
A
S
I |
THO
-
NYSE
Thor Industries Inc
AUTOMOTIVE - Recreational Vehicles
|
$134.68
|
-0.28
-0.21% |
$135.12
|
655,845
92.63% of 50 DAV
50 DAV is 708,000
|
$135.04
-0.27%
|
8/14/2017
|
$106.67
|
PP = $110.01
|
|
MB = $115.51
|
Most Recent Note - 10/26/2017 4:06:27 PM
G - Volume totals have been cooling in recent weeks while wedging to new all-time highs. On track for a 10th consecutive weekly gain, very extended from the previously noted base. Its 50 DMA line ($118) defines near-term support above prior highs in the $115 area. Fundamentals remain strong.
>>> FEATURED STOCK ARTICLE : Extended From Prior Base With Volume Totals Cooling - 10/13/2017 |
View all notes |
Set NEW NOTE alert |
Company Profile |
SEC
News |
Chart |
Request a new note
C
A
S
I |
PFBC
-
NASDAQ
Preferred Bank Los Angls
BANKING - Regional - Pacific Banks
|
$62.00
|
-2.40
-3.73% |
$64.44
|
88,630
119.77% of 50 DAV
50 DAV is 74,000
|
$66.58
-6.88%
|
10/10/2017
|
$59.38
|
PP = $59.08
|
|
MB = $62.03
|
Most Recent Note - 10/30/2017 5:48:58 PM
Y - Pulled back near its "max buy" level today and its color code is changed to yellow. It triggered a technical buy signal on 10/25/17 but quickly got extended. Prior highs in the $60 area define initial support to watch.
>>> FEATURED STOCK ARTICLE : Perched Near High Following Volume-Driven Breakout Gains - 10/11/2017 |
View all notes |
Set NEW NOTE alert |
Company Profile |
SEC
News |
Chart |
Request a new note
C
A
S
I |
AVGO
-
NASDAQ
Avago Technologies Ltd
ELECTRONICS - Semiconductor - Broad Line
|
$261.23
|
+8.33
3.29% |
$262.20
|
4,966,553
187.35% of 50 DAV
50 DAV is 2,650,900
|
$259.36
0.72%
|
10/30/2017
|
$261.19
|
PP = $259.46
|
|
MB = $272.43
|
Most Recent Note - 10/30/2017 12:59:39 PM
Y - Powering to new 52-week and all-time highs with today's 2nd consecutive volume-driven gain. Color code is changed to yellow with new pivot point cited based on its 8/24/17 high plus 10 cents. A gain above the pivot point backed by at least +40% above average volume is needed to trigger a proper new (or add-on) technical buy signal. Prior session's gain above its 50 DMA line ($246) helped its outlook improve, however its current Relative Strength rating of 78 remains below the 80+ minimum guideline for buy candidates. Subsequent losses below the recent low ($231.53 on 9/25/17) would raise serious concerns and trigger a more worrisome technical sell signal.
>>> FEATURED STOCK ARTICLE : Slumped Below 50-Day Moving Average Line Again - 10/17/2017 |
View all notes |
Set NEW NOTE alert |
Company Profile |
SEC
News |
Chart |
Request a new note
C
A
S
I |
YY
-
NASDAQ
YY Inc Ads
INTERNET - Internet Service Providers
|
$87.37
|
+2.03
2.38% |
$89.85
|
1,414,951
94.84% of 50 DAV
50 DAV is 1,492,000
|
$97.59
-10.47%
|
9/25/2017
|
$80.26
|
PP = $83.10
|
|
MB = $87.26
|
Most Recent Note - 10/30/2017 6:07:44 PM
G - Halted its slide with a gain today following 4 consecutive losses. Prior highs in the $83 area coincide with its 50 DMA line ($82.98) defining important neat-term support to watch.
>>> FEATURED STOCK ARTICLE : Extended After Rallying From Base - 10/19/2017 |
View all notes |
Set NEW NOTE alert |
Company Profile |
SEC
News |
Chart |
Request a new note
C
A
S
I |
Symbol/Exchange
Company Name
Industry Group |
PRICE |
CHANGE
(%Change) |
Day High |
Volume
(% DAV)
(% 50 day avg vol) |
52 Wk Hi
% From Hi |
Featured
Date |
Price
Featured |
Pivot Featured |
|
Max Buy |
STMP
-
NASDAQ
Stamps.com Inc
INTERNET - Internet Software and Services
|
$223.30
|
+3.10
1.41% |
$225.74
|
310,081
95.12% of 50 DAV
50 DAV is 326,000
|
$233.13
-4.21%
|
9/11/2017
|
$193.65
|
PP = $220.35
|
|
MB = $231.37
|
Most Recent Note - 10/26/2017 3:56:28 PM
Y - Reversed into the red today for a big loss on higher volume after hitting yet another new all-time high. Posted a solid gain backed by +71% above average volume on 10/24/17, however today's damaging loss has it falling back into the prior base, raising concerns. Its 50 DMA line ($207.32) defines important near-term support above the recent low ($195.05 on 9/28/17). Subsequent losses leading to violations would trigger technical sell signals.
>>> FEATURED STOCK ARTICLE : Perched Near Pivot Point With No Resistance Remaining - 10/4/2017 |
View all notes |
Set NEW NOTE alert |
Company Profile |
SEC
News |
Chart |
Request a new note
C
A
S
I |
HTHT
-
NASDAQ
China Lodging Group Ads
LEISURE - Lodging
|
$128.66
|
-1.78
-1.36% |
$131.57
|
444,361
112.50% of 50 DAV
50 DAV is 395,000
|
$142.80
-9.90%
|
9/29/2016
|
$46.12
|
PP = $47.82
|
|
MB = $50.21
|
Most Recent Note - 10/26/2017 3:59:43 PM
G - Gapped down today yet rebounded from early lows near its 50 DMA line ($120.70). There was a "negative reversal" on the prior session and it is very extended from any sound base. Earnings +19% on +18% sales revenues for the Jun '17 quarter were below the +25% minimum earnings guideline (C criteria).
>>> FEATURED STOCK ARTICLE : Holding Ground Stubbornly After Considerable Rally - 10/5/2017 |
View all notes |
Set NEW NOTE alert |
Company Profile |
SEC
News |
Chart |
Request a new note
C
A
S
I |
LMAT
-
NASDAQ
Lemaitre Vascular Inc
Medical-Products
|
$30.90
|
-0.36
-1.15% |
$31.22
|
400,564
200.68% of 50 DAV
50 DAV is 199,600
|
$39.88
-22.52%
|
7/28/2017
|
$33.50
|
PP = $33.32
|
|
MB = $34.99
|
Most Recent Note - 10/27/2017 10:10:28 AM
G - Gapped down today violating its 50 DMA line, raising concerns and triggering technical sell signals. Briefly undercut its 200 DMA line ($29.83), an important long-term average which may act as a support level. Reported Sep '17 quarterly earnings +47% on +7% sales revenues.
>>> FEATURED STOCK ARTICLE : Consolidating Above 50-Day Moving Average Before Earnings - 10/18/2017 |
View all notes |
Set NEW NOTE alert |
Company Profile |
SEC
News |
Chart |
Request a new note
C
A
S
I |
PATK
-
NASDAQ
Patrick Industries Inc
Bldg-Mobile/Mfg and RV
|
$92.90
|
+1.10
1.20% |
$92.95
|
97,904
130.54% of 50 DAV
50 DAV is 75,000
|
$94.45
-1.64%
|
10/26/2017
|
$90.90
|
PP = $87.90
|
|
MB = $92.30
|
Most Recent Note - 10/26/2017 6:08:38 PM
Y - Finished strong after highlighted in yellow in the mid-day report with new pivot point cited based on its 10/04/17 high. Hit a new high, triggering a technical buy signal with a big gain backed by 4 times average volume. Reported earnings +37% on +34% sales revenues for the Sep '17 quarter. It has earned a 96 Earnings Per Share rating and fundamentals remain strong. Leadership (L criteria) from others in the industry group (Building - Mobile/ Mfg & RV) is a reassuring sign. Went through a long and choppy consolidation since dropped from the Featured Stocks list on 3/09/17. See the latest FSU analysis for more details and a new annotated graph.
>>> FEATURED STOCK ARTICLE : Volume 4 Times Average Behind Breakout Gain on Earnings News - 10/26/2017 |
View all notes |
Set NEW NOTE alert |
Company Profile |
SEC
News |
Chart |
Request a new note
C
A
S
I |
ESNT
-
NYSE
Essent Group Ltd
Finance-MrtgandRel Svc
|
$43.26
|
-0.70
-1.59% |
$44.08
|
684,781
93.42% of 50 DAV
50 DAV is 733,000
|
$45.10
-4.08%
|
10/9/2017
|
$39.75
|
PP = $41.54
|
|
MB = $43.62
|
Most Recent Note - 10/30/2017 5:51:07 PM
Y - Color code is changed to yellow while quietly consolidating below its "max buy" level. Prior highs in the $41 area define near term support to watch above its 50 DMA line.
>>> FEATURED STOCK ARTICLE : Perched Near High After Streak of Gains - 10/24/2017 |
View all notes |
Set NEW NOTE alert |
Company Profile |
SEC
News |
Chart |
Request a new note
C
A
S
I |
Symbol/Exchange
Company Name
Industry Group |
PRICE |
CHANGE
(%Change) |
Day High |
Volume
(% DAV)
(% 50 day avg vol) |
52 Wk Hi
% From Hi |
Featured
Date |
Price
Featured |
Pivot Featured |
|
Max Buy |
FIVE
-
NASDAQ
Five Below Inc
Retail-DiscountandVariety
|
$55.46
|
+0.01
0.02% |
$55.66
|
793,903
89.91% of 50 DAV
50 DAV is 883,000
|
$58.07
-4.49%
|
10/6/2017
|
$57.13
|
PP = $54.23
|
|
MB = $56.94
|
Most Recent Note - 10/30/2017 5:52:53 PM
Y - Consolidating above prior highs in the $54 area defining initial support to watch above its 50 DMA line ($52.62).
>>> FEATURED STOCK ARTICLE : Finished Strong With Above Average Volume Behind Big Gain - 10/6/2017 |
View all notes |
Set NEW NOTE alert |
Company Profile |
SEC
News |
Chart |
Request a new note
C
A
S
I |
OLED
-
NASDAQ
Universal Display Corp
Elec-Misc Products
|
$138.60
|
+2.50
1.84% |
$140.00
|
707,393
86.90% of 50 DAV
50 DAV is 814,000
|
$145.30
-4.61%
|
8/31/2017
|
$128.22
|
PP = $127.78
|
|
MB = $134.17
|
Most Recent Note - 10/30/2017 6:04:54 PM
G - Rose above its "max buy" level and its color code is changed to green. Still building on a new base pattern. Due to report Sep '17 quarterly results after the close on Thursday, November 2nd. Its 50 DMA line ($128) and recent lows define important near-term support to watch on pullbacks.
>>> FEATURED STOCK ARTICLE : Prior Highs and 50-Day Average Define Near-Term Support - 10/25/2017 |
View all notes |
Set NEW NOTE alert |
Company Profile |
SEC
News |
Chart |
Request a new note
C
A
S
I |
ANET
-
NYSE
Arista Networks Inc
TELECOMMUNICATIONS - Communication Equipment
|
$196.16
|
+0.51
0.26% |
$200.82
|
835,726
141.41% of 50 DAV
50 DAV is 591,000
|
$196.68
-0.26%
|
10/27/2017
|
$195.65
|
PP = $196.37
|
|
MB = $206.19
|
Most Recent Note - 10/30/2017 12:50:35 PM
Y - Gapped up and hit another new high today then erased the gain and dipped into the red. Gains have recently lacked great volume conviction after it formed an advanced "3-weeks tight" base. Subsequent volume-driven gains above the new pivot point cited may trigger a new (or add-on) technical buy signal. Its 50 DMA line ($184) defines near-term support to watch on pullbacks. Fundamentals remain very strong. Due to report earnings for the Sep '17 quarter after U.S. markets close on Thursday, November 2nd. Volume and volatility often increase near earnings news.
>>> FEATURED STOCK ARTICLE : Perched Near All-Time High, Extended From Any Sound Base - 10/16/2017 |
View all notes |
Set NEW NOTE alert |
Company Profile |
SEC
News |
Chart |
Request a new note
C
A
S
I |
GRUB
-
NYSE
Grubhub Inc
COMPUTER SOFTWARE and SERVICES - Technical and System Software
|
$59.68
|
-0.34
-0.57% |
$61.07
|
2,117,101
119.01% of 50 DAV
50 DAV is 1,779,000
|
$60.53
-1.40%
|
6/21/2017
|
$47.33
|
PP = $46.94
|
|
MB = $49.29
|
Most Recent Note - 10/27/2017 6:58:27 PM
G - Technically strong, it hit another new high with today's 4th consecutive gain in an impressive streak of gains. Rebound above its 50 DMA line ($53.92) helped its outlook improve this week. However, it reported Sep '17 quarterly earnings +22% on +32% sales revenues, its 2nd consecutive quarter below the +25% minimum earnings guideline (C criteria), so fundamental concerns remain with regard to the fact-based investment system. See the latest FSU analysis for more details and a new annotated graph.
>>> FEATURED STOCK ARTICLE : Technical Strength in Popular Internet Platform - 10/27/2017 |
View all notes |
Set NEW NOTE alert |
Company Profile |
SEC
News |
Chart |
Request a new note
C
A
S
I |
IBP
-
NYSE
Installed Building Prod
DIVERSIFIED SERVICES - Business/Management Services
|
$67.20
|
+0.55
0.83% |
$67.50
|
115,977
74.34% of 50 DAV
50 DAV is 156,000
|
$67.15
0.07%
|
9/19/2017
|
$59.15
|
PP = $60.10
|
|
MB = $63.11
|
Most Recent Note - 10/30/2017 5:56:08 PM
G - Posted a 3rd consecutive gain backed by light volume, wedging into new high territory. Its 50 DMA line defines near-term support along with prior highs in the $60 area.
>>> FEATURED STOCK ARTICLE : Building - Maintenance & Service Firm Extended From Latest Base - 10/9/2017 |
View all notes |
Set NEW NOTE alert |
Company Profile |
SEC
News |
Chart |
Request a new note
C
A
S
I |
Symbol/Exchange
Company Name
Industry Group |
PRICE |
CHANGE
(%Change) |
Day High |
Volume
(% DAV)
(% 50 day avg vol) |
52 Wk Hi
% From Hi |
Featured
Date |
Price
Featured |
Pivot Featured |
|
Max Buy |
NCOM
-
NASDAQ
National Commerce Corporation
BANKING - Regional - Southeast Banks
|
$41.05
|
-1.00
-2.38% |
$42.05
|
19,362
50.03% of 50 DAV
50 DAV is 38,700
|
$43.80
-6.28%
|
4/25/2017
|
$38.95
|
PP = $40.09
|
|
MB = $42.09
|
Most Recent Note - 10/30/2017 6:00:53 PM
Slumped to a close below its 50 DMA line ($41.23) today raising concerns. Only a prompt rebound would help its outlook improve. Prior highs in the $41 area may act as support. Its Relative Strength rating has slumped to 72, below the 80+ minimum guideline for buy candidates. Recently reported Sep '17 earnings +7% on +44% sales revenues, below the +25% minimum earnings guideline (C criteria), raising fundamental concerns. It will be dropped from the Featured Stocks list tonight.
>>> FEATURED STOCK ARTICLE : Holding Ground Following Impressive Volume-Driven Gains - 10/12/2017 |
View all notes |
Set NEW NOTE alert |
Company Profile |
SEC
News |
Chart |
Request a new note
C
A
S
I |
OLLI
-
NASDAQ
Ollie's Bargain Outlet
Retail-DiscountandVariety
|
$43.45
|
-3.40
-7.26% |
$46.55
|
775,270
146.83% of 50 DAV
50 DAV is 528,000
|
$46.90
-7.36%
|
9/8/2017
|
$45.20
|
PP = $46.18
|
|
MB = $48.49
|
Most Recent Note - 10/30/2017 5:39:53 PM
G - Abruptly retreated from its all-time high, violating its 50 DMA line ($45.01) line with a big volume-driven loss triggering a technical sell signal. Only a prompt rebound above the 50 DMA line would help its outlook improve. Color code was changed to green. Recent lows in the $43-44 area may act as support, but further deterioration would raise more serious concerns. See the latest FSU analysis for more details and a new annotated graph.
>>> FEATURED STOCK ARTICLE : Sell Signal Triggered by 50-Day Moving Average Violation on Higher Volume - 10/30/2017 |
View all notes |
Set NEW NOTE alert |
Company Profile |
SEC
News |
Chart |
Request a new note
C
A
S
I |
HLI
-
NYSE
Houlihan Lokey Inc Cl A
Finance-Invest Bnk/Bkrs
|
$41.28
|
-0.45
-1.08% |
$42.16
|
567,334
209.35% of 50 DAV
50 DAV is 271,000
|
$44.15
-6.50%
|
9/18/2017
|
$37.04
|
PP = $39.78
|
|
MB = $41.77
|
Most Recent Note - 10/26/2017 12:58:36 PM
Y - Gapped down today after pricing a Secondary Offering, abruptly retreating from its all-time high hit on the prior session. Such offerings typically hinder price performance short-term, yet also help attract new or greater institutional interest (I criteria). Its color code is changed to yellow after pulling back below the "max buy" level. Reported earnings +51% on +30% sales revenues for its second quarter ended September 30th versus the year-ago period. See the latest FSU analysis for more details and an annotated graph.
>>> FEATURED STOCK ARTICLE : Recent Gains Lacked Volume; Earnings Report Due Soon - 10/23/2017 |
View all notes |
Set NEW NOTE alert |
Company Profile |
SEC
News |
Chart |
Request a new note
C
A
S
I |
ICHR
-
NASDAQ
Ichor Holdings Ltd
ELECTRONICS - Semiconductor Equipment
|
$30.95
|
-0.13
-0.42% |
$31.74
|
541,779
76.96% of 50 DAV
50 DAV is 704,000
|
$35.51
-12.84%
|
10/10/2017
|
$29.39
|
PP = $28.36
|
|
MB = $29.78
|
Most Recent Note - 10/27/2017 12:35:02 PM
G - Pulling back today for a 4th consecutive loss with above average volume. Prior highs in the $29 area define initial support to watch above its 50 DMA line.
>>> FEATURED STOCK ARTICLE : Semiconductor Equipment Firm Finished Strong After Highlighted - 10/10/2017 |
View all notes |
Set NEW NOTE alert |
Company Profile |
SEC
News |
Chart |
Request a new note
C
A
S
I |
|
|
|
THESE ARE NOT BUY RECOMMENDATIONS!
Comments contained in the body of this report are technical
opinions only. The material herein has been obtained
from sources believed to be reliable and accurate, however,
its accuracy and completeness cannot be guaranteed.
This site is not an investment advisor, hence it does
not endorse or recommend any securities or other investments.
Any recommendation contained in this report may not
be suitable for all investors and it is not to be deemed
an offer or solicitation on our part with respect to
the purchase or sale of any securities. All trademarks,
service marks and trade names appearing in this report
are the property of their respective owners, and are
likewise used for identification purposes only.
This report is a service available
only to active Paid Premium Members.
You may opt-out of receiving report notifications
at any time. Questions or comments may be submitted
by writing to Premium Membership Services 665 S.E. 10 Street, Suite 201 Deerfield Beach, FL 33441-5634 or by calling 1-800-965-8307
or 954-785-1121.
|
|
|