***Last / Change / Volume data in this table is the closing quote data***
Symbol/Exchange
Company Name
Industry Group |
PRICE |
CHANGE
(%Change) |
Day High |
Volume
(% DAV)
(% 50 day avg vol) |
52 Wk Hi
% From Hi |
Featured
Date |
Price
Featured |
Pivot Featured |
|
Max Buy |
MPX
-
NYSE
Marine Products Corp
AUTOMOTIVE - Recreational Vehicles
|
$14.36
|
-0.33
-2.25% |
$14.75
|
31,085
103.62% of 50 DAV
50 DAV is 30,000
|
$17.12
-16.12%
|
9/26/2017
|
$16.30
|
PP = $16.35
|
|
MB = $17.17
|
Most Recent Note - 10/25/2017 6:40:30 PM
G - Slumped below its 50 DMA line ($15.44) with a volume-driven loss. Only a prompt rebound above the 50 DMA would help its outlook improve. Reported earnings +18% on +7% sales revenues for the Sep '17 quarter, below the +25% minimum earnings guideline (C criteria), raising fundamental concerns.
>>> FEATURED STOCK ARTICLE : Violation of 50 Day Moving Average Line Hurt Technical Stance - 10/20/2017 |
View all notes |
Set NEW NOTE alert |
Company Profile |
SEC
News |
Chart |
Request a new note
C
A
S
I |
THO
-
NYSE
Thor Industries Inc
AUTOMOTIVE - Recreational Vehicles
|
$133.24
|
+1.68
1.28% |
$133.86
|
542,383
77.26% of 50 DAV
50 DAV is 702,000
|
$133.29
-0.03%
|
8/14/2017
|
$106.67
|
PP = $110.01
|
|
MB = $115.51
|
 Most Recent Note - 10/26/2017 4:06:27 PM
G - Volume totals have been cooling in recent weeks while wedging to new all-time highs. On track for a 10th consecutive weekly gain, very extended from the previously noted base. Its 50 DMA line ($118) defines near-term support above prior highs in the $115 area. Fundamentals remain strong.
>>> FEATURED STOCK ARTICLE : Extended From Prior Base With Volume Totals Cooling - 10/13/2017 |
View all notes |
Set NEW NOTE alert |
Company Profile |
SEC
News |
Chart |
Request a new note
C
A
S
I |
PFBC
-
NASDAQ
Preferred Bank Los Angls
BANKING - Regional - Pacific Banks
|
$65.59
|
+1.27
1.97% |
$66.58
|
150,320
205.92% of 50 DAV
50 DAV is 73,000
|
$65.19
0.61%
|
10/10/2017
|
$59.38
|
PP = $59.08
|
|
MB = $62.03
|
Most Recent Note - 10/26/2017 6:15:10 PM
G - Hit another new high today. Triggered a technical buy signal on the prior session and quickly rallied above its "max buy" level. Its Relative Strength rating improved to 89. Prior highs in the $58 area define initial support to watch above its 50 DMA line ($56.28)
>>> FEATURED STOCK ARTICLE : Perched Near High Following Volume-Driven Breakout Gains - 10/11/2017 |
View all notes |
Set NEW NOTE alert |
Company Profile |
SEC
News |
Chart |
Request a new note
C
A
S
I |
AVGO
-
NASDAQ
Avago Technologies Ltd
ELECTRONICS - Semiconductor - Broad Line
|
$243.76
|
-2.06
-0.84% |
$247.85
|
2,443,326
94.38% of 50 DAV
50 DAV is 2,588,800
|
$259.36
-6.01%
|
8/24/2017
|
$252.44
|
PP = $256.89
|
|
MB = $269.73
|
Most Recent Note - 10/26/2017 4:01:55 PM
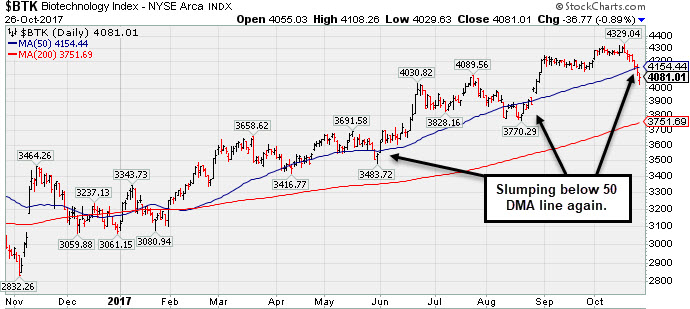
G - Still quietly sputtering near its 50 DMA line ($245.95). Its Relative Strength rating has slumped to 73, below the 80+ minimum guideline for buy candidates. Subsequent losses below the recent low ($231.53 on 9/25/17) would raise serious concerns and trigger a more worrisome technical sell signal.
>>> FEATURED STOCK ARTICLE : Slumped Below 50-Day Moving Average Line Again - 10/17/2017 |
View all notes |
Set NEW NOTE alert |
Company Profile |
SEC
News |
Chart |
Request a new note
C
A
S
I |
YY
-
NASDAQ
YY Inc Ads
INTERNET - Internet Service Providers
|
$87.15
|
-2.83
-3.15% |
$90.68
|
1,212,273
74.69% of 50 DAV
50 DAV is 1,623,000
|
$97.59
-10.70%
|
9/25/2017
|
$80.26
|
PP = $83.10
|
|
MB = $87.26
|
Most Recent Note - 10/25/2017 6:37:19 PM
G - Encountered distributional pressure today with a big loss on higher (near average) volume. Extended from its prior base and prior highs in the $83 area defining support along with its 50 DMA line ($82.13).
>>> FEATURED STOCK ARTICLE : Extended After Rallying From Base - 10/19/2017 |
View all notes |
Set NEW NOTE alert |
Company Profile |
SEC
News |
Chart |
Request a new note
C
A
S
I |
Symbol/Exchange
Company Name
Industry Group |
PRICE |
CHANGE
(%Change) |
Day High |
Volume
(% DAV)
(% 50 day avg vol) |
52 Wk Hi
% From Hi |
Featured
Date |
Price
Featured |
Pivot Featured |
|
Max Buy |
STMP
-
NASDAQ
Stamps.com Inc
INTERNET - Internet Software and Services
|
$214.00
|
-15.85
-6.90% |
$233.13
|
616,730
192.73% of 50 DAV
50 DAV is 320,000
|
$231.40
-7.52%
|
9/11/2017
|
$193.65
|
PP = $220.35
|
|
MB = $231.37
|
Most Recent Note - 10/26/2017 3:56:28 PM
Y - Reversed into the red today for a big loss on higher volume after hitting yet another new all-time high. Posted a solid gain backed by +71% above average volume on 10/24/17, however today's damaging loss has it falling back into the prior base, raising concerns. Its 50 DMA line ($207.32) defines important near-term support above the recent low ($195.05 on 9/28/17). Subsequent losses leading to violations would trigger technical sell signals.
>>> FEATURED STOCK ARTICLE : Perched Near Pivot Point With No Resistance Remaining - 10/4/2017 |
View all notes |
Set NEW NOTE alert |
Company Profile |
SEC
News |
Chart |
Request a new note
C
A
S
I |
HTHT
-
NASDAQ
China Lodging Group Ads
LEISURE - Lodging
|
$130.18
|
-5.41
-3.99% |
$132.94
|
745,022
187.19% of 50 DAV
50 DAV is 398,000
|
$142.80
-8.84%
|
9/29/2016
|
$46.12
|
PP = $47.82
|
|
MB = $50.21
|
Most Recent Note - 10/26/2017 3:59:43 PM
G - Gapped down today yet rebounded from early lows near its 50 DMA line ($120.70). There was a "negative reversal" on the prior session and it is very extended from any sound base. Earnings +19% on +18% sales revenues for the Jun '17 quarter were below the +25% minimum earnings guideline (C criteria).
>>> FEATURED STOCK ARTICLE : Holding Ground Stubbornly After Considerable Rally - 10/5/2017 |
View all notes |
Set NEW NOTE alert |
Company Profile |
SEC
News |
Chart |
Request a new note
C
A
S
I |
LMAT
-
NASDAQ
Lemaitre Vascular Inc
Medical-Products
|
$37.20
|
-0.76
-2.00% |
$38.24
|
191,991
113.60% of 50 DAV
50 DAV is 169,000
|
$39.88
-6.72%
|
7/28/2017
|
$33.50
|
PP = $33.32
|
|
MB = $34.99
|
Most Recent Note - 10/26/2017 4:03:26 PM
G - Hovering near its all-time high and just above near-term support at its 50 DMA line and prior highs in the $36 area. Violations would raise concerns and trigger technical sell signals. Due to report Sep '17 quarterly earnings on 10/26/17 after the close.
>>> FEATURED STOCK ARTICLE : Consolidating Above 50-Day Moving Average Before Earnings - 10/18/2017 |
View all notes |
Set NEW NOTE alert |
Company Profile |
SEC
News |
Chart |
Request a new note
C
A
S
I |
PATK
-
NASDAQ
Patrick Industries Inc
WHOLESALE - Building Materials Wholesale
|
$92.15
|
+7.70
9.12% |
$92.50
|
281,097
407.39% of 50 DAV
50 DAV is 69,000
|
$88.14
4.55%
|
10/26/2017
|
$90.90
|
PP = $87.90
|
|
MB = $92.30
|
Most Recent Note - 10/26/2017 6:08:38 PM
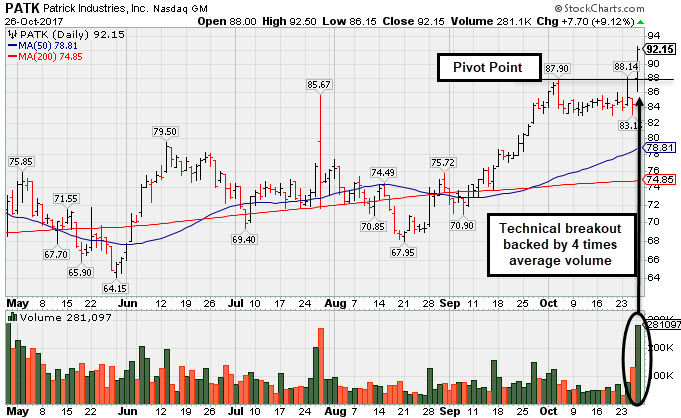
Y - Finished strong after highlighted in yellow in the mid-day report with new pivot point cited based on its 10/04/17 high. Hit a new high, triggering a technical buy signal with a big gain backed by 4 times average volume. Reported earnings +37% on +34% sales revenues for the Sep '17 quarter. It has earned a 96 Earnings Per Share rating and fundamentals remain strong. Leadership (L criteria) from others in the industry group (Building - Mobile/ Mfg & RV) is a reassuring sign. Went through a long and choppy consolidation since dropped from the Featured Stocks list on 3/09/17. See the latest FSU analysis for more details and a new annotated graph.
>>> FEATURED STOCK ARTICLE : Volume 4 Times Average Behind Breakout Gain on Earnings News - 10/26/2017 |
View all notes |
Set NEW NOTE alert |
Company Profile |
SEC
News |
Chart |
Request a new note
C
A
S
I |
ESNT
-
NYSE
Essent Group Ltd
Finance-MrtgandRel Svc
|
$43.73
|
+0.31
0.71% |
$44.53
|
1,088,602
153.54% of 50 DAV
50 DAV is 709,000
|
$45.10
-3.04%
|
10/9/2017
|
$39.75
|
PP = $41.54
|
|
MB = $43.62
|
Most Recent Note - 10/24/2017 6:41:09 PM
G - Perched near its all-time high after a steak of gains. Color code is changed to green after getting extended from its previously noted base. Prior highs in the $41 area define near term support to watch above its 50 DMA line. See the latest FSU analysis for more details and a new annotated graph.
>>> FEATURED STOCK ARTICLE : Perched Near High After Streak of Gains - 10/24/2017 |
View all notes |
Set NEW NOTE alert |
Company Profile |
SEC
News |
Chart |
Request a new note
C
A
S
I |
Symbol/Exchange
Company Name
Industry Group |
PRICE |
CHANGE
(%Change) |
Day High |
Volume
(% DAV)
(% 50 day avg vol) |
52 Wk Hi
% From Hi |
Featured
Date |
Price
Featured |
Pivot Featured |
|
Max Buy |
FIVE
-
NASDAQ
Five Below Inc
Retail-DiscountandVariety
|
$55.63
|
-0.17
-0.30% |
$56.71
|
675,085
76.28% of 50 DAV
50 DAV is 885,000
|
$58.07
-4.20%
|
10/6/2017
|
$57.13
|
PP = $54.23
|
|
MB = $56.94
|
Most Recent Note - 10/24/2017 6:43:41 PM
Y - Perched near its "max buy" level after wedging higher with gains lacking great volume conviction. Prior highs in the $54 area define initial support to watch on pullbacks along with its 50 DMA line.
>>> FEATURED STOCK ARTICLE : Finished Strong With Above Average Volume Behind Big Gain - 10/6/2017 |
View all notes |
Set NEW NOTE alert |
Company Profile |
SEC
News |
Chart |
Request a new note
C
A
S
I |
OLED
-
NASDAQ
Universal Display Corp
Elec-Misc Products
|
$133.55
|
+0.95
0.72% |
$134.35
|
269,120
32.90% of 50 DAV
50 DAV is 818,000
|
$145.30
-8.09%
|
8/31/2017
|
$128.22
|
PP = $127.78
|
|
MB = $134.17
|
Most Recent Note - 10/25/2017 6:23:39 PM
Y - Consolidating below its "max buy" level and building on a new base, its color code is changed to yellow. Due to report Sep '17 quarterly results after the close on Thursday, November 2nd. Its 50 DMA line ($126) and recent lows define important near-term support to watch on pullbacks. See the latest FSU analysis for more details and a new annotated graph.
>>> FEATURED STOCK ARTICLE : Prior Highs and 50-Day Average Define Near-Term Support - 10/25/2017 |
View all notes |
Set NEW NOTE alert |
Company Profile |
SEC
News |
Chart |
Request a new note
C
A
S
I |
ANET
-
NYSE
Arista Networks Inc
TELECOMMUNICATIONS - Communication Equipment
|
$191.83
|
+2.22
1.17% |
$193.90
|
428,306
70.91% of 50 DAV
50 DAV is 604,000
|
$196.27
-2.26%
|
8/4/2017
|
$173.31
|
PP = $163.07
|
|
MB = $171.22
|
Most Recent Note - 10/23/2017 6:58:08 PM
G - Quietly perched near its all-time high, extended from any sound base. Its 50 DMA line ($181) defines near-term support to watch on pullbacks. Fundamentals remain very strong.
>>> FEATURED STOCK ARTICLE : Perched Near All-Time High, Extended From Any Sound Base - 10/16/2017 |
View all notes |
Set NEW NOTE alert |
Company Profile |
SEC
News |
Chart |
Request a new note
C
A
S
I |
GRUB
-
NYSE
Grubhub Inc
COMPUTER SOFTWARE and SERVICES - Technical and System Software
|
$59.04
|
+1.25
2.16% |
$59.99
|
4,004,361
237.23% of 50 DAV
50 DAV is 1,688,000
|
$57.93
1.92%
|
6/21/2017
|
$47.33
|
PP = $46.94
|
|
MB = $49.29
|
Most Recent Note - 10/26/2017 6:17:31 PM
G - Technically strong, it hit another new high with today's 3rd consecutive volume-driven gain. Rebound above its 50 DMA line ($53.79) helped its outlook improve. However, it reported Sep '17 quarterly earnings +22% on +32% sales revenues, its 2nd consecutive quarter below the +25% minimum earnings guideline (C criteria), so fundamental concerns remain with regard to the fact-based investment system.
>>> FEATURED STOCK ARTICLE : Gain Above 50-Day Moving Average Line Helped Technical Stance - 10/2/2017 |
View all notes |
Set NEW NOTE alert |
Company Profile |
SEC
News |
Chart |
Request a new note
C
A
S
I |
IBP
-
NYSE
Installed Building Prod
DIVERSIFIED SERVICES - Business/Management Services
|
$66.10
|
+1.50
2.32% |
$66.35
|
90,283
57.87% of 50 DAV
50 DAV is 156,000
|
$67.15
-1.56%
|
9/19/2017
|
$59.15
|
PP = $60.10
|
|
MB = $63.11
|
Most Recent Note - 10/24/2017 6:47:10 PM
G - Extended from its prior base. Prior highs in the $60 area that define initial support coinciding with its 50 DMA line.
>>> FEATURED STOCK ARTICLE : Building - Maintenance & Service Firm Extended From Latest Base - 10/9/2017 |
View all notes |
Set NEW NOTE alert |
Company Profile |
SEC
News |
Chart |
Request a new note
C
A
S
I |
Symbol/Exchange
Company Name
Industry Group |
PRICE |
CHANGE
(%Change) |
Day High |
Volume
(% DAV)
(% 50 day avg vol) |
52 Wk Hi
% From Hi |
Featured
Date |
Price
Featured |
Pivot Featured |
|
Max Buy |
NCOM
-
NASDAQ
National Commerce Corporation
BANKING - Regional - Southeast Banks
|
$41.90
|
-0.45
-1.06% |
$42.55
|
26,153
65.71% of 50 DAV
50 DAV is 39,800
|
$43.80
-4.34%
|
4/25/2017
|
$38.95
|
PP = $40.09
|
|
MB = $42.09
|
Most Recent Note - 10/25/2017 5:23:28 PM
G - Gapped down today and undercut its 50 DMA line then found prompt support and managed a "positive reversal". Prior highs and its 50 DMA line define support in the $41 area. Recently reported Jun '17 earnings +23% on +45% sales revenues, below the +25% minimum earnings guideline (C criteria), raising fundamental concerns.
>>> FEATURED STOCK ARTICLE : Holding Ground Following Impressive Volume-Driven Gains - 10/12/2017 |
View all notes |
Set NEW NOTE alert |
Company Profile |
SEC
News |
Chart |
Request a new note
C
A
S
I |
OLLI
-
NASDAQ
Ollie's Bargain Outlet
Retail-DiscountandVariety
|
$46.45
|
+1.45
3.22% |
$46.50
|
349,813
66.13% of 50 DAV
50 DAV is 529,000
|
$46.90
-0.96%
|
9/8/2017
|
$45.20
|
PP = $46.18
|
|
MB = $48.49
|
Most Recent Note - 10/24/2017 6:49:14 PM
Y - Volume totals have been cooling while hovering near its all-time high. Its 50 DMA line and recent lows in the $43-44 area define near-term support to watch on pullbacks. Recent gains above the latest pivot point did not meet the minimum +40% above average volume threshold necessary to trigger a proper new (or add-on) technical buy signal. Confirming volume-driven gains would be a reassuring sign of fresh institutional buying demand. Fundamentals remain strong.
>>> FEATURED STOCK ARTICLE : Quietly Hit New Highs Without Great Volume Conviction - 10/3/2017 |
View all notes |
Set NEW NOTE alert |
Company Profile |
SEC
News |
Chart |
Request a new note
C
A
S
I |
HLI
-
NYSE
Houlihan Lokey Inc Cl A
Finance-Invest Bnk/Bkrs
|
$41.33
|
-2.04
-4.70% |
$41.68
|
2,092,101
913.58% of 50 DAV
50 DAV is 229,000
|
$44.15
-6.39%
|
9/18/2017
|
$37.04
|
PP = $39.78
|
|
MB = $41.77
|
Most Recent Note - 10/26/2017 12:58:36 PM
Y - Gapped down today after pricing a Secondary Offering, abruptly retreating from its all-time high hit on the prior session. Such offerings typically hinder price performance short-term, yet also help attract new or greater institutional interest (I criteria). Its color code is changed to yellow after pulling back below the "max buy" level. Reported earnings +51% on +30% sales revenues for its second quarter ended September 30th versus the year-ago period. See the latest FSU analysis for more details and an annotated graph.
>>> FEATURED STOCK ARTICLE : Recent Gains Lacked Volume; Earnings Report Due Soon - 10/23/2017 |
View all notes |
Set NEW NOTE alert |
Company Profile |
SEC
News |
Chart |
Request a new note
C
A
S
I |
ICHR
-
NASDAQ
Ichor Holdings Ltd
ELECTRONICS - Semiconductor Equipment
|
$31.20
|
-0.85
-2.65% |
$32.44
|
1,098,912
162.08% of 50 DAV
50 DAV is 678,000
|
$35.51
-12.14%
|
10/10/2017
|
$29.39
|
PP = $28.36
|
|
MB = $29.78
|
Most Recent Note - 10/25/2017 12:43:18 PM
G - Pulling back after getting very extended from its prior base. Prior highs in the $29 area define initial support to watch above its 50 DMA line.
>>> FEATURED STOCK ARTICLE : Semiconductor Equipment Firm Finished Strong After Highlighted - 10/10/2017 |
View all notes |
Set NEW NOTE alert |
Company Profile |
SEC
News |
Chart |
Request a new note
C
A
S
I |