You are not logged in.
This means you
CAN ONLY VIEW reports that were published prior to Thursday, March 20, 2025.
You
MUST UPGRADE YOUR MEMBERSHIP if you want to see any current reports.
AFTER MARKET UPDATE - TUESDAY, OCTOBER 24TH, 2017
Previous After Market Report Next After Market Report >>>
|
|
|
|
DOW |
+167.80 |
23,441.76 |
+0.72% |
|
Volume |
776,756,290 |
+3% |
|
Volume |
1,818,992,787 |
+0% |
|
NASDAQ |
+11.60 |
6,598.43 |
+0.18% |
|
Advancers |
1,558 |
54% |
|
Advancers |
1,326 |
49% |
|
S&P 500 |
+4.15 |
2,569.13 |
+0.16% |
|
Decliners |
1,343 |
46% |
|
Decliners |
1,389 |
51% |
|
Russell 2000 |
+2.93 |
1,500.42 |
+0.20% |
|
52 Wk Highs |
203 |
|
|
52 Wk Highs |
126 |
|
|
S&P 600 |
+2.38 |
911.15 |
+0.26% |
|
52 Wk Lows |
54 |
|
|
52 Wk Lows |
49 |
|
|
 |
Breadth Mixed as Major Indices Rose Again
Kenneth J. Gruneisen - Passed the CAN SLIM® Master's Exam
Stocks finished higher on Tuesday. The Dow climbed 167 points to 23441. The S&P 500 gained 4 points to 2569. The Nasdaq Composite added 11 points to 6598. Volume totals reported were higher than the prior session totals on the NYSE and on the Nasdaq exchange. Advancers narrowly led decliners on the NYSE, meanwhile the mix was slightly negative on the Nasdaq exchange. There were 77 high-ranked companies from the Leaders List that made new 52-week highs and were listed on the BreakOuts Page, versus the total of 95 on the prior session. New 52-week highs totals outnumbered new 52-week lows totals on the Nasdaq exchange and on the NYSE. The Featured Stocks Page provides the latest analysis on noteworthy high-ranked leaders. Charts used courtesy of www.stockcharts.com
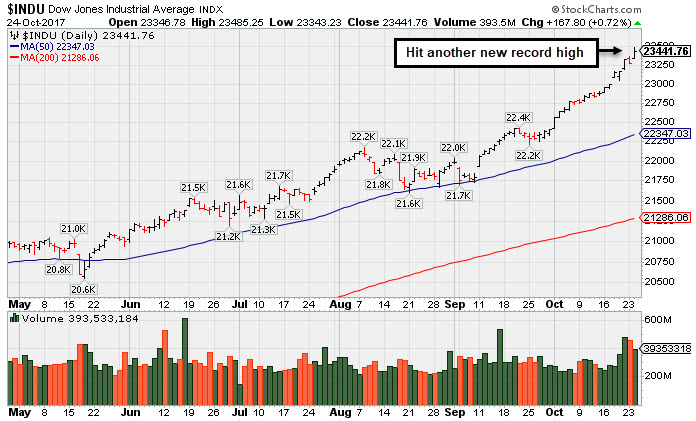 PICTURED: The Dow Jones Industrial Average hit another new record high.
The major averages' (M criteria) are in a confirmed uptrend. Leadership has remained healthy. Investors should buy stocks meeting all key criteria of the fact-based investment system on a case-by-case basis as they trigger technical buy signals.
The major averages rebounded from Monday’s slight decline as investors reacted positively to several strong earnings reports from blue chip companies. On the economic front, a flash reading from Markit revealed its manufacturing PMI index increased in October to a nine month high, while its services PMI index climbed to an eight month high.
Six of 11 S&P 500 sectors were higher as Industrials outperformed and Healthcare lagged. 3M (MMM +5.91%) and Caterpillar (CAT +4.98%) rose after both companies posted results well above consensus estimates. Biogen (BIIB -3.90%) fell on negative analyst commentary surrounding its quarterly reports. Shares of Whirlpool (WHR -10.54%) fell after its top- and bottom-line figures came in below projections. General Motors (GM +2.95%) rose as the automaker reported profits above analyst forecasts for a tenth consecutive quarter. Corning (GLW +6.43%) rose as the company revealed quarterly results well above consensus estimates. After the close; Capital One, Chipotle, AT&T, and Discover Financial were set to report quarterly results.
Treasuries finished lower on the day with the yield on the benchmark 10-year note rising four basis points to 2.41%. In commodities, NYMEX WTI crude increased 1.0% to $52.44/barrel. COMEX gold was down 0.2% to $1278.00. |
 Kenneth J. Gruneisen started out as a licensed stockbroker in August 1987, a couple of months prior to the historic stock market crash that took the Dow Jones Industrial Average down -22.6% in a single day. He has published daily fact-based fundamental and technical analysis on high-ranked stocks online for two decades. Through FACTBASEDINVESTING.COM, Kenneth provides educational articles, news, market commentary, and other information regarding proven investment systems that work in good times and bad.
Comments contained in the body of this report are technical opinions only and are not necessarily those of Gruneisen Growth Corp. The material herein has been obtained from sources believed to be reliable and accurate, however, its accuracy and completeness cannot be guaranteed. Our firm, employees, and customers may effect transactions, including transactions contrary to any recommendation herein, or have positions in the securities mentioned herein or options with respect thereto. Any recommendation contained in this report may not be suitable for all investors and it is not to be deemed an offer or solicitation on our part with respect to the purchase or sale of any securities. |
|
 |
Financial, Retail, Semiconductor, Networking, and Energy Groups Rose
Kenneth J. Gruneisen - Passed the CAN SLIM® Master's Exam
On Tuesday the Bank Index ($BKX +0.81%) and the Broker/Dealer Index ($XBD +0.76%) rose along with the Retail Index ($RLX +0.63%). The tech sector saw modest gains from the Semiconductor Index ($SOX +0.67%) and the Networking Index ($NWX +0.32%), but the Biotechnology Index ($BTK -0.99%) ended lower. The Gold & Silver Index ($XAU -0.79%) fell, meanwhile the Oil Services Index ($OSX +0.54%) and the Integrated Oil Index ($XOI +0.33%) both edged higher. Charts courtesy www.stockcharts.com
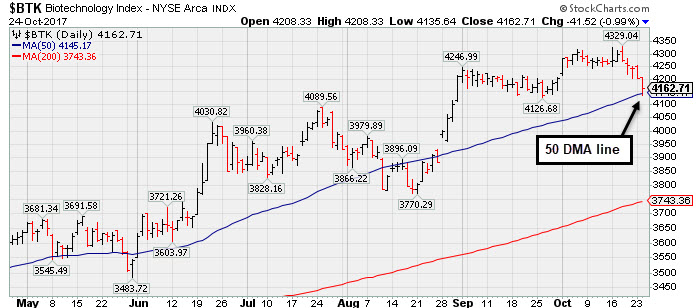 PICTURED: The Biotechnology Index ($BTK -0.99%) has pulled back from its record high with 5 consecutive losses, testing its 50-day moving average (DMA) line.
| Oil Services |
$OSX |
130.26 |
+0.70 |
+0.54% |
-29.13% |
| Integrated Oil |
$XOI |
1,220.69 |
+4.00 |
+0.33% |
-3.73% |
| Semiconductor |
$SOX |
1,245.38 |
+8.24 |
+0.67% |
+37.39% |
| Networking |
$NWX |
468.54 |
+1.48 |
+0.32% |
+5.03% |
| Broker/Dealer |
$XBD |
247.65 |
+1.86 |
+0.76% |
+20.64% |
| Retail |
$RLX |
1,547.03 |
+9.64 |
+0.63% |
+15.19% |
| Gold & Silver |
$XAU |
83.51 |
-0.66 |
-0.78% |
+5.90% |
| Bank |
$BKX |
101.60 |
+0.81 |
+0.80% |
+10.69% |
| Biotech |
$BTK |
4,162.71 |
-41.52 |
-0.99% |
+35.37% |
|
|
|
 |
Perched Near High After Streak of Gains
Kenneth J. Gruneisen - Passed the CAN SLIM® Master's Exam
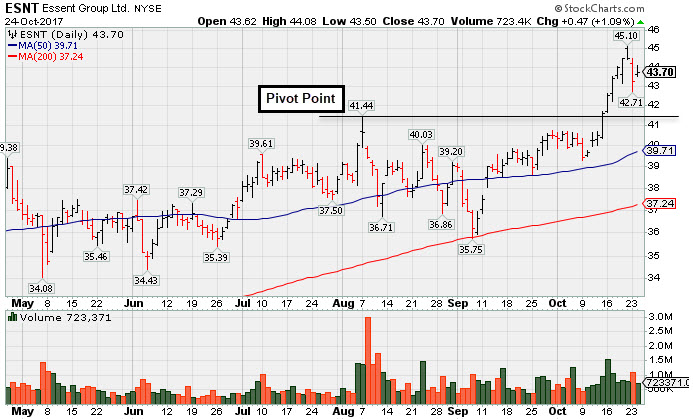
Essent Group Ltd (ESNT +$0.47 or +1.09% to $43.70) is perched near its all-time high following an impressive streak of gains. Prior highs in the $41 area define near term support to watch above its 50-day moving average (DMA) line ($39.71).
It currently has a Timeliness rating of A and a Sponsorship rating of B. ESNT completed a new Public Offering on 8/08/17. During a subsequent consolidation it found support near prior lows ($36.71 on 8/11/17) and near its 200 DMA line, then a prompt rebound above the 50 DMA line helped its outlook improve. It was shown in this FSU section on 9/05/17 with an annotated graph under the headline, "Undercut 50-Day Moving Average in Slump Toward Prior Lows".
The high-ranked Finance-Mrtg and Rel Svc firm's quarterly earnings have been above the +25% minimum guideline (C criteria) and sales revenues increases in comparisons through Jun '17 have been strong. Its annual earnings (A criteria) history has been good since its $17 IPO on 10/31/13.
It completed a new Public Offering on 11/19/14. It was first highlighted in yellow with pivot point cited based on its 12/12/16 high plus 10 cents in the 1/25/17 mid-day report (read here). The number of top-rated funds owning its shares rose from 317 in Mar '16 to 469 in Sep '17, a reassuring sign concerning the I criteria. |
|
|
Color Codes Explained :
Y - Better candidates highlighted by our
staff of experts.
G - Previously featured
in past reports as yellow but may no longer be buyable under the
guidelines.
***Last / Change / Volume data in this table is the closing quote data***
Symbol/Exchange
Company Name
Industry Group |
PRICE |
CHANGE
(%Change) |
Day High |
Volume
(% DAV)
(% 50 day avg vol) |
52 Wk Hi
% From Hi |
Featured
Date |
Price
Featured |
Pivot Featured |
|
Max Buy |
MPX
-
NYSE
Marine Products Corp
AUTOMOTIVE - Recreational Vehicles
|
$15.31
|
+0.08
0.53% |
$15.51
|
19,194
63.98% of 50 DAV
50 DAV is 30,000
|
$17.12
-10.57%
|
9/26/2017
|
$16.30
|
PP = $16.35
|
|
MB = $17.17
|
Most Recent Note - 10/20/2017 5:41:40 PM
G - Still sputtering below its 50 DMA line ($15.41). Only a prompt rebound above the 50 DMA would help its outlook improve. See the latest FSU analysis for more details and a new annotated graph.
>>> FEATURED STOCK ARTICLE : Violation of 50 Day Moving Average Line Hurt Technical Stance - 10/20/2017 |
View all notes |
Set NEW NOTE alert |
Company Profile |
SEC
News |
Chart |
Request a new note
C
A
S
I |
THO
-
NYSE
Thor Industries Inc
AUTOMOTIVE - Recreational Vehicles
|
$131.93
|
+1.41
1.08% |
$132.84
|
545,833
78.42% of 50 DAV
50 DAV is 696,000
|
$133.29
-1.02%
|
8/14/2017
|
$106.67
|
PP = $110.01
|
|
MB = $115.51
|
Most Recent Note - 10/19/2017 3:21:15 PM
G - Volume totals have been cooling in recent weeks, perched at its all-time high after 8 consecutive weekly gains, very extended from the previously noted base. Prior highs in the $115 area define initial support to watch on pullbacks. Fundamentals remain strong.
>>> FEATURED STOCK ARTICLE : Extended From Prior Base With Volume Totals Cooling - 10/13/2017 |
View all notes |
Set NEW NOTE alert |
Company Profile |
SEC
News |
Chart |
Request a new note
C
A
S
I |
PFBC
-
NASDAQ
Preferred Bank Los Angls
BANKING - Regional - Pacific Banks
|
$58.88
|
+0.62
1.06% |
$59.28
|
78,525
119.34% of 50 DAV
50 DAV is 65,800
|
$60.99
-3.46%
|
10/10/2017
|
$59.38
|
PP = $59.08
|
|
MB = $62.03
|
Most Recent Note - 10/23/2017 1:29:42 PM
Y - Its Relative Strength rating has slumped to 78, below the 80+ minimum for buy candidates. Sputtering since highlighted in the 10/10/17 mid-day report. Prior highs in the 58 area define initial support to watch above its 50 DMA line ($55.77)
>>> FEATURED STOCK ARTICLE : Perched Near High Following Volume-Driven Breakout Gains - 10/11/2017 |
View all notes |
Set NEW NOTE alert |
Company Profile |
SEC
News |
Chart |
Request a new note
C
A
S
I |
AVGO
-
NASDAQ
Avago Technologies Ltd
ELECTRONICS - Semiconductor - Broad Line
|
$247.68
|
+3.41
1.40% |
$248.14
|
2,179,548
84.59% of 50 DAV
50 DAV is 2,576,500
|
$259.36
-4.50%
|
8/24/2017
|
$252.44
|
PP = $256.89
|
|
MB = $269.73
|
Most Recent Note - 10/19/2017 12:25:54 PM
G - Still sputtering below its 50 DMA line ($246.24), and its Relative Strength rating has slumped to 76, below the 80+ minimum guideline for buy candidates. A rebound above that short-term average is needed for its outlook to improve. Subsequent losses below the recent low ($231.53 on 9/25/17) would raise serious concerns and trigger a more worrisome technical sell signal.
>>> FEATURED STOCK ARTICLE : Slumped Below 50-Day Moving Average Line Again - 10/17/2017 |
View all notes |
Set NEW NOTE alert |
Company Profile |
SEC
News |
Chart |
Request a new note
C
A
S
I |
YY
-
NASDAQ
YY Inc Ads
INTERNET - Internet Service Providers
|
$94.05
|
-1.66
-1.73% |
$96.45
|
834,959
49.09% of 50 DAV
50 DAV is 1,701,000
|
$97.59
-3.63%
|
9/25/2017
|
$80.26
|
PP = $83.10
|
|
MB = $87.26
|
Most Recent Note - 10/19/2017 5:21:38 PM
G - Extended from its prior base and prior highs in the $83 area defining initial support to watch above its 50 DMA line. See the latest FSU analysis for more details and a new annotated graph.
>>> FEATURED STOCK ARTICLE : Extended After Rallying From Base - 10/19/2017 |
View all notes |
Set NEW NOTE alert |
Company Profile |
SEC
News |
Chart |
Request a new note
C
A
S
I |
Symbol/Exchange
Company Name
Industry Group |
PRICE |
CHANGE
(%Change) |
Day High |
Volume
(% DAV)
(% 50 day avg vol) |
52 Wk Hi
% From Hi |
Featured
Date |
Price
Featured |
Pivot Featured |
|
Max Buy |
STMP
-
NASDAQ
Stamps.com Inc
INTERNET - Internet Software and Services
|
$229.70
|
+5.40
2.41% |
$231.00
|
547,974
172.32% of 50 DAV
50 DAV is 318,000
|
$226.00
1.64%
|
9/11/2017
|
$193.65
|
PP = $220.35
|
|
MB = $231.37
|
 Most Recent Note - 10/24/2017 12:33:57 PM
Y - Hitting yet another new all-time high with today's 3rd consecutive gain. Faces no resistance, however, recent gains have been "wedging" with a lack of volume conviction indicative of great institutional buying demand. Gains above the pivot point must have at least +40% above average volume to trigger a proper new (or add-on) technical buy signal under the fact-based investment system. Its 50 DMA line ($206.86) defines important near-term support above the recent low ($195.05 on 9/28/17) where violations would trigger technical sell signals.
>>> FEATURED STOCK ARTICLE : Perched Near Pivot Point With No Resistance Remaining - 10/4/2017 |
View all notes |
Set NEW NOTE alert |
Company Profile |
SEC
News |
Chart |
Request a new note
C
A
S
I |
HTHT
-
NASDAQ
China Lodging Group Ads
LEISURE - Lodging
|
$140.47
|
-0.55
-0.39% |
$142.15
|
383,454
97.08% of 50 DAV
50 DAV is 395,000
|
$141.85
-0.97%
|
9/29/2016
|
$46.12
|
PP = $47.82
|
|
MB = $50.21
|
Most Recent Note - 10/23/2017 1:14:01 PM
G - Rallying to another new all-time high today, very extended from any sound base. Earnings +19% on +18% sales revenues for the Jun '17 quarter were below the +25% minimum earnings guideline (C criteria). Its 50 DMA line ($118) defines near-term support.
>>> FEATURED STOCK ARTICLE : Holding Ground Stubbornly After Considerable Rally - 10/5/2017 |
View all notes |
Set NEW NOTE alert |
Company Profile |
SEC
News |
Chart |
Request a new note
C
A
S
I |
LMAT
-
NASDAQ
Lemaitre Vascular Inc
Medical-Products
|
$38.37
|
+0.02
0.05% |
$39.58
|
164,874
97.56% of 50 DAV
50 DAV is 169,000
|
$39.88
-3.79%
|
7/28/2017
|
$33.50
|
PP = $33.32
|
|
MB = $34.99
|
Most Recent Note - 10/20/2017 5:43:37 PM
G - Hit a new high with today's volume-driven gain, but it ended in the lower half of its intra-day range. Found support at its 50 DMA line and prior highs in the $36 area. Violations would raise concerns and trigger technical sell signals. Due to report Sep '17 quarterly earnings on 10/26/17 after the close. See the latest FSU analysis for more details and an annotated graph.
>>> FEATURED STOCK ARTICLE : Consolidating Above 50-Day Moving Average Before Earnings - 10/18/2017 |
View all notes |
Set NEW NOTE alert |
Company Profile |
SEC
News |
Chart |
Request a new note
C
A
S
I |
ESNT
-
NYSE
Essent Group Ltd
Finance-MrtgandRel Svc
|
$43.70
|
+0.47
1.09% |
$44.08
|
680,449
95.57% of 50 DAV
50 DAV is 712,000
|
$45.10
-3.10%
|
10/9/2017
|
$39.75
|
PP = $41.54
|
|
MB = $43.62
|
Most Recent Note - 10/24/2017 6:41:09 PM
G - Perched near its all-time high after a steak of gains. Color code is changed to green after getting extended from its previously noted base. Prior highs in the $41 area define near term support to watch above its 50 DMA line. See the latest FSU analysis for more details and a new annotated graph.
>>> FEATURED STOCK ARTICLE : Perched Near High After Streak of Gains - 10/24/2017 |
View all notes |
Set NEW NOTE alert |
Company Profile |
SEC
News |
Chart |
Request a new note
C
A
S
I |
FIVE
-
NASDAQ
Five Below Inc
Retail-DiscountandVariety
|
$56.61
|
-0.39
-0.68% |
$57.62
|
791,441
89.43% of 50 DAV
50 DAV is 885,000
|
$58.07
-2.51%
|
10/6/2017
|
$57.13
|
PP = $54.23
|
|
MB = $56.94
|
Most Recent Note - 10/24/2017 6:43:41 PM
Y - Perched near its "max buy" level after wedging higher with gains lacking great volume conviction. Prior highs in the $54 area define initial support to watch on pullbacks along with its 50 DMA line.
>>> FEATURED STOCK ARTICLE : Finished Strong With Above Average Volume Behind Big Gain - 10/6/2017 |
View all notes |
Set NEW NOTE alert |
Company Profile |
SEC
News |
Chart |
Request a new note
C
A
S
I |
Symbol/Exchange
Company Name
Industry Group |
PRICE |
CHANGE
(%Change) |
Day High |
Volume
(% DAV)
(% 50 day avg vol) |
52 Wk Hi
% From Hi |
Featured
Date |
Price
Featured |
Pivot Featured |
|
Max Buy |
OLED
-
NASDAQ
Universal Display Corp
Elec-Misc Products
|
$135.20
|
+0.35
0.26% |
$136.30
|
359,021
43.57% of 50 DAV
50 DAV is 824,000
|
$145.30
-6.95%
|
8/31/2017
|
$128.22
|
PP = $127.78
|
|
MB = $134.17
|
Most Recent Note - 10/23/2017 7:03:34 PM
G - It has not formed a sound base. Due to report Sep '17 quarterly results after the close on Thursday, November 2nd. Its 50 DMA line ($126) and recent lows define important near-term support to watch on pullbacks.
>>> FEATURED STOCK ARTICLE : Consolidating Near Prior Highs Following Recent Breakout - 9/28/2017 |
View all notes |
Set NEW NOTE alert |
Company Profile |
SEC
News |
Chart |
Request a new note
C
A
S
I |
ANET
-
NYSE
Arista Networks Inc
TELECOMMUNICATIONS - Communication Equipment
|
$193.10
|
+1.53
0.80% |
$193.72
|
341,388
55.78% of 50 DAV
50 DAV is 612,000
|
$196.27
-1.62%
|
8/4/2017
|
$173.31
|
PP = $163.07
|
|
MB = $171.22
|
Most Recent Note - 10/23/2017 6:58:08 PM
G - Quietly perched near its all-time high, extended from any sound base. Its 50 DMA line ($181) defines near-term support to watch on pullbacks. Fundamentals remain very strong.
>>> FEATURED STOCK ARTICLE : Perched Near All-Time High, Extended From Any Sound Base - 10/16/2017 |
View all notes |
Set NEW NOTE alert |
Company Profile |
SEC
News |
Chart |
Request a new note
C
A
S
I |
GRUB
-
NYSE
Grubhub Inc
COMPUTER SOFTWARE and SERVICES - Technical and System Software
|
$51.98
|
+0.54
1.05% |
$52.23
|
2,267,922
146.51% of 50 DAV
50 DAV is 1,548,000
|
$57.61
-9.77%
|
6/21/2017
|
$47.33
|
PP = $46.94
|
|
MB = $49.29
|
Most Recent Note - 10/19/2017 3:19:10 PM
G - Recent lows in the $49-50 area define near-term support above prior highs in the $47 area. A rebound above its now downward sloping 50 DMA line ($53.78) is needed for its outlook to improve. Due to report Sep '17 quarterly results before the open on Wednesday, October 25th. Volume and volatility often increase near earnings news. Earnings rose only +13% on +32% sales revenues for the Jun '17 quarter, below the +25% minimum earnings guideline (C criteria).
>>> FEATURED STOCK ARTICLE : Gain Above 50-Day Moving Average Line Helped Technical Stance - 10/2/2017 |
View all notes |
Set NEW NOTE alert |
Company Profile |
SEC
News |
Chart |
Request a new note
C
A
S
I |
IBP
-
NYSE
Installed Building Prod
DIVERSIFIED SERVICES - Business/Management Services
|
$65.05
|
-0.15
-0.23% |
$66.20
|
113,468
73.68% of 50 DAV
50 DAV is 154,000
|
$67.15
-3.13%
|
9/19/2017
|
$59.15
|
PP = $60.10
|
|
MB = $63.11
|
Most Recent Note - 10/24/2017 6:47:10 PM
G - Extended from its prior base. Prior highs in the $60 area that define initial support coinciding with its 50 DMA line.
>>> FEATURED STOCK ARTICLE : Building - Maintenance & Service Firm Extended From Latest Base - 10/9/2017 |
View all notes |
Set NEW NOTE alert |
Company Profile |
SEC
News |
Chart |
Request a new note
C
A
S
I |
NCOM
-
NASDAQ
National Commerce Corp
BANKING - Regional - Southeast Banks
|
$42.35
|
+0.20
0.47% |
$42.60
|
17,309
44.38% of 50 DAV
50 DAV is 39,000
|
$43.80
-3.31%
|
4/25/2017
|
$38.95
|
PP = $40.09
|
|
MB = $42.09
|
Most Recent Note - 10/17/2017 5:25:23 PM
G - Volume totals have been cooling while stubbornly holding its ground near its 52-week high following an impressive spurt of volume-driven gains. Recently reported Jun '17 earnings +23% on +45% sales revenues, below the +25% minimum earnings guideline (C criteria), raising fundamental concerns.
>>> FEATURED STOCK ARTICLE : Holding Ground Following Impressive Volume-Driven Gains - 10/12/2017 |
View all notes |
Set NEW NOTE alert |
Company Profile |
SEC
News |
Chart |
Request a new note
C
A
S
I |
Symbol/Exchange
Company Name
Industry Group |
PRICE |
CHANGE
(%Change) |
Day High |
Volume
(% DAV)
(% 50 day avg vol) |
52 Wk Hi
% From Hi |
Featured
Date |
Price
Featured |
Pivot Featured |
|
Max Buy |
OLLI
-
NASDAQ
Ollie's Bargain Outlet
Retail-DiscountandVariety
|
$45.35
|
-0.65
-1.41% |
$46.30
|
419,951
79.54% of 50 DAV
50 DAV is 528,000
|
$46.90
-3.30%
|
9/8/2017
|
$45.20
|
PP = $46.18
|
|
MB = $48.49
|
Most Recent Note - 10/24/2017 6:49:14 PM
Y - Volume totals have been cooling while hovering near its all-time high. Its 50 DMA line and recent lows in the $43-44 area define near-term support to watch on pullbacks. Recent gains above the latest pivot point did not meet the minimum +40% above average volume threshold necessary to trigger a proper new (or add-on) technical buy signal. Confirming volume-driven gains would be a reassuring sign of fresh institutional buying demand. Fundamentals remain strong.
>>> FEATURED STOCK ARTICLE : Quietly Hit New Highs Without Great Volume Conviction - 10/3/2017 |
View all notes |
Set NEW NOTE alert |
Company Profile |
SEC
News |
Chart |
Request a new note
C
A
S
I |
HLI
-
NYSE
Houlihan Lokey Inc Cl A
Finance-Invest Bnk/Bkrs
|
$41.92
|
+0.41
0.99% |
$42.12
|
245,326
111.01% of 50 DAV
50 DAV is 221,000
|
$41.78
0.34%
|
9/18/2017
|
$37.04
|
PP = $39.78
|
|
MB = $41.77
|
Most Recent Note - 10/23/2017 6:55:47 PM
Y - Perched at its all-time high. Releases its second quarter results for the 2018 fiscal year on Tuesday, October 24, 2017, after the close of trading. See the latest FSU analysis for more details and a new annotated graph.
>>> FEATURED STOCK ARTICLE : Recent Gains Lacked Volume; Earnings Report Due Soon - 10/23/2017 |
View all notes |
Set NEW NOTE alert |
Company Profile |
SEC
News |
Chart |
Request a new note
C
A
S
I |
ICHR
-
NASDAQ
Ichor Holdings Ltd
ELECTRONICS - Semiconductor Equipment
|
$33.36
|
-0.94
-2.74% |
$35.00
|
1,005,856
152.40% of 50 DAV
50 DAV is 660,000
|
$35.51
-6.05%
|
10/10/2017
|
$29.39
|
PP = $28.36
|
|
MB = $29.78
|
Most Recent Note - 10/19/2017 12:48:39 PM
G - Prior highs in the $29 area define initial support to watch on pullbacks. Very extended from its prior base after a streak of gains.
>>> FEATURED STOCK ARTICLE : Semiconductor Equipment Firm Finished Strong After Highlighted - 10/10/2017 |
View all notes |
Set NEW NOTE alert |
Company Profile |
SEC
News |
Chart |
Request a new note
C
A
S
I |
|
|
|
THESE ARE NOT BUY RECOMMENDATIONS!
Comments contained in the body of this report are technical
opinions only. The material herein has been obtained
from sources believed to be reliable and accurate, however,
its accuracy and completeness cannot be guaranteed.
This site is not an investment advisor, hence it does
not endorse or recommend any securities or other investments.
Any recommendation contained in this report may not
be suitable for all investors and it is not to be deemed
an offer or solicitation on our part with respect to
the purchase or sale of any securities. All trademarks,
service marks and trade names appearing in this report
are the property of their respective owners, and are
likewise used for identification purposes only.
This report is a service available
only to active Paid Premium Members.
You may opt-out of receiving report notifications
at any time. Questions or comments may be submitted
by writing to Premium Membership Services 665 S.E. 10 Street, Suite 201 Deerfield Beach, FL 33441-5634 or by calling 1-800-965-8307
or 954-785-1121.
|
|
|