You are not logged in.
This means you
CAN ONLY VIEW reports that were published prior to Friday, April 18, 2025.
You
MUST UPGRADE YOUR MEMBERSHIP if you want to see any current reports.
AFTER MARKET UPDATE - WEDNESDAY, OCTOBER 25TH, 2017
Previous After Market Report Next After Market Report >>>
|
|
|
|
DOW |
-112.30 |
23,329.46 |
-0.48% |
|
Volume |
910,021,140 |
+17% |
|
Volume |
2,200,868,040 |
+21% |
|
NASDAQ |
-34.54 |
6,563.89 |
-0.52% |
|
Advancers |
762 |
26% |
|
Advancers |
931 |
37% |
|
S&P 500 |
-11.98 |
2,557.15 |
-0.47% |
|
Decliners |
2,207 |
74% |
|
Decliners |
1,577 |
63% |
|
Russell 2000 |
-6.94 |
1,493.48 |
-0.46% |
|
52 Wk Highs |
118 |
|
|
52 Wk Highs |
87 |
|
|
S&P 600 |
-4.33 |
906.82 |
-0.48% |
|
52 Wk Lows |
110 |
|
|
52 Wk Lows |
70 |
|
|
 |
Volume Higher as Major Indices Retreated From Record Highs
Kenneth J. Gruneisen - Passed the CAN SLIM® Master's Exam
Stocks fell from record levels Wednesday. The Dow was down 112 points to 23329. The S&P 500 lost 11 points to 2557. The Nasdaq Composite fell 34 points to 6563. Volume totals reported were higher than the prior session totals on the NYSE and on the Nasdaq exchange. Decliners led advancers by a 3-1 margin on the NYSE and 3-2 on the Nasdaq exchange. There were 72 high-ranked companies from the Leaders List that made new 52-week highs and were listed on the BreakOuts Page, versus the total of 77 on the prior session. New 52-week highs totals contracted yet still outnumbered growing new 52-week lows totals on both the Nasdaq exchange and NYSE. The Featured Stocks Page provides the latest analysis on noteworthy high-ranked leaders. Charts used courtesy of www.stockcharts.com
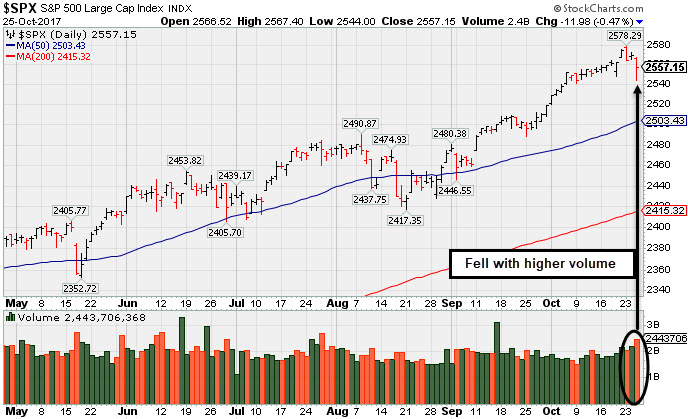 PICTURED: The S&P 500 Index pulled back with higher volume Wednesday while retreating from its record high.
The major averages' (M criteria) are in a confirmed uptrend. Leadership has remained healthy. Investors should buy stocks meeting all key criteria of the fact-based investment system on a case-by-case basis as they trigger technical buy signals.
The major averages suffered their worst single day loss in seven weeks, as investors digested a deluge of mixed earnings reports. On the data front, durable goods orders rose 2.2% in September, compared to an anticipated 1.0% increase. Excluding transportation items, orders were up 0.7% versus a projected 0.5% gain. A separate release revealed new home sales unexpectedly climbed 18.9% in September to the highest levels since 2007.
All 11 S&P 500 sectors were lower. Industrials were a notable underperformer with Boeing (BA -2.85%) falling despite a better-than-expected quarterly profit and raising its guidance. In Telecom, AT&T (T -3.93%) fell as earnings came in slightly below analyst projections. In earnings news, Anthem (ANTM +5.36%) rose after revealing quarterly results above analysts’ estimates. Dr. Pepper Snapple (DPS -4.67%) fell after the beverage maker missed on both top and bottom line projections. Chipotle (CMG -14.58%) tumbled after posting quarterly results below street expectations. In other news, Nike (NKE +2.85%) rose on positive analyst commentary.
Treasuries were lower with the yield on the benchmark 10-year note finishing up three basis points to 2.43%. In commodities, NYMEX WTI crude lost 0.3% to $52.19/barrel. COMEX gold finished up 0.2% to $1278.60/ounce. |
 Kenneth J. Gruneisen started out as a licensed stockbroker in August 1987, a couple of months prior to the historic stock market crash that took the Dow Jones Industrial Average down -22.6% in a single day. He has published daily fact-based fundamental and technical analysis on high-ranked stocks online for two decades. Through FACTBASEDINVESTING.COM, Kenneth provides educational articles, news, market commentary, and other information regarding proven investment systems that work in good times and bad.
Comments contained in the body of this report are technical opinions only and are not necessarily those of Gruneisen Growth Corp. The material herein has been obtained from sources believed to be reliable and accurate, however, its accuracy and completeness cannot be guaranteed. Our firm, employees, and customers may effect transactions, including transactions contrary to any recommendation herein, or have positions in the securities mentioned herein or options with respect thereto. Any recommendation contained in this report may not be suitable for all investors and it is not to be deemed an offer or solicitation on our part with respect to the purchase or sale of any securities. |
|
 |
Financial, Retail, Tech and Commodity-Linked Groups Fell
Kenneth J. Gruneisen - Passed the CAN SLIM® Master's Exam
On Wednesday the Bank Index ($BKX -0.48%) and the Broker/Dealer Index ($XBD -0.60%) fell along with the Retail Index ($RLX -0.44%). The tech sector unanimous losses from the Semiconductor Index ($SOX -1.29%), Networking Index ($NWX -1.34%), and the Biotechnology Index ($BTK -1.08%). The Gold & Silver Index ($XAU -1.07%) fell, and the Oil Services Index ($OSX -0.32%) and the Integrated Oil Index ($XOI -0.71%) both edged lower. Charts courtesy www.stockcharts.com
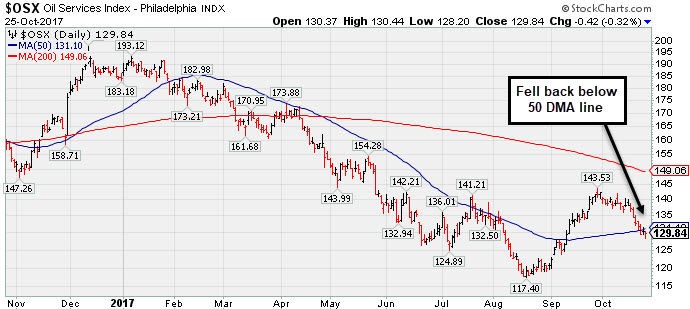 PICTURED: The Oil Services Index ($OSX -0.32%) has slumped back below its 50-day moving average (DMA) line.
| Oil Services |
$OSX |
129.84 |
-0.42 |
-0.32% |
-29.35% |
| Integrated Oil |
$XOI |
1,212.00 |
-8.69 |
-0.71% |
-4.42% |
| Semiconductor |
$SOX |
1,229.27 |
-16.11 |
-1.29% |
+35.61% |
| Networking |
$NWX |
462.25 |
-6.29 |
-1.34% |
+3.62% |
| Broker/Dealer |
$XBD |
246.17 |
-1.48 |
-0.60% |
+19.92% |
| Retail |
$RLX |
1,540.17 |
-6.86 |
-0.44% |
+14.68% |
| Gold & Silver |
$XAU |
82.61 |
-0.90 |
-1.08% |
+4.76% |
| Bank |
$BKX |
101.11 |
-0.49 |
-0.48% |
+10.15% |
| Biotech |
$BTK |
4,117.78 |
-44.93 |
-1.08% |
+33.91% |
|
|
|
 |
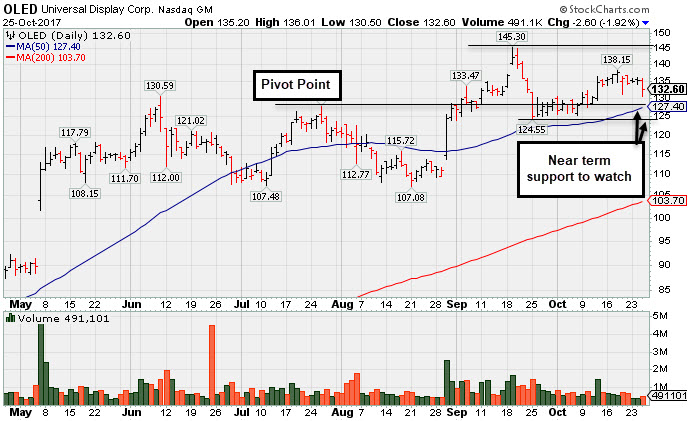
Prior Highs and 50-Day Average Define Near-Term Support
Kenneth J. Gruneisen - Passed the CAN SLIM® Master's Exam
Universal Display Corp (OLED -$2.60 or -1.92% to $132.60) is building on a new base pattern. It is due to report Sep '17 quarterly results after the close on Thursday, November 2nd. Its 50-day moving average (DMA) line ($127.41) and recent lows define important near-term support to watch on pullbacks.
OLED held its ground stubbornly and tallied a solid volume driven gain on 10/12/17 since last shown in this FSU section on 9/28/17 with an annotated graph under the headline, "Consolidating Near Prior Highs Following Recent Breakout". Gains backed by above average volume had triggered a technical buy signal and helped it rally above its "max buy" level, but it abruptly retreated.
It reported +115% earnings on +59% sales revenues for the Jun '17 quarter, its 3rd consecutive strong quarter above the +25% minimum guideline (C criteria), helped it better match with the fact-based investment system's fundamental guidelines. Its annual earnings (A criteria) history has been strong.
The high-ranked Electronic Products firm has earned a current Timeliness rating of A and a Sponsorship rating of B. The number of top-rated funds owning its shares rose from 355 in Sep '16 to 406 in Sep '17. Its current Up/Down Volume Ratio of 1.5 is an unbiased indication its shares have been under accumulation over the past 50 days (I criteria). Its small supply of only 40.9 million shares (S criteria) in the public float can contribute to greater volatility in the event of institutional buying or selling. |
|
|
Color Codes Explained :
Y - Better candidates highlighted by our
staff of experts.
G - Previously featured
in past reports as yellow but may no longer be buyable under the
guidelines.
***Last / Change / Volume data in this table is the closing quote data***
Symbol/Exchange
Company Name
Industry Group |
PRICE |
CHANGE
(%Change) |
Day High |
Volume
(% DAV)
(% 50 day avg vol) |
52 Wk Hi
% From Hi |
Featured
Date |
Price
Featured |
Pivot Featured |
|
Max Buy |
MPX
-
NYSE
Marine Products Corp
AUTOMOTIVE - Recreational Vehicles
|
$14.69
|
-0.62
-4.05% |
$15.50
|
58,005
193.35% of 50 DAV
50 DAV is 30,000
|
$17.12
-14.19%
|
9/26/2017
|
$16.30
|
PP = $16.35
|
|
MB = $17.17
|
 Most Recent Note - 10/25/2017 6:40:30 PM
G - Slumped below its 50 DMA line ($15.44) with a volume-driven loss. Only a prompt rebound above the 50 DMA would help its outlook improve. Reported earnings +18% on +7% sales revenues for the Sep '17 quarter, below the +25% minimum earnings guideline (C criteria), raising fundamental concerns.
>>> FEATURED STOCK ARTICLE : Violation of 50 Day Moving Average Line Hurt Technical Stance - 10/20/2017 |
View all notes |
Set NEW NOTE alert |
Company Profile |
SEC
News |
Chart |
Request a new note
C
A
S
I |
THO
-
NYSE
Thor Industries Inc
AUTOMOTIVE - Recreational Vehicles
|
$131.56
|
-0.37
-0.28% |
$132.07
|
581,625
83.33% of 50 DAV
50 DAV is 698,000
|
$133.29
-1.29%
|
8/14/2017
|
$106.67
|
PP = $110.01
|
|
MB = $115.51
|
Most Recent Note - 10/19/2017 3:21:15 PM
G - Volume totals have been cooling in recent weeks, perched at its all-time high after 8 consecutive weekly gains, very extended from the previously noted base. Prior highs in the $115 area define initial support to watch on pullbacks. Fundamentals remain strong.
>>> FEATURED STOCK ARTICLE : Extended From Prior Base With Volume Totals Cooling - 10/13/2017 |
View all notes |
Set NEW NOTE alert |
Company Profile |
SEC
News |
Chart |
Request a new note
C
A
S
I |
PFBC
-
NASDAQ
Preferred Bank Los Angls
BANKING - Regional - Pacific Banks
|
$64.32
|
+5.44
9.24% |
$65.19
|
353,828
531.27% of 50 DAV
50 DAV is 66,600
|
$60.99
5.46%
|
10/10/2017
|
$59.38
|
PP = $59.08
|
|
MB = $62.03
|
Most Recent Note - 10/25/2017 1:14:27 PM
G - Hitting a new high today, triggering a convincing technical buy signal and quickly rallying above its "max buy" level with a considerable volume-driven gain. Color code is changed to green. Its Relative Strength rating slumped to 76, below the 80+ minimum for buy candidates. Prior highs in the 58 area define initial support to watch above its 50 DMA line ($55.77)
>>> FEATURED STOCK ARTICLE : Perched Near High Following Volume-Driven Breakout Gains - 10/11/2017 |
View all notes |
Set NEW NOTE alert |
Company Profile |
SEC
News |
Chart |
Request a new note
C
A
S
I |
AVGO
-
NASDAQ
Avago Technologies Ltd
ELECTRONICS - Semiconductor - Broad Line
|
$245.82
|
-1.86
-0.75% |
$248.93
|
2,091,534
80.79% of 50 DAV
50 DAV is 2,588,800
|
$259.36
-5.22%
|
8/24/2017
|
$252.44
|
PP = $256.89
|
|
MB = $269.73
|
Most Recent Note - 10/19/2017 12:25:54 PM
G - Still sputtering below its 50 DMA line ($246.24), and its Relative Strength rating has slumped to 76, below the 80+ minimum guideline for buy candidates. A rebound above that short-term average is needed for its outlook to improve. Subsequent losses below the recent low ($231.53 on 9/25/17) would raise serious concerns and trigger a more worrisome technical sell signal.
>>> FEATURED STOCK ARTICLE : Slumped Below 50-Day Moving Average Line Again - 10/17/2017 |
View all notes |
Set NEW NOTE alert |
Company Profile |
SEC
News |
Chart |
Request a new note
C
A
S
I |
YY
-
NASDAQ
YY Inc Ads
INTERNET - Internet Service Providers
|
$89.98
|
-4.07
-4.33% |
$94.91
|
1,467,056
87.17% of 50 DAV
50 DAV is 1,683,000
|
$97.59
-7.80%
|
9/25/2017
|
$80.26
|
PP = $83.10
|
|
MB = $87.26
|
Most Recent Note - 10/25/2017 6:37:19 PM
G - Encountered distributional pressure today with a big loss on higher (near average) volume. Extended from its prior base and prior highs in the $83 area defining support along with its 50 DMA line ($82.13).
>>> FEATURED STOCK ARTICLE : Extended After Rallying From Base - 10/19/2017 |
View all notes |
Set NEW NOTE alert |
Company Profile |
SEC
News |
Chart |
Request a new note
C
A
S
I |
Symbol/Exchange
Company Name
Industry Group |
PRICE |
CHANGE
(%Change) |
Day High |
Volume
(% DAV)
(% 50 day avg vol) |
52 Wk Hi
% From Hi |
Featured
Date |
Price
Featured |
Pivot Featured |
|
Max Buy |
STMP
-
NASDAQ
Stamps.com Inc
INTERNET - Internet Software and Services
|
$229.85
|
+0.15
0.07% |
$231.40
|
284,843
89.01% of 50 DAV
50 DAV is 320,000
|
$231.00
-0.50%
|
9/11/2017
|
$193.65
|
PP = $220.35
|
|
MB = $231.37
|
Most Recent Note - 10/24/2017 12:33:57 PM
Y - Hitting yet another new all-time high with today's 3rd consecutive gain. Faces no resistance, however, recent gains have been "wedging" with a lack of volume conviction indicative of great institutional buying demand. Gains above the pivot point must have at least +40% above average volume to trigger a proper new (or add-on) technical buy signal under the fact-based investment system. Its 50 DMA line ($206.86) defines important near-term support above the recent low ($195.05 on 9/28/17) where violations would trigger technical sell signals.
>>> FEATURED STOCK ARTICLE : Perched Near Pivot Point With No Resistance Remaining - 10/4/2017 |
View all notes |
Set NEW NOTE alert |
Company Profile |
SEC
News |
Chart |
Request a new note
C
A
S
I |
HTHT
-
NASDAQ
China Lodging Group Ads
LEISURE - Lodging
|
$135.59
|
-4.88
-3.47% |
$142.80
|
419,472
106.20% of 50 DAV
50 DAV is 395,000
|
$142.15
-4.61%
|
9/29/2016
|
$46.12
|
PP = $47.82
|
|
MB = $50.21
|
Most Recent Note - 10/23/2017 1:14:01 PM
G - Rallying to another new all-time high today, very extended from any sound base. Earnings +19% on +18% sales revenues for the Jun '17 quarter were below the +25% minimum earnings guideline (C criteria). Its 50 DMA line ($118) defines near-term support.
>>> FEATURED STOCK ARTICLE : Holding Ground Stubbornly After Considerable Rally - 10/5/2017 |
View all notes |
Set NEW NOTE alert |
Company Profile |
SEC
News |
Chart |
Request a new note
C
A
S
I |
LMAT
-
NASDAQ
Lemaitre Vascular Inc
Medical-Products
|
$37.96
|
-0.41
-1.07% |
$38.68
|
135,573
79.75% of 50 DAV
50 DAV is 170,000
|
$39.88
-4.81%
|
7/28/2017
|
$33.50
|
PP = $33.32
|
|
MB = $34.99
|
Most Recent Note - 10/20/2017 5:43:37 PM
G - Hit a new high with today's volume-driven gain, but it ended in the lower half of its intra-day range. Found support at its 50 DMA line and prior highs in the $36 area. Violations would raise concerns and trigger technical sell signals. Due to report Sep '17 quarterly earnings on 10/26/17 after the close. See the latest FSU analysis for more details and an annotated graph.
>>> FEATURED STOCK ARTICLE : Consolidating Above 50-Day Moving Average Before Earnings - 10/18/2017 |
View all notes |
Set NEW NOTE alert |
Company Profile |
SEC
News |
Chart |
Request a new note
C
A
S
I |
ESNT
-
NYSE
Essent Group Ltd
Finance-MrtgandRel Svc
|
$43.42
|
-0.28
-0.64% |
$43.90
|
807,407
113.72% of 50 DAV
50 DAV is 710,000
|
$45.10
-3.73%
|
10/9/2017
|
$39.75
|
PP = $41.54
|
|
MB = $43.62
|
Most Recent Note - 10/24/2017 6:41:09 PM
G - Perched near its all-time high after a steak of gains. Color code is changed to green after getting extended from its previously noted base. Prior highs in the $41 area define near term support to watch above its 50 DMA line. See the latest FSU analysis for more details and a new annotated graph.
>>> FEATURED STOCK ARTICLE : Perched Near High After Streak of Gains - 10/24/2017 |
View all notes |
Set NEW NOTE alert |
Company Profile |
SEC
News |
Chart |
Request a new note
C
A
S
I |
FIVE
-
NASDAQ
Five Below Inc
Retail-DiscountandVariety
|
$55.80
|
-0.81
-1.43% |
$56.81
|
623,256
69.87% of 50 DAV
50 DAV is 892,000
|
$58.07
-3.91%
|
10/6/2017
|
$57.13
|
PP = $54.23
|
|
MB = $56.94
|
Most Recent Note - 10/24/2017 6:43:41 PM
Y - Perched near its "max buy" level after wedging higher with gains lacking great volume conviction. Prior highs in the $54 area define initial support to watch on pullbacks along with its 50 DMA line.
>>> FEATURED STOCK ARTICLE : Finished Strong With Above Average Volume Behind Big Gain - 10/6/2017 |
View all notes |
Set NEW NOTE alert |
Company Profile |
SEC
News |
Chart |
Request a new note
C
A
S
I |
Symbol/Exchange
Company Name
Industry Group |
PRICE |
CHANGE
(%Change) |
Day High |
Volume
(% DAV)
(% 50 day avg vol) |
52 Wk Hi
% From Hi |
Featured
Date |
Price
Featured |
Pivot Featured |
|
Max Buy |
OLED
-
NASDAQ
Universal Display Corp
Elec-Misc Products
|
$132.60
|
-2.60
-1.92% |
$136.01
|
491,100
59.89% of 50 DAV
50 DAV is 820,000
|
$145.30
-8.74%
|
8/31/2017
|
$128.22
|
PP = $127.78
|
|
MB = $134.17
|
Most Recent Note - 10/25/2017 6:23:39 PM
Y - Consolidating below its "max buy" level and building on a new base, its color code is changed to yellow. Due to report Sep '17 quarterly results after the close on Thursday, November 2nd. Its 50 DMA line ($126) and recent lows define important near-term support to watch on pullbacks. See the latest FSU analysis for more details and a new annotated graph.
>>> FEATURED STOCK ARTICLE : Prior Highs and 50-Day Average Define Near-Term Support - 10/25/2017 |
View all notes |
Set NEW NOTE alert |
Company Profile |
SEC
News |
Chart |
Request a new note
C
A
S
I |
ANET
-
NYSE
Arista Networks Inc
TELECOMMUNICATIONS - Communication Equipment
|
$189.61
|
-3.49
-1.81% |
$193.34
|
457,424
75.48% of 50 DAV
50 DAV is 606,000
|
$196.27
-3.39%
|
8/4/2017
|
$173.31
|
PP = $163.07
|
|
MB = $171.22
|
Most Recent Note - 10/23/2017 6:58:08 PM
G - Quietly perched near its all-time high, extended from any sound base. Its 50 DMA line ($181) defines near-term support to watch on pullbacks. Fundamentals remain very strong.
>>> FEATURED STOCK ARTICLE : Perched Near All-Time High, Extended From Any Sound Base - 10/16/2017 |
View all notes |
Set NEW NOTE alert |
Company Profile |
SEC
News |
Chart |
Request a new note
C
A
S
I |
GRUB
-
NYSE
Grubhub Inc
COMPUTER SOFTWARE and SERVICES - Technical and System Software
|
$57.79
|
+5.81
11.18% |
$57.93
|
6,855,710
436.67% of 50 DAV
50 DAV is 1,570,000
|
$57.61
0.31%
|
6/21/2017
|
$47.33
|
PP = $46.94
|
|
MB = $49.29
|
Most Recent Note - 10/25/2017 12:32:50 PM
G - Gapped up today rebounding above its 50 DMA line ($53.68), helping its technical stance improve. Reported Sep '17 quarterly earnings +22% on +32% sales revenues, its 2nd consecutive quarter below the +25% minimum earnings guideline (C criteria), so fundamental concerns remain with regard to the fact-based investment system.
>>> FEATURED STOCK ARTICLE : Gain Above 50-Day Moving Average Line Helped Technical Stance - 10/2/2017 |
View all notes |
Set NEW NOTE alert |
Company Profile |
SEC
News |
Chart |
Request a new note
C
A
S
I |
IBP
-
NYSE
Installed Building Prod
DIVERSIFIED SERVICES - Business/Management Services
|
$64.60
|
-0.45
-0.69% |
$65.30
|
176,476
113.86% of 50 DAV
50 DAV is 155,000
|
$67.15
-3.80%
|
9/19/2017
|
$59.15
|
PP = $60.10
|
|
MB = $63.11
|
Most Recent Note - 10/24/2017 6:47:10 PM
G - Extended from its prior base. Prior highs in the $60 area that define initial support coinciding with its 50 DMA line.
>>> FEATURED STOCK ARTICLE : Building - Maintenance & Service Firm Extended From Latest Base - 10/9/2017 |
View all notes |
Set NEW NOTE alert |
Company Profile |
SEC
News |
Chart |
Request a new note
C
A
S
I |
NCOM
-
NASDAQ
National Commerce Corp
BANKING - Regional - Southeast Banks
|
$42.35
|
+0.00
0.00% |
$42.35
|
32,014
82.09% of 50 DAV
50 DAV is 39,000
|
$43.80
-3.31%
|
4/25/2017
|
$38.95
|
PP = $40.09
|
|
MB = $42.09
|
Most Recent Note - 10/25/2017 5:23:28 PM
G - Gapped down today and undercut its 50 DMA line then found prompt support and managed a "positive reversal". Prior highs and its 50 DMA line define support in the $41 area. Recently reported Jun '17 earnings +23% on +45% sales revenues, below the +25% minimum earnings guideline (C criteria), raising fundamental concerns.
>>> FEATURED STOCK ARTICLE : Holding Ground Following Impressive Volume-Driven Gains - 10/12/2017 |
View all notes |
Set NEW NOTE alert |
Company Profile |
SEC
News |
Chart |
Request a new note
C
A
S
I |
Symbol/Exchange
Company Name
Industry Group |
PRICE |
CHANGE
(%Change) |
Day High |
Volume
(% DAV)
(% 50 day avg vol) |
52 Wk Hi
% From Hi |
Featured
Date |
Price
Featured |
Pivot Featured |
|
Max Buy |
OLLI
-
NASDAQ
Ollie's Bargain Outlet
Retail-DiscountandVariety
|
$45.00
|
-0.35
-0.77% |
$45.85
|
508,601
96.33% of 50 DAV
50 DAV is 528,000
|
$46.90
-4.05%
|
9/8/2017
|
$45.20
|
PP = $46.18
|
|
MB = $48.49
|
Most Recent Note - 10/24/2017 6:49:14 PM
Y - Volume totals have been cooling while hovering near its all-time high. Its 50 DMA line and recent lows in the $43-44 area define near-term support to watch on pullbacks. Recent gains above the latest pivot point did not meet the minimum +40% above average volume threshold necessary to trigger a proper new (or add-on) technical buy signal. Confirming volume-driven gains would be a reassuring sign of fresh institutional buying demand. Fundamentals remain strong.
>>> FEATURED STOCK ARTICLE : Quietly Hit New Highs Without Great Volume Conviction - 10/3/2017 |
View all notes |
Set NEW NOTE alert |
Company Profile |
SEC
News |
Chart |
Request a new note
C
A
S
I |
HLI
-
NYSE
Houlihan Lokey Inc Cl A
Finance-Invest Bnk/Bkrs
|
$43.37
|
+1.45
3.46% |
$44.15
|
579,191
263.27% of 50 DAV
50 DAV is 220,000
|
$42.12
2.97%
|
9/18/2017
|
$37.04
|
PP = $39.78
|
|
MB = $41.77
|
Most Recent Note - 10/25/2017 12:39:38 PM
G - Gapped up today hitting a new all-time high with a big volume-driven gain, rallying above its "max buy" level and its color code is changed to green. Reported earnings +51% on +30% sales revenues for its second quarter ended September 30th versus the year-ago period. See the latest FSU analysis for more details and an annotated graph.
>>> FEATURED STOCK ARTICLE : Recent Gains Lacked Volume; Earnings Report Due Soon - 10/23/2017 |
View all notes |
Set NEW NOTE alert |
Company Profile |
SEC
News |
Chart |
Request a new note
C
A
S
I |
ICHR
-
NASDAQ
Ichor Holdings Ltd
ELECTRONICS - Semiconductor Equipment
|
$32.05
|
-1.31
-3.93% |
$33.44
|
1,572,638
237.92% of 50 DAV
50 DAV is 661,000
|
$35.51
-9.74%
|
10/10/2017
|
$29.39
|
PP = $28.36
|
|
MB = $29.78
|
Most Recent Note - 10/25/2017 12:43:18 PM
G - Pulling back after getting very extended from its prior base. Prior highs in the $29 area define initial support to watch above its 50 DMA line.
>>> FEATURED STOCK ARTICLE : Semiconductor Equipment Firm Finished Strong After Highlighted - 10/10/2017 |
View all notes |
Set NEW NOTE alert |
Company Profile |
SEC
News |
Chart |
Request a new note
C
A
S
I |
|
|
|
THESE ARE NOT BUY RECOMMENDATIONS!
Comments contained in the body of this report are technical
opinions only. The material herein has been obtained
from sources believed to be reliable and accurate, however,
its accuracy and completeness cannot be guaranteed.
This site is not an investment advisor, hence it does
not endorse or recommend any securities or other investments.
Any recommendation contained in this report may not
be suitable for all investors and it is not to be deemed
an offer or solicitation on our part with respect to
the purchase or sale of any securities. All trademarks,
service marks and trade names appearing in this report
are the property of their respective owners, and are
likewise used for identification purposes only.
This report is a service available
only to active Paid Premium Members.
You may opt-out of receiving report notifications
at any time. Questions or comments may be submitted
by writing to Premium Membership Services 665 S.E. 10 Street, Suite 201 Deerfield Beach, FL 33441-5634 or by calling 1-800-965-8307
or 954-785-1121.
|
|
|