Symbol/Exchange
Company Name
Industry Group |
PRICE |
CHANGE
(%Change) |
Day High |
Volume
(% DAV)
(% 50 day avg vol) |
52 Wk Hi
% From Hi |
Featured
Date |
Price
Featured |
Pivot Featured |
|
Max Buy |
 SIVB
-
NASDAQ
SIVB
-
NASDAQ
S V B Financial Group
BANKING - Regional - Pacific Banks
|
$556.32
|
-6.62
-1.18% |
$568.38
|
206,825
48.78% of 50 DAV
50 DAV is 424,000
|
$608.84
-8.63%
|
8/6/2021
|
$589.70
|
PP = $608.94
|
|
MB = $639.39
|
Most Recent Note - 8/17/2021 3:31:29 PM
Y - Completed a new Public Offering on 8/11/21. Slumping below its 50 DMA line ($565) with today's 4th consecutive loss. Prior low in the $538 area defines the next important near-term support to watch. New pivot point recently cited was based on its 6/08/21 high plus 10 cents. Subsequent gains above the pivot point backed by at least +40% above average volume may trigger a new technical buy signal. Reported Jun '21 quarterly earnings +106% on +69% sales revenues versus the year ago period, continuing its strong earnings track record.
>>> FEATURED STOCK ARTICLE : Consolidating Near Prior Highs Facing Little Resistance - 8/9/2021 |
View all notes |
Set NEW NOTE alert |
Company Profile |
SEC
News |
Chart |
Request a new note
C
A
S
I |
BLDR
-
NYSE
Builders Firstsource Inc
Bldg-Constr Prds/Misc
|
$49.22
|
-0.48
-0.97% |
$50.15
|
2,132,542
62.74% of 50 DAV
50 DAV is 3,399,000
|
$53.99
-8.83%
|
8/12/2021
|
$52.38
|
PP = $54.09
|
|
MB = $56.79
|
Most Recent Note - 8/17/2021 3:28:16 PM
Y - Pulling back for a 3rd consecutive loss today with below average volume. Highlighted in yellow with pivot point cited based on its 5/10/21 high plus 10 cents in the 8/12/21 mid-day report. Subsequent gains above the pivot point backed by at least +40% above average volume may trigger a technical buy signal. Found support near its 200 DMA line. Reported very strong Dec '20, Mar and Jun '21 quarterly results versus the year ago periods. Sequential quarterly comparisons show impressive acceleration in its sales revenues growth rate as earnings also improved. Annual earning growth has been strong and steady A criteria).
>>> FEATURED STOCK ARTICLE : Rebounding Near Prior High After Another Strong Quarter - 8/12/2021 |
View all notes |
Set NEW NOTE alert |
Company Profile |
SEC
News |
Chart |
Request a new note
C
A
S
I |
SNPS
-
NASDAQ
Synopsys Inc
COMPUTER SOFTWARE and SERVICES - Technical and System Software
|
$290.63
|
-0.99
-0.34% |
$294.50
|
829,391
123.24% of 50 DAV
50 DAV is 673,000
|
$300.91
-3.42%
|
8/18/2021
|
$293.22
|
PP = $301.01
|
|
MB = $316.06
|
 Most Recent Note - 8/18/2021 5:20:15 PM
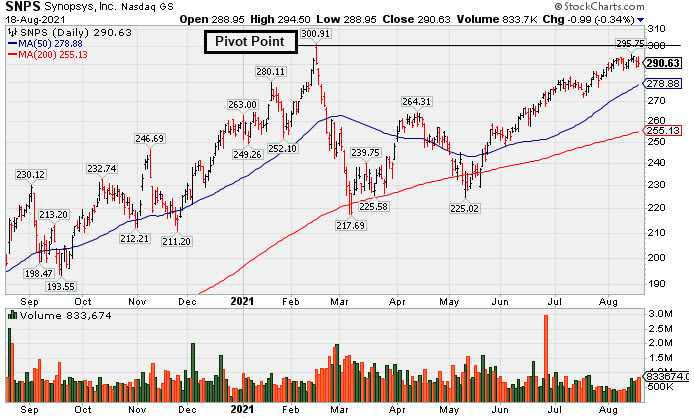
Y - Color code was changed to yellow with pivot point cited based on its 2/16/21 high plus 10 cents in the earlier mid-day report. Challenged its all-time high with recent gains. Reported sub par Jul '21 quarterly results after the close. Volume and volatility often increase near earnings news. Subsequent gains above the pivot point backed by at least +40% above average volume may trigger a technical buy signal. Earnings rose +39% on +19% sales revenues for the Apr '21 quarter versus the year ago period, its 4th strong quarterly comparison above the +25% minimum guideline (C criteria). Annual earnings (A criteria) growth has been strong and steady. See the latest FSU for more detailed analysis and a new annotated graph.
>>> FEATURED STOCK ARTICLE : Latest Earnings Report Missed the +25% Minimum Guideline - 8/18/2021 |
View all notes |
Set NEW NOTE alert |
Company Profile |
SEC
News |
Chart |
Request a new note
C
A
S
I |
CROX
-
NASDAQ
Crocs Inc
CONSUMER NON-DURABLES - Textile - Apparel Footwear
|
$140.20
|
+1.45
1.05% |
$143.04
|
927,552
80.38% of 50 DAV
50 DAV is 1,154,000
|
$147.31
-4.83%
|
6/14/2021
|
$112.64
|
PP = $110.01
|
|
MB = $115.51
|
Most Recent Note - 8/17/2021 3:26:42 PM
G - Pulling back from its all-time high, extended from any sound base. Near-term support to watch is at its 50 DMA line ($122). See the latest FSU analysis for more details and an annotated graph.
>>> FEATURED STOCK ARTICLE : Wedging Higher and Very Extended From Any Sound Base - 8/16/2021 |
View all notes |
Set NEW NOTE alert |
Company Profile |
SEC
News |
Chart |
Request a new note
C
A
S
I |
CRL
-
NYSE
Charles River Labs Intl
DRUGS - Biotechnology
|
$416.08
|
-1.37
-0.33% |
$423.63
|
182,234
59.75% of 50 DAV
50 DAV is 305,000
|
$420.25
-0.99%
|
6/9/2021
|
$345.91
|
PP = $349.23
|
|
MB = $366.69
|
Most Recent Note - 8/13/2021 5:25:59 PM
G - Extended from any sound base and stubbornly holding its ground perched near its all-time high. Recent volume totals have been lackluster while wedging into record high territory. Its 50 DMA line ($380) defines near-term support to watch on pullbacks. Two of the past 3 quarterly comparisons through Mar '21 have been above the +25% minimum earnings guideline (C criteria).
>>> FEATURED STOCK ARTICLE : Volume Totals Cooling While Perched at High - 7/13/2021 |
View all notes |
Set NEW NOTE alert |
Company Profile |
SEC
News |
Chart |
Request a new note
C
A
S
I |
Symbol/Exchange
Company Name
Industry Group |
PRICE |
CHANGE
(%Change) |
Day High |
Volume
(% DAV)
(% 50 day avg vol) |
52 Wk Hi
% From Hi |
Featured
Date |
Price
Featured |
Pivot Featured |
|
Max Buy |
GNRC
-
NYSE
Generac Hldgs Inc
Electrical-Power/Equipmt
|
$390.05
|
+0.06
0.02% |
$397.59
|
519,597
62.60% of 50 DAV
50 DAV is 830,000
|
$457.00
-14.65%
|
6/8/2021
|
$348.46
|
PP = $342.38
|
|
MB = $359.50
|
Most Recent Note - 8/17/2021 12:41:28 PM
G - Raising concerns with today's loss violating its 50 DMA line ($409.62). Only a prompt rebound above the 50 DMA line would help its outlook improve. Reported Jun '21 quarterly earnings +71% on +68% sales revenues versus the year ago period. Fundamentals remain strong.
>>> FEATURED STOCK ARTICLE : Gain for New High Leaves GNRC Very Extended From Prior Base - 7/12/2021 |
View all notes |
Set NEW NOTE alert |
Company Profile |
SEC
News |
Chart |
Request a new note
C
A
S
I |
CAMT
-
NASDAQ
Camtek Ltd
ELECTRONICS - Scientific and Technical Instrum
|
$35.65
|
+0.19
0.54% |
$36.29
|
66,517
32.93% of 50 DAV
50 DAV is 202,000
|
$40.47
-11.91%
|
8/4/2021
|
$39.67
|
PP = $40.57
|
|
MB = $42.60
|
Most Recent Note - 8/17/2021 5:17:50 PM
G - Raised concerns as it violated its 50 DMA line ($36.52) during a streak of 3 consecutive losses. Only a prompt rebound above the 50 DMA line would help its outlook improve. Prior low ($32 30) defines the next important near-term support to watch. Reported Jun '21 quarterly earnings +138% on +82% sales revenues versus the year-ago period, continuing its strong earnings track record. See the latest FSU analysis for more details and a new annotated graph.
>>> FEATURED STOCK ARTICLE : Recent 50-Day Moving Average Violation Again Raised Concerns - 8/17/2021 |
View all notes |
Set NEW NOTE alert |
Company Profile |
SEC
News |
Chart |
Request a new note
C
A
S
I |
PKI
-
NYSE
Perkinelmer Inc
ELECTRONICS - Scientific and Technical Instrum
|
$181.07
|
-1.78
-0.97% |
$184.77
|
571,817
76.24% of 50 DAV
50 DAV is 750,000
|
$188.40
-3.89%
|
8/18/2021
|
$181.07
|
PP = $188.50
|
|
MB = $197.93
|
Most Recent Note - 8/18/2021 5:28:09 PM
Y - Stubbornly holding its ground after forming a "3-weeks tight" base. Color code is changed to yellow with new pivot point cited based on its 8/05/21 high plus 10 cents. Its 50 DMA line ($163).and prior high ($162) define important near-term support to watch. Reported earnings +80% on +51% sales revenues for the Jun '21 quarter versus the year ago period.
>>> FEATURED STOCK ARTICLE : Powerful Volume-Driven Breakout After Earnings Report - 7/26/2021 |
View all notes |
Set NEW NOTE alert |
Company Profile |
SEC
News |
Chart |
Request a new note
C
A
S
I |
TRMB
-
NASDAQ
Trimble Inc
ELECTRONICS - Scientific and Technical Instrum
|
$88.79
|
+0.19
0.21% |
$89.95
|
1,277,180
136.01% of 50 DAV
50 DAV is 939,000
|
$90.25
-1.62%
|
8/5/2021
|
$88.83
|
PP = $84.97
|
|
MB = $89.22
|
Most Recent Note - 8/12/2021 5:04:47 PM
Y - Stubbornly holding its ground near its all-time high since highlighted in yellow with pivot point cited based on its 4/06/21 high plus 10 cents in the 8/05/21 mid-day report. The big gain above the pivot point was backed by +72% above average volume to clinch a proper technical buy signal. Found support at its 50 DMA line ($82.24). Reported earnings +38% on +29% sales revenues for the Jun '21 quarter versus the year ago period. Three of the past 4 quarterly comparisons were above the +25% minimum earnings guideline (C criteria). Annual earnings (A criteria) growth has been strong and steady.
>>> FEATURED STOCK ARTICLE : Finished Strong With Gain for New High Backed by Volume - 8/5/2021 |
View all notes |
Set NEW NOTE alert |
Company Profile |
SEC
News |
Chart |
Request a new note
C
A
S
I |
UMC
-
NYSE
United Microelectrnc Adr
ELECTRONICS - Semiconductor - Integrated Cir
|
$10.23
|
+0.19
1.89% |
$10.53
|
8,336,039
131.05% of 50 DAV
50 DAV is 6,361,000
|
$11.71
-12.64%
|
8/5/2021
|
$11.62
|
PP = $11.38
|
|
MB = $11.95
|
Most Recent Note - 8/18/2021 12:49:40 PM
Y - Gapped up today. Pulled back below its pivot point with volume-driven losses this week indicative of distributional pressure. Stalled since reaching a new 52-week high. Recent highs and its 50 DMA line ($9.81) define near term support to watch.
>>> FEATURED STOCK ARTICLE : Taiwan-Based Semiconductor Firm's Breakout Highlighted This Week - 8/6/2021 |
View all notes |
Set NEW NOTE alert |
Company Profile |
SEC
News |
Chart |
Request a new note
C
A
S
I |
Symbol/Exchange
Company Name
Industry Group |
PRICE |
CHANGE
(%Change) |
Day High |
Volume
(% DAV)
(% 50 day avg vol) |
52 Wk Hi
% From Hi |
Featured
Date |
Price
Featured |
Pivot Featured |
|
Max Buy |
ASML
-
NASDAQ
A S M L Holding N.V. NY
ELECTRONICS - Semiconductor Equipment and Mate
|
$772.45
|
-4.11
-0.53% |
$785.38
|
449,889
67.96% of 50 DAV
50 DAV is 662,000
|
$805.64
-4.12%
|
5/25/2021
|
$669.59
|
PP = $675.75
|
|
MB = $709.54
|
Most Recent Note - 8/12/2021 12:40:09 PM
G - Extended from any sound base and hovering near its all-time high, stubbornly holding its ground with volume totals cooling. Its 50 DMA line ($717) defines important near-term support to watch on pullbacks. See the latest FSU analysis for more details and an annotated graph.
>>> FEATURED STOCK ARTICLE : Semi Equipment Firm Extended From Any Sound Base - 8/11/2021 |
View all notes |
Set NEW NOTE alert |
Company Profile |
SEC
News |
Chart |
Request a new note
C
A
S
I |
ENTG
-
NASDAQ
Entegris Inc
ELECTRONICS - Semiconductor Equipment and Mate
|
$111.63
|
-1.22
-1.08% |
$114.47
|
379,316
54.97% of 50 DAV
50 DAV is 690,000
|
$126.41
-11.69%
|
8/4/2021
|
$125.33
|
PP = $126.51
|
|
MB = $132.84
|
Most Recent Note - 8/13/2021 12:20:42 PM
G - Slumped below its 50 DMA line ($118.32) with heavier volume behind damaging losses this week raising greater concerns. A rebound above the 50 DMA line is needed for its outlook to improve. Subsequent gains and a close above the pivot point backed by at least +40% above average volume may trigger a proper technical buy signal. Fundamentals remain strong as it reported Jun '21 quarterly earnings +42% on +27% sales revenues. Its Relative Strength Rating has slumped to 78, below the 80+ minimum guideline for buy candidates.
>>> FEATURED STOCK ARTICLE : Perched Near High After 6th Consecutive Gain - 8/4/2021 |
View all notes |
Set NEW NOTE alert |
Company Profile |
SEC
News |
Chart |
Request a new note
C
A
S
I |
LUNA
-
NASDAQ
Luna Innovations Inc
Medical-Research Eqp/Svc
|
$10.59
|
-0.22
-2.04% |
$10.85
|
79,876
49.00% of 50 DAV
50 DAV is 163,000
|
$13.05
-18.85%
|
7/26/2021
|
$12.46
|
PP = $13.15
|
|
MB = $13.81
|
Most Recent Note - 8/13/2021 12:26:09 PM
G - Holding its ground since a gap down on 8/10/21. Its color code was changed to green as weakness came after reporting Jun '21 quarterly earnings +0% on +50% sales revenues versus the year ago period, below the +25% minimum earnings guideline (C criteria), raising fundamental concerns. Disciplined investors note that since featured on 7/26/21 it did not trigger a proper technical buy signal.
>>> FEATURED STOCK ARTICLE : Pulled Back After Streak of Gains Challenging 52-Week High - 7/27/2021 |
View all notes |
Set NEW NOTE alert |
Company Profile |
SEC
News |
Chart |
Request a new note
C
A
S
I |
CLFD
-
NASDAQ
Clearfield Inc
TELECOMMUNICATIONS - Cables / Satalite Equipment
|
$41.50
|
+0.86
2.12% |
$41.79
|
74,053
62.76% of 50 DAV
50 DAV is 118,000
|
$45.36
-8.51%
|
7/23/2021
|
$40.23
|
PP = $43.74
|
|
MB = $45.93
|
Most Recent Note - 8/18/2021 5:21:02 PM
Y - Still holding its ground stubbornly near its high with volume totals cooling after recent volume-driven gains. Fundamentals remain strong. Bullish action came after it reported Jun '21 quarterly earnings +100% on +49% sales revenues.
>>> FEATURED STOCK ARTICLE : Big Volume-Driven Gain Challenging Prior High After Earnings - 7/23/2021 |
View all notes |
Set NEW NOTE alert |
Company Profile |
SEC
News |
Chart |
Request a new note
C
A
S
I |
POOL
-
NASDAQ
Pool Corp
WHOLESALE - Basic Materials Wholesale
|
$476.64
|
-3.35
-0.70% |
$485.43
|
177,796
71.69% of 50 DAV
50 DAV is 248,000
|
$495.22
-3.75%
|
6/21/2021
|
$455.09
|
PP = $449.54
|
|
MB = $472.02
|
Most Recent Note - 8/13/2021 5:15:39 PM
G - Volume totals have been cooling in recent weeks while stubbornly holding its ground perched at its all-time high, extended from any sound base. Its 50 DMA line ($461) defines important near-term support to watch on pullbacks.
>>> FEATURED STOCK ARTICLE : Churned Heavy Volume While Testing 50-Day Moving Average - 7/22/2021 |
View all notes |
Set NEW NOTE alert |
Company Profile |
SEC
News |
Chart |
Request a new note
C
A
S
I |
Symbol/Exchange
Company Name
Industry Group |
PRICE |
CHANGE
(%Change) |
Day High |
Volume
(% DAV)
(% 50 day avg vol) |
52 Wk Hi
% From Hi |
Featured
Date |
Price
Featured |
Pivot Featured |
|
Max Buy |
FSBW
-
NASDAQ
F S Bancorp
Banks-West/Southwest
|
$33.91
|
-0.20
-0.59% |
$34.13
|
18,732
63.07% of 50 DAV
50 DAV is 29,700
|
$36.85
-7.98%
|
5/18/2021
|
$35.08
|
PP = $36.85
|
|
MB = $38.69
|
Most Recent Note - 8/18/2021 5:22:56 PM
It will be dropped from the Featured Stocks list tonight. Slumped below its 50 DMA line with 4 consecutive losses backed by light volume. Recently reported Jun '21 quarterly earnings -16% on -11% sales revenues versus the year ago period raising fundamental concerns. Do not be confused by a 2:1 stock split which impacted share prices as of 7/15/21 (Featured Price, Pivot Point, and Max Buy levels were updated accordingly).
>>> FEATURED STOCK ARTICLE : Latest Earnings Report Broke Streak of Strong Increases - 7/29/2021 |
View all notes |
Set NEW NOTE alert |
Company Profile |
SEC
News |
Chart |
Request a new note
C
A
S
I |
SMPL
-
NASDAQ
Simply Good Foods Co
Food-Confectionery
|
$34.55
|
-0.77
-2.18% |
$35.73
|
256,652
55.55% of 50 DAV
50 DAV is 462,000
|
$38.50
-10.26%
|
12/28/2020
|
$30.40
|
PP = $31.44
|
|
MB = $33.01
|
Most Recent Note - 8/17/2021 3:39:00 PM
G - Losses on light volume have it slumping below its 50 DMA line ($36.43) and testing near prior highs in the $35 area. More damaging losses would raise greater concerns. Reported May '21 quarterly earnings +65% on +32% sales revenues versus the year ago period, well above the +25% minimum earnings guideline (C criteria).
>>> FEATURED STOCK ARTICLE : Pulled Back from High With Small Losses on Light Volume - 7/15/2021 |
View all notes |
Set NEW NOTE alert |
Company Profile |
SEC
News |
Chart |
Request a new note
C
A
S
I |
PYPL
-
NASDAQ
"PayPal Holdings, Inc"
Finance-CrdtCard/PmtPr
|
$268.84
|
-2.26
-0.83% |
$272.77
|
4,767,014
75.51% of 50 DAV
50 DAV is 6,312,800
|
$310.16
-13.32%
|
7/27/2021
|
$296.69
|
PP = $307.82
|
|
MB = $323.21
|
Most Recent Note - 8/13/2021 5:16:41 PM
G - Slumped below its 50 DMA line ($285.62) with damaging volume-driven losses recently raising concerns, technically. Weak action came after it reported Jun '21 quarterly earnings +7% on +19% sales revenues versus the year ago period, below the +25% minimum earnings guideline (C criteria), raising fundamental concerns.
>>> FEATURED STOCK ARTICLE : Paypal Perched at Record High - 7/28/2021 |
View all notes |
Set NEW NOTE alert |
Company Profile |
SEC
News |
Chart |
Request a new note
C
A
S
I |
SQ
-
NYSE
Square Inc Cl A
Finance-CrdtCard/PmtPr
|
$259.66
|
-1.22
-0.47% |
$266.67
|
4,610,422
53.96% of 50 DAV
50 DAV is 8,544,000
|
$289.23
-10.22%
|
8/2/2021
|
$273.78
|
PP = $283.29
|
|
MB = $297.45
|
Most Recent Note - 8/13/2021 5:22:47 PM
Y - Volume totals have been cooling while consolidating after reaching a new all-time high last week. Bullish action came after reporting Jun '21 quarterly earnings +267% on +143% sales revenues versus the year ago period, its 4th strong comparison well above the +25% minimum guideline (C criteria).
>>> FEATURED STOCK ARTICLE : Pullback Following Big Gain on Strong Earnings and M&A News - 8/3/2021 |
View all notes |
Set NEW NOTE alert |
Company Profile |
SEC
News |
Chart |
Request a new note
C
A
S
I |
SHOP
-
NYSE
Shopify Inc Cl A
Computer Sftwr-Enterprse
|
$1,489.18
|
+7.31
0.49% |
$1,514.00
|
817,294
58.42% of 50 DAV
50 DAV is 1,399,000
|
$1,650.00
-9.75%
|
7/2/2021
|
$1,468.00
|
PP = $1,552.23
|
|
MB = $1,629.84
|
Most Recent Note - 8/13/2021 5:20:37 PM
Y - Quietly consolidating above its 50 DMA line ($1,464) and testing February 2021 highs which help define important near-term support to watch. More damaging losses would raise concerns and trigger technical sell signals. Fundamentals remain strong.
>>> FEATURED STOCK ARTICLE : Managed a Positive Reversal After Early Weakness - 7/19/2021 |
View all notes |
Set NEW NOTE alert |
Company Profile |
SEC
News |
Chart |
Request a new note
C
A
S
I |
Symbol/Exchange
Company Name
Industry Group |
PRICE |
CHANGE
(%Change) |
Day High |
Volume
(% DAV)
(% 50 day avg vol) |
52 Wk Hi
% From Hi |
Featured
Date |
Price
Featured |
Pivot Featured |
|
Max Buy |
YETI
-
NYSE
Yeti Holdings Inc
Leisure-Products
|
$96.64
|
-1.10
-1.13% |
$99.00
|
559,927
51.42% of 50 DAV
50 DAV is 1,089,000
|
$105.62
-8.50%
|
5/13/2021
|
$84.20
|
PP = $90.65
|
|
MB = $95.18
|
Most Recent Note - 8/17/2021 3:34:36 PM
G - Pulling back toward Its 50 DMA line ($94) which defines near-term support to watch. There was a noted "negative reversal" after hitting a new all-time high on 8/06/21. Reported Jun '21 quarterly earnings +66% on +45% sales revenues versus the year ago period, continuing its strong earnings track record.
>>> FEATURED STOCK ARTICLE : Volume Totals Cooling While Consolidating Near High - 7/9/2021 |
View all notes |
Set NEW NOTE alert |
Company Profile |
SEC
News |
Chart |
Request a new note
C
A
S
I |
DOCU
-
NASDAQ
Docusign Inc
Computer Sftwr-Enterprse
|
$284.81
|
-0.77
-0.27% |
$288.61
|
939,027
41.01% of 50 DAV
50 DAV is 2,290,000
|
$314.76
-9.52%
|
7/6/2021
|
$288.96
|
PP = $290.33
|
|
MB = $304.85
|
Most Recent Note - 8/16/2021 6:28:56 PM
Y - Slumped to test its 50 DMA line ($283) with light volume behind today's big loss. A violation would raise greater concerns and trigger a technical sell signal. See the latest FSU analysis for more details and an annotated graph.
>>> FEATURED STOCK ARTICLE : Reversed From High After Recently Wedging Higher Without Volume - 8/13/2021 |
View all notes |
Set NEW NOTE alert |
Company Profile |
SEC
News |
Chart |
Request a new note
C
A
S
I |
JEF
-
NYSE
Jefferies Financial Grp
Finance-Invest Bnk/Bkrs
|
$34.63
|
-0.05
-0.14% |
$35.35
|
1,228,490
62.36% of 50 DAV
50 DAV is 1,970,000
|
$36.02
-3.86%
|
6/28/2021
|
$31.81
|
PP = $34.42
|
|
MB = $36.14
|
Most Recent Note - 8/17/2021 3:36:55 PM
Y - Hovering near its all-time high with light volume behind today's 4th consecutive small loss, Its 50 DMA line ($32.89) defines near-term support to watch. More damaging losses would raise concerns and trigger a technical sell signal. As previously noted - "Subsequent gains above the pivot point backed by at least +40% above average volume are necessary to trigger a technical buy signal."
>>> FEATURED STOCK ARTICLE : Quiet Gains for New High Closes - 8/10/2021 |
View all notes |
Set NEW NOTE alert |
Company Profile |
SEC
News |
Chart |
Request a new note
C
A
S
I |
CLAR
-
NASDAQ
Clarus Corporation
Leisure-Products
|
$26.66
|
-0.34
-1.26% |
$27.24
|
104,353
47.65% of 50 DAV
50 DAV is 219,000
|
$32.36
-17.61%
|
5/12/2021
|
$21.40
|
PP = $19.73
|
|
MB = $20.72
|
Most Recent Note - 8/12/2021 5:08:20 PM
G - Pulled back today with near average volume and ended near the session low. Pulling back from its 52-week high after getting very extended from any sound base. Bullish action came after it reported Jun '21 quarterly earnings +244% on +41% sales revenues versus the year ago period, showing impressive sales revenues and earnings acceleration in sequential quarterly comparisons. Its 50 DMA line ($26.71) defines important near-term support to watch on pullbacks.
>>> FEATURED STOCK ARTICLE : Extended From Prior Base and Hitting Another New High - 7/20/2021 |
View all notes |
Set NEW NOTE alert |
Company Profile |
SEC
News |
Chart |
Request a new note
C
A
S
I |
AVTR
-
NYSE
Avantor Inc
Medical-Research Eqp/Svc
|
$38.30
|
-1.01
-2.57% |
$39.31
|
3,045,776
84.35% of 50 DAV
50 DAV is 3,611,000
|
$39.45
-2.92%
|
6/10/2021
|
$32.94
|
PP = $34.09
|
|
MB = $35.79
|
Most Recent Note - 8/12/2021 5:11:46 PM
G - Volume totals have been below average while stubbornly holding its ground perched at its all-time high, extended from any sound base. Reported Jun '21 earnings +84% on +26% sales revenues versus the year ago period. Its 50 DMA line ($35.74) defines support above the prior high in the $34 area.
>>> FEATURED STOCK ARTICLE : Held Ground But Made Little Price Progress Since Featured - 7/14/2021 |
View all notes |
Set NEW NOTE alert |
Company Profile |
SEC
News |
Chart |
Request a new note
C
A
S
I |
Symbol/Exchange
Company Name
Industry Group |
PRICE |
CHANGE
(%Change) |
Day High |
Volume
(% DAV)
(% 50 day avg vol) |
52 Wk Hi
% From Hi |
Featured
Date |
Price
Featured |
Pivot Featured |
|
Max Buy |
MIME
-
NASDAQ
Mimecast Limited
Computer Sftwr-Security
|
$57.98
|
-0.77
-1.31% |
$58.96
|
290,883
52.13% of 50 DAV
50 DAV is 558,000
|
$59.96
-3.30%
|
8/2/2021
|
$56.12
|
PP = $59.58
|
|
MB = $62.56
|
Most Recent Note - 8/13/2021 5:27:47 PM
Y - Posted a gain today with light volume for a best-ever close. Stubbornly held its ground with volume totals cooling after a big volume-driven gain on 8/03/21 for a new all-time high. Bullish action came after reporting Jun '21 quarterly earnings +45% on +24% sales revenues versus the year ago period. It was highlighted in yellow in the prior mid-day report with pivot point cited based on its 12/28/20 high plus 10 cents when noted - "Subsequent gains above the pivot point backed by at least +40% above average volume may trigger a technical buy signal."
>>> FEATURED STOCK ARTICLE : Perched Not Far From High With Earnings News Due Pre-Open - 8/2/2021 |
View all notes |
Set NEW NOTE alert |
Company Profile |
SEC
News |
Chart |
Request a new note
C
A
S
I |