***Last / Change / Volume data in this table is the closing quote data***
Symbol/Exchange
Company Name
Industry Group |
PRICE |
CHANGE
(%Change) |
Day High |
Volume
(% DAV)
(% 50 day avg vol) |
52 Wk Hi
% From Hi |
Featured
Date |
Price
Featured |
Pivot Featured |
|
Max Buy |
THO
-
NYSE
Thor Industries Inc
AUTOMOTIVE - Recreational Vehicles
|
$104.75
|
-0.56
-0.53% |
$105.64
|
330,403
44.59% of 50 DAV
50 DAV is 741,000
|
$115.74
-9.49%
|
6/7/2017
|
$102.95
|
PP = $98.92
|
|
MB = $103.87
|
 Most Recent Note - 8/8/2017 7:07:01 PM
G - Found support near its 50 DMA line ($103.84) last week. More damaging loses would raise concerns and trigger a technical sell signal. Previously noted - "Faces some resistance due to overhead supply up through the $115 level."
>>> FEATURED STOCK ARTICLE : Still Faces Some Resistance Due to Overhead Supply - 7/20/2017 |
View all notes |
Set NEW NOTE alert |
Company Profile |
SEC
News |
Chart |
Request a new note
C
A
S
I |
SBCF
-
NASDAQ
Seacoast Banking Corp Fl
BANKING - Regional - Mid-Atlantic Banks
|
$23.98
|
-0.02
-0.08% |
$24.24
|
127,841
46.32% of 50 DAV
50 DAV is 276,000
|
$25.88
-7.34%
|
6/9/2017
|
$24.13
|
PP = $25.98
|
|
MB = $27.28
|
Most Recent Note - 8/4/2017 12:46:26 PM
G - Rebounding above its 50 DMA line ($23.86) with today's 4th consecutive gain. Recently reported earnings +21% on +27% sales revenues for the Jun '17 quarter, below the +25% minimum earnings guideline (C criteria). The 200 DMA line ($22.47) and prior lows in the $21 area define the next important support.
>>> FEATURED STOCK ARTICLE : Florida Bank Perched -6.6% Off All-Time High - 7/6/2017 |
View all notes |
Set NEW NOTE alert |
Company Profile |
SEC
News |
Chart |
Request a new note
C
A
S
I |
BERY
-
NYSE
Berry Global Group Inc
CONSUMER NON-DURABLES - Packaging and Containers
|
$57.03
|
-0.54
-0.94% |
$57.70
|
803,105
90.34% of 50 DAV
50 DAV is 889,000
|
$58.95
-3.26%
|
7/14/2017
|
$57.67
|
PP = $59.05
|
|
MB = $62.00
|
Most Recent Note - 8/8/2017 7:08:35 PM
G - Met resistance at its 50 DMA line ($57.53) recently while rebounding. More damaging losses would raise greater concerns and trigger a worrisome technical sell signal. Reported Jun '17 quarterly earnings +13% on +16% sales revenues, below the +25% minimum earnings guideline (C criteria), raising fundamental concerns.
>>> FEATURED STOCK ARTICLE : Found Prompt Support at 50-Day Moving Average Line - 7/7/2017 |
View all notes |
Set NEW NOTE alert |
Company Profile |
SEC
News |
Chart |
Request a new note
C
A
S
I |
HSKA
-
NASDAQ
Heska Corporation
DRUGS - Biotechnology
|
$101.66
|
+1.27
1.27% |
$102.65
|
52,324
70.71% of 50 DAV
50 DAV is 74,000
|
$115.00
-11.60%
|
7/31/2017
|
$114.27
|
PP = $110.35
|
|
MB = $115.87
|
Most Recent Note - 8/8/2017 7:00:23 PM
Y - Found prompt support near its 50 DMA line ($99.65). Encountered distributional pressure after highlighted in yellow in the 7/31/17 mid-day report with pivot point cited based on its high hit on 5/01/17 plus 10 cents. Subsequent gains and a strong finish above its pivot point may clinch a convincing technical buy signal. Small supply of only 6 million shares in the public float (S criteria) can contribute to greater price volatility in the event of institutional buying or selling.
>>> FEATURED STOCK ARTICLE : Small Supply of Shares and Closed In Lower Half of Intra-day Range - 7/31/2017 |
View all notes |
Set NEW NOTE alert |
Company Profile |
SEC
News |
Chart |
Request a new note
C
A
S
I |
EW
-
NYSE
Edwards Lifesciences Cp
HEALTH SERVICES - Medical Appliances and Equipment
|
$116.16
|
-0.32
-0.27% |
$117.29
|
976,924
81.74% of 50 DAV
50 DAV is 1,195,100
|
$121.75
-4.59%
|
7/11/2017
|
$117.23
|
PP = $121.85
|
|
MB = $127.94
|
Most Recent Note - 8/7/2017 5:04:22 PM
G - Perched within striking distance of its 52-week high but its Relative Strength Rating has slumped to 75, below the 80+ minimum guideline for buy candidates. Still lingering below its 50 DMA line ($116.92). Reported Jun '17 quarterly earnings +42% on +11% sales revenues, continuing its strong earnings track record. Subsequent volume-driven gains for new highs may trigger a new (or add-on) technical buy signal which could mark the beginning of a new leg up. See the latest FSU analysis for more details and a new annotated graph.
>>> FEATURED STOCK ARTICLE : Near 50-Day Moving Average Line, Yet Not Far Off High - 8/7/2017 |
View all notes |
Set NEW NOTE alert |
Company Profile |
SEC
News |
Chart |
Request a new note
C
A
S
I |
Symbol/Exchange
Company Name
Industry Group |
PRICE |
CHANGE
(%Change) |
Day High |
Volume
(% DAV)
(% 50 day avg vol) |
52 Wk Hi
% From Hi |
Featured
Date |
Price
Featured |
Pivot Featured |
|
Max Buy |
NTES
-
NASDAQ
Netease Inc Adr
INTERNET - Internet Information Providers
|
$309.22
|
+1.41
0.46% |
$313.15
|
1,251,228
107.96% of 50 DAV
50 DAV is 1,159,000
|
$337.55
-8.39%
|
6/8/2017
|
$310.76
|
PP = $307.62
|
|
MB = $323.00
|
Most Recent Note - 8/4/2017 5:38:49 PM
G - Quietly consolidating near its 50 DMA line ($305.32). Due to report Jun '17 earnings news on Wednesday, 8/09/17. Volume and volatility often increase near earnings news. Disciplined investors limit losses by selling any stock that falls more than -7% from their purchase price. Recent gains lacked great volume conviction.
>>> FEATURED STOCK ARTICLE : Found Recent Support at 50-Day Moving Average Line - 7/21/2017 |
View all notes |
Set NEW NOTE alert |
Company Profile |
SEC
News |
Chart |
Request a new note
C
A
S
I |
STMP
-
NASDAQ
Stamps.com Inc
INTERNET - Internet Software and Services
|
$212.70
|
-0.75
-0.35% |
$217.40
|
608,265
122.63% of 50 DAV
50 DAV is 496,000
|
$220.25
-3.43%
|
5/24/2017
|
$133.10
|
PP = $136.10
|
|
MB = $142.91
|
Most Recent Note - 8/7/2017 12:40:59 PM
G - Reported earnings +61% on +38% sales revenues for the Jun '17 quarter. Extended from any sound base after a considerable "breakaway gap" on 8/03/17 for new 52-week and all-time highs. Its 50 DMA line ($150) defines near-term support above prior lows in the $140-141 area.
>>> FEATURED STOCK ARTICLE : Pulling Back After Getting Extended From Prior Base - 7/5/2017 |
View all notes |
Set NEW NOTE alert |
Company Profile |
SEC
News |
Chart |
Request a new note
C
A
S
I |
MELI
-
NASDAQ
Mercadolibre Inc
INTERNET - Internet Software and; Services
|
$251.92
|
-4.25
-1.66% |
$259.17
|
853,928
114.95% of 50 DAV
50 DAV is 742,900
|
$297.95
-15.45%
|
6/15/2017
|
$261.73
|
PP = $297.95
|
|
MB = $312.85
|
Most Recent Note - 8/7/2017 12:31:49 PM
G - Slumping further today after a gap down on the prior session violated its 50 DMA line ($273) triggering a technical sell signal. Color code was changed to green after reporting Jun '17 quarterly earnings -18% on +59% sales revenues, raising fundamental concerns.
>>> FEATURED STOCK ARTICLE : Technical Weakness After Earnings Below System's Guidelines - 8/4/2017 |
View all notes |
Set NEW NOTE alert |
Company Profile |
SEC
News |
Chart |
Request a new note
C
A
S
I |
HTHT
-
NASDAQ
China Lodging Group Ads
LEISURE - Lodging
|
$105.30
|
-0.31
-0.29% |
$105.49
|
394,646
163.75% of 50 DAV
50 DAV is 241,000
|
$106.35
-0.99%
|
9/29/2016
|
$46.12
|
PP = $47.82
|
|
MB = $50.21
|
Most Recent Note - 8/7/2017 5:06:46 PM
G - Hit yet another new all-time high today, getting very extended from any sound base. Its 50 DMA line ($85.35) defines near-term support. Sub par sales revenues growth was recently noted among concerns, however, earnings increases through the Mar '17 quarter have been strong versus the year-ago periods.
>>> FEATURED STOCK ARTICLE : China-Based Hotel Firm is Extended From Any Sound Base - 6/28/2017 |
View all notes |
Set NEW NOTE alert |
Company Profile |
SEC
News |
Chart |
Request a new note
C
A
S
I |
LMAT
-
NASDAQ
Lemaitre Vascular Inc
Medical-Products
|
$34.06
|
+0.11
0.32% |
$34.64
|
200,834
107.40% of 50 DAV
50 DAV is 187,000
|
$36.09
-5.62%
|
7/28/2017
|
$33.50
|
PP = $33.32
|
|
MB = $34.99
|
Most Recent Note - 8/4/2017 10:51:18 AM
Y - Pulling back near prior highs in the $32-33 area noted as initial support to watch. Disciplined investors avoid chasing extended stocks more than +5% above prior highs, and they always limit losses by selling any stock that falls more than -7% from their purchase price.
>>> FEATURED STOCK ARTICLE : Big Volume-Driven Gain Following Strong Earnings News - 7/28/2017 |
View all notes |
Set NEW NOTE alert |
Company Profile |
SEC
News |
Chart |
Request a new note
C
A
S
I |
Symbol/Exchange
Company Name
Industry Group |
PRICE |
CHANGE
(%Change) |
Day High |
Volume
(% DAV)
(% 50 day avg vol) |
52 Wk Hi
% From Hi |
Featured
Date |
Price
Featured |
Pivot Featured |
|
Max Buy |
BEAT
-
NASDAQ
BioTelemetry Inc
Medical-Services
|
$35.25
|
+0.10
0.28% |
$36.50
|
663,751
155.08% of 50 DAV
50 DAV is 428,000
|
$35.75
-1.40%
|
2/14/2017
|
$25.10
|
PP = $24.55
|
|
MB = $25.78
|
Most Recent Note - 8/7/2017 5:11:15 PM
G - Perched near its 52-week and all-time highs and no resistance remains due to overhead supply. Due to report Jun '17 quarterly earnings on Tuesday, 8/08/17 after the close. Volume and volatility often increase near earnings news. Its 50 DMA line ($31.82) and prior lows in the $26.50 - $27.00 area define near-term support. Bullish action continued after sub par Mar '17 earnings were repeatedly noted.
>>> FEATURED STOCK ARTICLE : New Highs on Twice Average Volume; Fundamental Concerns Remain - 7/14/2017 |
View all notes |
Set NEW NOTE alert |
Company Profile |
SEC
News |
Chart |
Request a new note
C
A
S
I |
ESNT
-
NYSE
Essent Group Ltd
Finance-MrtgandRel Svc
|
$39.44
|
-1.22
-3.00% |
$39.99
|
2,977,547
657.30% of 50 DAV
50 DAV is 453,000
|
$41.44
-4.83%
|
7/3/2017
|
$38.05
|
PP = $39.60
|
|
MB = $41.58
|
Most Recent Note - 8/8/2017 11:54:36 AM
Y - Pulling back today after proposing a new Public Offering. Powered to new all-time highs with above average volume behind 2 consecutive gains. as it triggered a new (or add-on) technical buy signal. Losses below the 50 DMA line ($37.57) and prior low ($34.08 on 5/05/17) would raise concerns and trigger technical sell signals. Reported Jun '17 quarterly earnings +35% on +27% sales revenues, continuing its strong earnings track record.
>>> FEATURED STOCK ARTICLE : Perched Within Close Striking Distance of a New High - 8/1/2017 |
View all notes |
Set NEW NOTE alert |
Company Profile |
SEC
News |
Chart |
Request a new note
C
A
S
I |
VEEV
-
NYSE
Veeva Systems Inc Cl A
Computer Sftwr-Medical
|
$62.83
|
-0.35
-0.55% |
$63.54
|
755,166
44.90% of 50 DAV
50 DAV is 1,682,000
|
$68.07
-7.70%
|
7/24/2017
|
$65.91
|
PP = $68.17
|
|
MB = $71.58
|
Most Recent Note - 8/7/2017 5:13:26 PM
G - Quiet gain today finishing above its 50 DMA line ($62.92), but it faces resistance due to overhead supply up through the $$68 level. More damaging losses would raise greater concerns. Disciplined investors will note that it did not produce the necessary volume-driven gains for a new 52-week high needed to trigger a new (or add-on) technical buy signal.
>>> FEATURED STOCK ARTICLE : Slump Below 50-Day Moving Average Line Raises Concerns - 8/2/2017 |
View all notes |
Set NEW NOTE alert |
Company Profile |
SEC
News |
Chart |
Request a new note
C
A
S
I |
ANET
-
NYSE
Arista Networks Inc
TELECOMMUNICATIONS - Communication Equipment
|
$169.94
|
-3.81
-2.19% |
$174.90
|
1,171,420
129.87% of 50 DAV
50 DAV is 902,000
|
$176.50
-3.72%
|
8/4/2017
|
$173.31
|
PP = $163.07
|
|
MB = $171.22
|
Most Recent Note - 8/8/2017 6:55:16 PM
Y - Color code is changed to yellow after retreating below its "max buy" level. Cleared a new pivot point cited based on its 6/23/17 high plus 10 cents with a big "breakaway gap" on 8/04/17 triggering a technical buy signal. Reported Jun '17 quarterly earnings +81% on +51% sales revenues, continuing its strong earnings history.
>>> FEATURED STOCK ARTICLE : Networking Firm Consolidating Above 50-Day Moving Average Line - 7/18/2017 |
View all notes |
Set NEW NOTE alert |
Company Profile |
SEC
News |
Chart |
Request a new note
C
A
S
I |
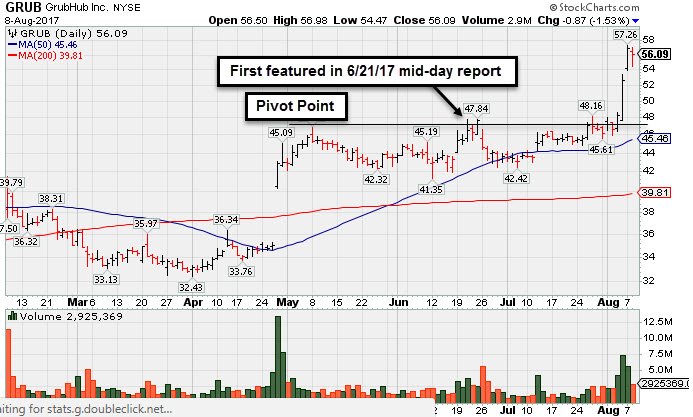
GRUB
-
NYSE
Grubhub Inc
COMPUTER SOFTWARE and SERVICES - Technical and System Software
|
$56.09
|
-0.87
-1.53% |
$56.98
|
2,925,369
140.24% of 50 DAV
50 DAV is 2,086,000
|
$57.26
-2.04%
|
6/21/2017
|
$47.33
|
PP = $46.94
|
|
MB = $49.29
|
Most Recent Note - 8/8/2017 6:53:37 PM
G - Pulled back today after spiking to new 52-week and all-time highs with 3 consecutive volume-driven gains. Color code was changed to green after rallying above its "max buy" level. Reported earnings +13% on +32% sales revenues for the Jun '17 quarter, below the +25% minimum earnings guideline (C criteria) raising fundamental concerns. See the latest FSU analysis for more details and a new annotated graph.
>>> FEATURED STOCK ARTICLE : Spiked Into New High Territory Despite Sub Par Earnings News - 8/8/2017 |
View all notes |
Set NEW NOTE alert |
Company Profile |
SEC
News |
Chart |
Request a new note
C
A
S
I |
Symbol/Exchange
Company Name
Industry Group |
PRICE |
CHANGE
(%Change) |
Day High |
Volume
(% DAV)
(% 50 day avg vol) |
52 Wk Hi
% From Hi |
Featured
Date |
Price
Featured |
Pivot Featured |
|
Max Buy |
IBP
-
NYSE
Installed Building Prod
DIVERSIFIED SERVICES - Business/Management Services
|
$58.55
|
+1.10
1.91% |
$59.60
|
121,339
92.63% of 50 DAV
50 DAV is 131,000
|
$60.00
-2.42%
|
6/13/2017
|
$54.25
|
PP = $55.55
|
|
MB = $58.33
|
Most Recent Note - 8/8/2017 6:58:21 PM
G - Color code is changed to green after rising just above its "max buy" level. A big volume-driven gain on 8/04/17 triggered a technical buy signal. Reported earnings +48% on +33% sales revenues for the Jun '17 quarter.
>>> FEATURED STOCK ARTICLE : Volume Cooling While Staying Above 50-Day Moving Average Line - 7/17/2017 |
View all notes |
Set NEW NOTE alert |
Company Profile |
SEC
News |
Chart |
Request a new note
C
A
S
I |
NCOM
-
NASDAQ
National Commerce Corp
BANKING - Regional - Southeast Banks
|
$39.90
|
+0.00
0.00% |
$40.58
|
20,245
65.31% of 50 DAV
50 DAV is 31,000
|
$41.25
-3.27%
|
4/25/2017
|
$38.95
|
PP = $40.09
|
|
MB = $42.09
|
Most Recent Note - 8/4/2017 5:33:26 PM
Y - Consolidating above support at its 50 DMA line ($39.30). Subsequent damaging losses violating it or the recent lows would trigger technical sell signals. Reported Jun '17 earnings +23% on +45% sales revenues, below the +25% minimum earnings guideline (C criteria), raising fundamental concerns.
>>> FEATURED STOCK ARTICLE : Recent Breakout Lacked Great Volume Conviction - 7/10/2017 |
View all notes |
Set NEW NOTE alert |
Company Profile |
SEC
News |
Chart |
Request a new note
C
A
S
I |
HQY
-
NASDAQ
Healthequity Inc
COMPUTER SOFTWARE and SERVICES - Healthcare Information Service
|
$47.52
|
-0.65
-1.35% |
$48.36
|
198,783
37.44% of 50 DAV
50 DAV is 531,000
|
$54.95
-13.52%
|
6/7/2017
|
$50.01
|
PP = $49.35
|
|
MB = $51.82
|
Most Recent Note - 8/4/2017 5:35:15 PM
G - Still sputtering well below its 50 DMA line ($49.35). A rebound above the 50 DMA line is needed for its outlook to improve. Faces some resistance due to overhead supply up through the $54 level.
>>> FEATURED STOCK ARTICLE : 50-Day Moving Average Violation Triggers Technical Sell Signal - 7/19/2017 |
View all notes |
Set NEW NOTE alert |
Company Profile |
SEC
News |
Chart |
Request a new note
C
A
S
I |
OLLI
-
NASDAQ
Ollie's Bargain Outlet
Retail-DiscountandVariety
|
$44.85
|
-0.20
-0.44% |
$45.60
|
540,792
73.98% of 50 DAV
50 DAV is 731,000
|
$46.08
-2.66%
|
7/17/2017
|
$43.96
|
PP = $44.18
|
|
MB = $46.39
|
Most Recent Note - 8/7/2017 5:05:31 PM
Y - Encountered distributional pressure today while perched near its 52-week high. Subsequent gains and a strong close above the pivot point backed by at least +40% above average volume may trigger a new (or add-on) technical buy signal. Its 50 DMA line ($42.59) defines support above recent lows in the $37-38 area.
>>> FEATURED STOCK ARTICLE : Recently Found Support Near 50-Day Moving Average - 6/29/2017 |
View all notes |
Set NEW NOTE alert |
Company Profile |
SEC
News |
Chart |
Request a new note
C
A
S
I |
LITE
-
NASDAQ
Lumentum Holdings Inc
TELECOMMUNICATIONS - Cables / Satalite Equipment
|
$59.25
|
+0.50
0.85% |
$59.40
|
3,531,663
204.02% of 50 DAV
50 DAV is 1,731,000
|
$68.63
-13.67%
|
7/13/2017
|
$64.15
|
PP = $67.40
|
|
MB = $70.77
|
Most Recent Note - 8/4/2017 12:31:32 PM
G - Color code was changed to green while slumping below its 50 DMA line ($61.33). Only a prompt rebound above the 50 DMA line would help its outlook improve. Disciplined investors always limit losses by selling any stock that falls more than -7% from their purchase price. The prior low ($56.20 on 6/29/17) defines the next important support to watch. Due to report Jun '17 quarterly earnings before the open on Wednesday, 8/09/17.
>>> FEATURED STOCK ARTICLE : High Ranked Telecom - Fiber Optics Firm - 7/13/2017 |
View all notes |
Set NEW NOTE alert |
Company Profile |
SEC
News |
Chart |
Request a new note
C
A
S
I |
Symbol/Exchange
Company Name
Industry Group |
PRICE |
CHANGE
(%Change) |
Day High |
Volume
(% DAV)
(% 50 day avg vol) |
52 Wk Hi
% From Hi |
Featured
Date |
Price
Featured |
Pivot Featured |
|
Max Buy |
MOMO
-
NASDAQ
Momo Inc Ads Cl A
INTERNET - Content
|
$45.80
|
-0.19
-0.41% |
$46.69
|
2,944,743
54.77% of 50 DAV
50 DAV is 5,377,000
|
$46.33
-1.14%
|
7/25/2017
|
$44.05
|
PP = $46.05
|
|
MB = $48.35
|
Most Recent Note - 8/7/2017 5:08:49 PM
Y - Quietly rose with below average volume to a best-ever close today. Perched within close striking distance of the new pivot point cited based in 5/22/17 high plus 10 cents. Subsequent volume-driven gains for new highs may trigger a new (or add-on) technical buy signal. Consolidating above its 50 DMA line, building on a third-stage base. Prior low ($35.02 on 6/15/17) defines the next important chart support level where a violation would raise more serious concerns.
>>> FEATURED STOCK ARTICLE : Perched Within Striking Distance of Prior High - 7/25/2017 |
View all notes |
Set NEW NOTE alert |
Company Profile |
SEC
News |
Chart |
Request a new note
C
A
S
I |
HLI
-
NYSE
Houlihan Lokey Inc Cl A
Finance-Invest Bnk/Bkrs
|
$35.79
|
-0.26
-0.72% |
$36.30
|
98,590
55.70% of 50 DAV
50 DAV is 177,000
|
$39.68
-9.80%
|
5/10/2017
|
$35.85
|
PP = $35.05
|
|
MB = $36.80
|
Most Recent Note - 8/8/2017 7:01:58 PM
G - Consolidating near prior highs in the $35-36 area and its 50 DMA line ($35.55) defining important near-term support to watch. More damaging losses would raise concerns.
>>> FEATURED STOCK ARTICLE : Extended Leader Encounters Distributional Pressure - 7/27/2017 |
View all notes |
Set NEW NOTE alert |
Company Profile |
SEC
News |
Chart |
Request a new note
C
A
S
I |