Symbol/Exchange
Company Name
Industry Group |
PRICE |
CHANGE
(%Change) |
Day High |
Volume
(% DAV)
(% 50 day avg vol) |
52 Wk Hi
% From Hi |
Featured
Date |
Price
Featured |
Pivot Featured |
|
Max Buy |
THO
-
NYSE
Thor Industries Inc
AUTOMOTIVE - Recreational Vehicles
|
$103.80
|
-1.88
-1.78% |
$105.92
|
486,775
64.73% of 50 DAV
50 DAV is 752,000
|
$115.74
-10.31%
|
6/7/2017
|
$102.95
|
PP = $98.92
|
|
MB = $103.87
|
 Most Recent Note - 8/2/2017 6:07:34 PM
G - Testing its 50 DMA line ($102.87) with today's loss. More damaging loses would raise concerns and trigger a technical sell signal. Previously noted - "Faces some resistance due to overhead supply up through the $115 level."
>>> FEATURED STOCK ARTICLE : Still Faces Some Resistance Due to Overhead Supply - 7/20/2017 |
View all notes |
Set NEW NOTE alert |
Company Profile |
SEC
News |
Chart |
Request a new note
C
A
S
I |
SBCF
-
NASDAQ
Seacoast Banking Corp Fl
BANKING - Regional - Mid-Atlantic Banks
|
$23.72
|
+0.08
0.34% |
$23.82
|
168,601
61.99% of 50 DAV
50 DAV is 272,000
|
$25.88
-8.35%
|
6/9/2017
|
$24.13
|
PP = $25.98
|
|
MB = $27.28
|
Most Recent Note - 8/2/2017 6:08:40 PM
G - Sputtering near its 50 DMA line ($23.82). Recently reported earnings +21% on +27% sales revenues for the Jun '17 quarter, below the +25% minimum earnings guideline (C criteria). Subsequent losses below the recent low ($23.03) would trigger a more worrisome technical sell signal.
>>> FEATURED STOCK ARTICLE : Florida Bank Perched -6.6% Off All-Time High - 7/6/2017 |
View all notes |
Set NEW NOTE alert |
Company Profile |
SEC
News |
Chart |
Request a new note
C
A
S
I |
BERY
-
NYSE
Berry Global Group Inc
CONSUMER NON-DURABLES - Packaging and Containers
|
$56.86
|
+0.50
0.89% |
$56.94
|
1,703,052
199.65% of 50 DAV
50 DAV is 853,000
|
$58.95
-3.55%
|
7/14/2017
|
$57.67
|
PP = $59.05
|
|
MB = $62.00
|
Most Recent Note - 8/2/2017 6:05:39 PM
G - Due to report Jun '17 quarterly earnings news before the open on Thursday, 8/03/17. Still sputtering below its 50 DMA line ($57.54). A rebound above the 50 DMA line and subsequent volume-driven gains above the pivot point are needed for its outlook to improve and for a new (or add-on) technical buy signal to be triggered. More damaging losses would raise greater concerns and trigger a worrisome technical sell signal.
>>> FEATURED STOCK ARTICLE : Found Prompt Support at 50-Day Moving Average Line - 7/7/2017 |
View all notes |
Set NEW NOTE alert |
Company Profile |
SEC
News |
Chart |
Request a new note
C
A
S
I |
HSKA
-
NASDAQ
Heska Corporation
DRUGS - Biotechnology
|
$101.28
|
-8.14
-7.44% |
$111.93
|
104,867
143.65% of 50 DAV
50 DAV is 73,000
|
$115.00
-11.93%
|
7/31/2017
|
$114.27
|
PP = $110.35
|
|
MB = $115.87
|
Most Recent Note - 8/2/2017 1:51:31 PM
Y - Retreating from its high toward its 50 DMA line ($99.59). Encountered distributional pressure after highlighted in yellow in the 7/31/17 mid-day report with pivot point cited based on its high hit on 5/01/17 plus 10 cents. Subsequent gains and a strong finish above its pivot point may clinch a convincing technical buy signal. Quarterly and annual earnings (C and A criteria) history has been strong. Small supply of only 6 million shares in the public float (S criteria) can contribute to greater price volatility in the event of institutional buying or selling. See the latest FSU analysis for more details and an annotated graph.
>>> FEATURED STOCK ARTICLE : Small Supply of Shares and Closed In Lower Half of Intra-day Range - 7/31/2017 |
View all notes |
Set NEW NOTE alert |
Company Profile |
SEC
News |
Chart |
Request a new note
C
A
S
I |
EW
-
NYSE
Edwards Lifesciences Cp
HEALTH SERVICES - Medical Appliances and Equipment
|
$114.24
|
-1.03
-0.89% |
$115.48
|
1,249,533
105.21% of 50 DAV
50 DAV is 1,187,600
|
$121.75
-6.17%
|
7/11/2017
|
$117.23
|
PP = $121.85
|
|
MB = $127.94
|
Most Recent Note - 8/1/2017 6:30:03 PM
G - Its Relative Strength Rating has slumped to 67, below the 80+ minimum guideline for buy candidates. Color code is changed to green while sputtering below its 50 DMA line ($116.77). Reported Jun '17 quarterly earnings +42% on +11% sales revenues, continuing its strong earnings track record. Subsequent volume-driven gains for new highs may trigger a new (or add-on) technical buy signal which could mark the beginning of a new leg up.
>>> FEATURED STOCK ARTICLE : Medical Products Firm Perched Near All-Time High - 6/26/2017 |
View all notes |
Set NEW NOTE alert |
Company Profile |
SEC
News |
Chart |
Request a new note
C
A
S
I |
Symbol/Exchange
Company Name
Industry Group |
PRICE |
CHANGE
(%Change) |
Day High |
Volume
(% DAV)
(% 50 day avg vol) |
52 Wk Hi
% From Hi |
Featured
Date |
Price
Featured |
Pivot Featured |
|
Max Buy |
NTES
-
NASDAQ
Netease Inc Adr
INTERNET - Internet Information Providers
|
$299.33
|
-9.07
-2.94% |
$307.54
|
1,535,637
128.51% of 50 DAV
50 DAV is 1,195,000
|
$337.55
-11.32%
|
6/8/2017
|
$310.76
|
PP = $307.62
|
|
MB = $323.00
|
Most Recent Note - 8/2/2017 12:34:51 PM
G - Color code is changed to green while slumping bellow its 50 DMA line ($304) today. Disciplined investors limit losses by selling any stock that falls more than -7% from their purchase price. Recent gains lacked great volume conviction.
>>> FEATURED STOCK ARTICLE : Found Recent Support at 50-Day Moving Average Line - 7/21/2017 |
View all notes |
Set NEW NOTE alert |
Company Profile |
SEC
News |
Chart |
Request a new note
C
A
S
I |
STMP
-
NASDAQ
Stamps.com Inc
INTERNET - Internet Software and Services
|
$151.30
|
-0.85
-0.56% |
$154.00
|
774,942
182.77% of 50 DAV
50 DAV is 424,000
|
$158.75
-4.69%
|
5/24/2017
|
$133.10
|
PP = $136.10
|
|
MB = $142.91
|
Most Recent Note - 8/1/2017 6:33:48 PM
G - Perched within close striking distance of its 52-week high, however it has not formed a sound base. Its 50 DMA line ($145.23) defines near-term support above prior lows in the $140-141 area. Due to report earnings for the Jun '17 quarter after the close on Wednesday, 8/02/17.
>>> FEATURED STOCK ARTICLE : Pulling Back After Getting Extended From Prior Base - 7/5/2017 |
View all notes |
Set NEW NOTE alert |
Company Profile |
SEC
News |
Chart |
Request a new note
C
A
S
I |
MELI
-
NASDAQ
Mercadolibre Inc
INTERNET - Internet Software and; Services
|
$286.60
|
-2.28
-0.79% |
$293.86
|
863,731
135.59% of 50 DAV
50 DAV is 637,000
|
$297.95
-3.81%
|
6/15/2017
|
$261.73
|
PP = $297.95
|
|
MB = $312.85
|
Most Recent Note - 8/2/2017 12:32:25 PM
Y - Due to report Jun '17 quarterly earnings news. Perched within close striking distance of its 52-week high. Subsequent volume-driven gains above the pivot point may trigger a new (or add-on) technical buy signal. Consolidating above its 50 DMA line ($273), and little resistance remains due to overhead supply.
>>> FEATURED STOCK ARTICLE : Little Resistance Remains While Rebounding Near Prior Highs - 7/26/2017 |
View all notes |
Set NEW NOTE alert |
Company Profile |
SEC
News |
Chart |
Request a new note
C
A
S
I |
HTHT
-
NASDAQ
China Lodging Group Ads
LEISURE - Lodging
|
$97.71
|
-2.64
-2.63% |
$100.81
|
197,018
83.84% of 50 DAV
50 DAV is 235,000
|
$103.32
-5.43%
|
9/29/2016
|
$46.12
|
PP = $47.82
|
|
MB = $50.21
|
Most Recent Note - 8/1/2017 6:37:33 PM
G - Touched another new all-time high today then reversed into the red. Very extended from any sound base. Its 50 DMA line ($83.46) defines near-term support. Sub par sales revenues growth was recently noted among concerns, however, earnings increases through the Mar '17 quarter have been strong versus the year-ago periods.
>>> FEATURED STOCK ARTICLE : China-Based Hotel Firm is Extended From Any Sound Base - 6/28/2017 |
View all notes |
Set NEW NOTE alert |
Company Profile |
SEC
News |
Chart |
Request a new note
C
A
S
I |
LMAT
-
NASDAQ
Lemaitre Vascular Inc
Medical-Products
|
$34.07
|
-0.39
-1.13% |
$34.67
|
270,156
152.63% of 50 DAV
50 DAV is 177,000
|
$36.09
-5.60%
|
7/28/2017
|
$33.50
|
PP = $33.32
|
|
MB = $34.99
|
Most Recent Note - 8/1/2017 11:36:54 AM
Y - Pulling back today following 2 big volume-driven gains into new high territory. Prior highs in the $32-33 area define initial support to watch. Disciplined investors avoid chasing extended stocks more than +5% above prior highs, and they always limit losses by selling any stock that falls more than -7% from their purchase price.
>>> FEATURED STOCK ARTICLE : Big Volume-Driven Gain Following Strong Earnings News - 7/28/2017 |
View all notes |
Set NEW NOTE alert |
Company Profile |
SEC
News |
Chart |
Request a new note
C
A
S
I |
Symbol/Exchange
Company Name
Industry Group |
PRICE |
CHANGE
(%Change) |
Day High |
Volume
(% DAV)
(% 50 day avg vol) |
52 Wk Hi
% From Hi |
Featured
Date |
Price
Featured |
Pivot Featured |
|
Max Buy |
BEAT
-
NASDAQ
BioTelemetry Inc
Medical-Services
|
$34.10
|
-0.45
-1.30% |
$34.50
|
240,566
55.43% of 50 DAV
50 DAV is 434,000
|
$35.75
-4.62%
|
2/14/2017
|
$25.10
|
PP = $24.55
|
|
MB = $25.78
|
Most Recent Note - 8/1/2017 4:16:10 PM
G - Due to report Jun '17 quarterly earnings on 8/08/17. Volume and volatility often increase near earnings news. Its 50 DMA line ($31.36) and prior lows in the $26.50 - $27.00 area define near-term support. Bullish action continued after sub par Mar '17 earnings were repeatedly noted.
>>> FEATURED STOCK ARTICLE : New Highs on Twice Average Volume; Fundamental Concerns Remain - 7/14/2017 |
View all notes |
Set NEW NOTE alert |
Company Profile |
SEC
News |
Chart |
Request a new note
C
A
S
I |
ESNT
-
NYSE
Essent Group Ltd
Finance-MrtgandRel Svc
|
$38.62
|
-0.48
-1.23% |
$39.16
|
435,172
105.88% of 50 DAV
50 DAV is 411,000
|
$39.61
-2.50%
|
7/3/2017
|
$38.05
|
PP = $39.60
|
|
MB = $41.58
|
Most Recent Note - 8/1/2017 6:27:59 PM
Y - Rose within close striking distance of its all-time high with above average volume behind today's gain. Subsequent gains above the pivot point backed by at least +40% above average volume may trigger a new (or add-on) technical buy signal. Losses below the 50 DMA line ($37.27) and prior low ($34.08 on 5/05/17) would raise concerns and trigger technical sell signals. Due to report Jun '17 quarterly earnings on 8/04/17. See the latest FSU analysis for more details and a new annotated graph.
>>> FEATURED STOCK ARTICLE : Perched Within Close Striking Distance of a New High - 8/1/2017 |
View all notes |
Set NEW NOTE alert |
Company Profile |
SEC
News |
Chart |
Request a new note
C
A
S
I |
MTSI
-
NASDAQ
Macom Tech Solution Hldg
Elec-Semiconductor Mfg
|
$45.50
|
-15.56
-25.48% |
$49.44
|
7,269,993
933.25% of 50 DAV
50 DAV is 779,000
|
$65.99
-31.05%
|
5/16/2017
|
$52.52
|
PP = $53.89
|
|
MB = $56.58
|
Most Recent Note - 8/2/2017 1:49:39 PM
G - Gapped down today for a damaging volume-driven loss violating its 50 and 200 DMA lines triggering technical sell signals. Reported earnings +40% on +37% sales revenues for the Jun '17 quarter, above the +25% minimum warnings guideline (C criteria).
>>> FEATURED STOCK ARTICLE : Meeting Resistance Near Prior High - 6/27/2017 |
View all notes |
Set NEW NOTE alert |
Company Profile |
SEC
News |
Chart |
Request a new note
C
A
S
I |
VEEV
-
NYSE
Veeva Systems Inc Cl A
Computer Sftwr-Medical
|
$61.98
|
-2.62
-4.06% |
$64.80
|
1,196,137
66.97% of 50 DAV
50 DAV is 1,786,000
|
$68.07
-8.95%
|
7/24/2017
|
$65.91
|
PP = $68.17
|
|
MB = $71.58
|
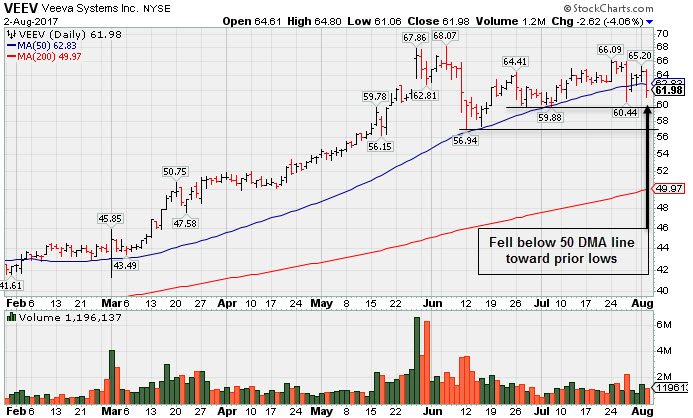
Most Recent Note - 8/2/2017 1:53:42 PM
G - Color code is changed to green today while undercutting its 50 DMA line ($62.83). More damaging losses would raise greater concerns. Disciplined investors will note that it did not produce the necessary volume-driven gains for a new 52-week high needed to trigger a new (or add-on) technical buy signal.
>>> FEATURED STOCK ARTICLE : Slump Below 50-Day Moving Average Line Raises Concerns - 8/2/2017 |
View all notes |
Set NEW NOTE alert |
Company Profile |
SEC
News |
Chart |
Request a new note
C
A
S
I |
ANET
-
NYSE
Arista Networks Inc
TELECOMMUNICATIONS - Communication Equipment
|
$143.46
|
-4.34
-2.94% |
$148.97
|
1,162,458
149.99% of 50 DAV
50 DAV is 775,000
|
$162.97
-11.97%
|
4/17/2017
|
$132.75
|
PP = $135.27
|
|
MB = $142.03
|
Most Recent Note - 8/2/2017 6:03:40 PM
G - Undercut prior lows in the $144-143 area triggering technical sell signals while slumping further below its 50 DMA line ($152) with today's 6th consecutive loss on higher volume. Due to report Jun '17 quarterly earnings news on Thursday, 8/03/17 after the close.
>>> FEATURED STOCK ARTICLE : Networking Firm Consolidating Above 50-Day Moving Average Line - 7/18/2017 |
View all notes |
Set NEW NOTE alert |
Company Profile |
SEC
News |
Chart |
Request a new note
C
A
S
I |
Symbol/Exchange
Company Name
Industry Group |
PRICE |
CHANGE
(%Change) |
Day High |
Volume
(% DAV)
(% 50 day avg vol) |
52 Wk Hi
% From Hi |
Featured
Date |
Price
Featured |
Pivot Featured |
|
Max Buy |
GRUB
-
NYSE
GrubHub Inc
COMPUTER SOFTWARE and SERVICES - Technical and System Software
|
$46.66
|
-0.56
-1.19% |
$47.48
|
2,298,050
125.55% of 50 DAV
50 DAV is 1,830,400
|
$48.16
-3.11%
|
6/21/2017
|
$47.33
|
PP = $46.94
|
|
MB = $49.29
|
Most Recent Note - 8/1/2017 4:14:22 PM
Y - Posted a solid gain today, rising within close striking distance of its 52-week and all-time highs. Members were previously reminded - "A confirming gain backed by at least +40% above average volume and strong close above the pivot point may clinch a technical buy signal."
>>> FEATURED STOCK ARTICLE : Found Prompt Support at 50-Day Moving Average - 6/30/2017 |
View all notes |
Set NEW NOTE alert |
Company Profile |
SEC
News |
Chart |
Request a new note
C
A
S
I |
IBP
-
NYSE
Installed Building Prod
DIVERSIFIED SERVICES - Business/Management Services
|
$53.45
|
-1.45
-2.64% |
$54.95
|
76,451
61.16% of 50 DAV
50 DAV is 125,000
|
$55.45
-3.61%
|
6/13/2017
|
$54.25
|
PP = $55.55
|
|
MB = $58.33
|
Most Recent Note - 7/31/2017 5:42:15 PM
Y - Still consolidating in a tight range above its 50 DMA line ($51.95). Volume-driven gains above the pivot point are still needed to trigger a proper new technical buy signal.
>>> FEATURED STOCK ARTICLE : Volume Cooling While Staying Above 50-Day Moving Average Line - 7/17/2017 |
View all notes |
Set NEW NOTE alert |
Company Profile |
SEC
News |
Chart |
Request a new note
C
A
S
I |
NCOM
-
NASDAQ
National Commerce Corp
BANKING - Regional - Southeast Banks
|
$39.90
|
-0.15
-0.37% |
$40.15
|
10,737
34.64% of 50 DAV
50 DAV is 31,000
|
$41.25
-3.27%
|
4/25/2017
|
$38.95
|
PP = $40.09
|
|
MB = $42.09
|
Most Recent Note - 7/31/2017 5:48:24 PM
Y - Reported Jun '17 earnings +23% on +45% sales revenues, below the +25% minimum earnings guideline (C criteria), raising fundamental concerns. Found support at its 50 DMA line ($39.13) recently and any damaging losses violating it or the recent lows would trigger technical sell signals.
>>> FEATURED STOCK ARTICLE : Recent Breakout Lacked Great Volume Conviction - 7/10/2017 |
View all notes |
Set NEW NOTE alert |
Company Profile |
SEC
News |
Chart |
Request a new note
C
A
S
I |
INGN
-
NASDAQ
Inogen Inc
HEALTH SERVICES - Medical Instruments and Supplies
|
$96.50
|
+0.13
0.13% |
$96.92
|
260,513
144.73% of 50 DAV
50 DAV is 180,000
|
$97.71
-1.24%
|
7/12/2017
|
$94.95
|
PP = $97.81
|
|
MB = $102.70
|
Most Recent Note - 8/1/2017 6:39:22 PM
Y - Posted a gain today with above average volume, rising within close striking distance of its 52-week high. Subsequent volume-driven gains for new highs may trigger a new (or add-on) technical buy signal. Near-term support is its 50 DMA line ($92.91) and recent lows in the $91-92 area. Due to report Jun '17 quarterly earnings after the close on 8/03/17, and volume and volatility often increase near earnings news.
>>> FEATURED STOCK ARTICLE : In Tight Range Near All-Time High With Volume Totals Cooling - 7/12/2017 |
View all notes |
Set NEW NOTE alert |
Company Profile |
SEC
News |
Chart |
Request a new note
C
A
S
I |
HQY
-
NASDAQ
Healthequity Inc
COMPUTER SOFTWARE and SERVICES - Healthcare Information Service
|
$46.08
|
-1.13
-2.39% |
$47.47
|
297,854
56.41% of 50 DAV
50 DAV is 528,000
|
$54.95
-16.14%
|
6/7/2017
|
$50.01
|
PP = $49.35
|
|
MB = $51.82
|
Most Recent Note - 7/31/2017 5:49:58 PM
G - Color code is changed to green while slumping well below its 50 DMA line ($49.21). A rebound above the 50 DMA line is needed for its outlook to improve. Faces some resistance due to overhead supply up through the $54 level.
>>> FEATURED STOCK ARTICLE : 50-Day Moving Average Violation Triggers Technical Sell Signal - 7/19/2017 |
View all notes |
Set NEW NOTE alert |
Company Profile |
SEC
News |
Chart |
Request a new note
C
A
S
I |
Symbol/Exchange
Company Name
Industry Group |
PRICE |
CHANGE
(%Change) |
Day High |
Volume
(% DAV)
(% 50 day avg vol) |
52 Wk Hi
% From Hi |
Featured
Date |
Price
Featured |
Pivot Featured |
|
Max Buy |
OLLI
-
NASDAQ
Ollie's Bargain Outlet
Retail-DiscountandVariety
|
$43.95
|
-0.50
-1.12% |
$44.65
|
479,446
65.77% of 50 DAV
50 DAV is 729,000
|
$46.08
-4.61%
|
7/17/2017
|
$43.96
|
PP = $44.18
|
|
MB = $46.39
|
Most Recent Note - 8/1/2017 4:17:06 PM
Y - Touched a new 52-week high today then reversed into the red. Subsequent gains and a strong close above the pivot point backed by at least +40% above average volume may trigger a new (or add-on) technical buy signal. Its 50 DMA line ($42.30) defines support above recent lows in the $37-38 area.
>>> FEATURED STOCK ARTICLE : Recently Found Support Near 50-Day Moving Average - 6/29/2017 |
View all notes |
Set NEW NOTE alert |
Company Profile |
SEC
News |
Chart |
Request a new note
C
A
S
I |
LITE
-
NASDAQ
Lumentum Holdings Inc
TELECOMMUNICATIONS - Cables / Satalite Equipment
|
$61.70
|
-2.00
-3.14% |
$65.00
|
3,201,074
192.37% of 50 DAV
50 DAV is 1,664,000
|
$68.63
-10.10%
|
7/13/2017
|
$64.15
|
PP = $67.40
|
|
MB = $70.77
|
Most Recent Note - 8/2/2017 12:20:41 PM
Y - Consolidating just above its 50 DMA line ($61.18). Disciplined investors always limit losses by selling any stock that falls more than -7% from their purchase price. More damaging losses would raise concerns and the prior low ($56.20 on 6/29/17) defines the next important support to watch.
>>> FEATURED STOCK ARTICLE : High Ranked Telecom - Fiber Optics Firm - 7/13/2017 |
View all notes |
Set NEW NOTE alert |
Company Profile |
SEC
News |
Chart |
Request a new note
C
A
S
I |
MOMO
-
NASDAQ
Momo Inc Ads Cl A
INTERNET - Content
|
$43.90
|
-1.14
-2.53% |
$46.33
|
5,276,729
81.53% of 50 DAV
50 DAV is 6,472,000
|
$45.95
-4.46%
|
7/25/2017
|
$44.05
|
PP = $46.05
|
|
MB = $48.35
|
Most Recent Note - 8/2/2017 1:52:47 PM
Y - Touched a new high today then reversed into the red. Still within close striking distance of the new pivot point cited based in 5/22/17 high plus 10 cents. Subsequent volume-driven gains for new highs may trigger a new (or add-on) technical buy signal. Consolidating above its 50 DMA line, building on a third-stage base. Prior low ($35.02 on 6/15/17) defines the next important chart support level where a violation would raise more serious concerns.
>>> FEATURED STOCK ARTICLE : Perched Within Striking Distance of Prior High - 7/25/2017 |
View all notes |
Set NEW NOTE alert |
Company Profile |
SEC
News |
Chart |
Request a new note
C
A
S
I |
HLI
-
NYSE
Houlihan Lokey Inc Cl A
Finance-Invest Bnk/Bkrs
|
$36.63
|
-0.58
-1.56% |
$37.45
|
116,366
63.94% of 50 DAV
50 DAV is 182,000
|
$39.68
-7.69%
|
5/10/2017
|
$35.85
|
PP = $35.05
|
|
MB = $36.80
|
Most Recent Note - 8/2/2017 6:00:57 PM
G - Retreating further from its all-time high with a loss today on lighter than average volume. Prior highs in the $35-36 area and its 50 DMA line define near-term support to watch.
>>> FEATURED STOCK ARTICLE : Extended Leader Encounters Distributional Pressure - 7/27/2017 |
View all notes |
Set NEW NOTE alert |
Company Profile |
SEC
News |
Chart |
Request a new note
C
A
S
I |