***Last / Change / Volume data in this table is the closing quote data***
Symbol/Exchange
Company Name
Industry Group |
PRICE |
CHANGE
(%Change) |
Day High |
Volume
(% DAV)
(% 50 day avg vol) |
52 Wk Hi
% From Hi |
Featured
Date |
Price
Featured |
Pivot Featured |
|
Max Buy |
THO
-
NYSE
Thor Industries Inc
AUTOMOTIVE - Recreational Vehicles
|
$107.10
|
+1.73
1.64% |
$107.90
|
642,198
81.19% of 50 DAV
50 DAV is 791,000
|
$115.74
-7.46%
|
6/7/2017
|
$102.95
|
PP = $98.92
|
|
MB = $103.87
|
Most Recent Note - 7/20/2017 5:24:55 PM
G - Consolidating above its "max buy" level following its prior breakout from a"double bottom" base. Faces some resistance due to overhead supply up through the $115 level. See the latest FSU analysis for more details and a new annotated graph.
>>> FEATURED STOCK ARTICLE : Still Faces Some Resistance Due to Overhead Supply - 7/20/2017 |
View all notes |
Set NEW NOTE alert |
Company Profile |
SEC
News |
Chart |
Request a new note
C
A
S
I |
SBCF
-
NASDAQ
Seacoast Banking Corp Fl
BANKING - Regional - Mid-Atlantic Banks
|
$24.24
|
+0.49
2.06% |
$24.33
|
178,534
62.78% of 50 DAV
50 DAV is 284,400
|
$25.88
-6.34%
|
6/9/2017
|
$24.13
|
PP = $25.98
|
|
MB = $27.28
|
Most Recent Note - 7/20/2017 5:43:00 PM
Y - Still quietly consolidating near its 50 DMA line ($23.71). Subsequent losses below the recent low would trigger a more worrisome technical sell signal. Previously noted - "Subsequent volume-driven gains for new highs may trigger a new technical buy signal. "
>>> FEATURED STOCK ARTICLE : Florida Bank Perched -6.6% Off All-Time High - 7/6/2017 |
View all notes |
Set NEW NOTE alert |
Company Profile |
SEC
News |
Chart |
Request a new note
C
A
S
I |
BERY
-
NYSE
Berry Global Group Inc
CONSUMER NON-DURABLES - Packaging and Containers
|
$56.89
|
+0.16
0.28% |
$57.51
|
750,186
83.73% of 50 DAV
50 DAV is 896,000
|
$58.95
-3.49%
|
7/14/2017
|
$57.67
|
PP = $59.05
|
|
MB = $62.00
|
Most Recent Note - 7/20/2017 5:30:08 PM
Y - Quietly fell today, slumping to a close just below its 50 DMA line ($57.48). Subsequent volume-driven gains above the pivot point may trigger a new (or add-on) technical buy signal. More damaging losses below the recent low ($56.14 on 7/06/17) would raise greater concerns and trigger a worrisome technical sell signal.
>>> FEATURED STOCK ARTICLE : Found Prompt Support at 50-Day Moving Average Line - 7/7/2017 |
View all notes |
Set NEW NOTE alert |
Company Profile |
SEC
News |
Chart |
Request a new note
C
A
S
I |
EW
-
NYSE
Edwards Lifesciences Cp
HEALTH SERVICES - Medical Appliances and Equipment
|
$115.87
|
-1.27
-1.08% |
$117.64
|
1,502,521
130.95% of 50 DAV
50 DAV is 1,147,400
|
$121.75
-4.83%
|
7/11/2017
|
$117.23
|
PP = $121.85
|
|
MB = $127.94
|
 Most Recent Note - 7/25/2017 3:26:49 PM
Y - Pulling back below its 50 DMA line ($116.48) today raising some concerns. Due to report Jun '17 quarterly results following the close on Wednesday, July 26th, and volume and volatility often increase near earnings news. Subsequent volume-driven gains for new highs may trigger a new (or add-on) technical buy signal which could mark the beginning of a considerable new leg up. Volume totals have been mostly below average in recent weeks while holding its ground in a tight range.
>>> FEATURED STOCK ARTICLE : Medical Products Firm Perched Near All-Time High - 6/26/2017 |
View all notes |
Set NEW NOTE alert |
Company Profile |
SEC
News |
Chart |
Request a new note
C
A
S
I |
NTES
-
NASDAQ
Netease Inc Adr
INTERNET - Internet Information Providers
|
$308.89
|
-2.61
-0.84% |
$312.47
|
851,182
66.29% of 50 DAV
50 DAV is 1,284,000
|
$337.55
-8.49%
|
6/8/2017
|
$310.76
|
PP = $307.62
|
|
MB = $323.00
|
Most Recent Note - 7/21/2017 5:32:56 PM
Y - Consolidating just above its 50 DMA line ($300.66) with volume totals cooling. Disciplined investors limit losses by selling any stock that falls more than -7% from their purchase price. Recent gains lacked great volume conviction. See the latest FSU analysis for more details and a new annotated graph.
>>> FEATURED STOCK ARTICLE : Found Recent Support at 50-Day Moving Average Line - 7/21/2017 |
View all notes |
Set NEW NOTE alert |
Company Profile |
SEC
News |
Chart |
Request a new note
C
A
S
I |
Symbol/Exchange
Company Name
Industry Group |
PRICE |
CHANGE
(%Change) |
Day High |
Volume
(% DAV)
(% 50 day avg vol) |
52 Wk Hi
% From Hi |
Featured
Date |
Price
Featured |
Pivot Featured |
|
Max Buy |
STMP
-
NASDAQ
Stamps.com Inc
INTERNET - Internet Software and Services
|
$151.90
|
+0.30
0.20% |
$155.50
|
333,608
65.54% of 50 DAV
50 DAV is 509,000
|
$156.40
-2.88%
|
5/24/2017
|
$133.10
|
PP = $136.10
|
|
MB = $142.91
|
Most Recent Note - 7/24/2017 11:55:22 AM
G - Wedged higher above its "max buy" level with recent gains lacking volume conviction and its color code is changed to green. Prior low and its 50 DMA line define near-term support in the $140-141 area.
>>> FEATURED STOCK ARTICLE : Pulling Back After Getting Extended From Prior Base - 7/5/2017 |
View all notes |
Set NEW NOTE alert |
Company Profile |
SEC
News |
Chart |
Request a new note
C
A
S
I |
MELI
-
NASDAQ
Mercadolibre Inc
INTERNET - Internet Software and; Services
|
$279.26
|
-3.12
-1.10% |
$282.50
|
701,210
106.73% of 50 DAV
50 DAV is 657,000
|
$297.95
-6.27%
|
6/15/2017
|
$261.73
|
PP = $297.95
|
|
MB = $312.85
|
Most Recent Note - 7/25/2017 3:22:42 PM
G - Consolidating above its 50 DMA line ($273), yet it faces resistance due to overhead supply up to the $298 level.
>>> FEATURED STOCK ARTICLE : Test of 10-Week Moving Average May Be a Secondary Buy Point - 6/15/2017 |
View all notes |
Set NEW NOTE alert |
Company Profile |
SEC
News |
Chart |
Request a new note
C
A
S
I |
HTHT
-
NASDAQ
China Lodging Group Ads
LEISURE - Lodging
|
$95.07
|
+0.10
0.11% |
$96.44
|
136,659
55.55% of 50 DAV
50 DAV is 246,000
|
$96.65
-1.64%
|
9/29/2016
|
$46.12
|
PP = $47.82
|
|
MB = $50.21
|
Most Recent Note - 7/24/2017 11:52:23 AM
G - Rallying into new all-time high territory with today's early gain. Its 50 DMA line ($80.97) defines near-term support above the prior low ($75.01 on 6/15/17). Sub par sales revenues growth was recently noted among concerns, however, earnings increases through the Mar '17 quarter have been strong versus the year-ago periods.
>>> FEATURED STOCK ARTICLE : China-Based Hotel Firm is Extended From Any Sound Base - 6/28/2017 |
View all notes |
Set NEW NOTE alert |
Company Profile |
SEC
News |
Chart |
Request a new note
C
A
S
I |
BEAT
-
NASDAQ
BioTelemetry Inc
Medical-Services
|
$35.30
|
+0.40
1.15% |
$35.35
|
699,819
155.17% of 50 DAV
50 DAV is 451,000
|
$35.60
-0.84%
|
2/14/2017
|
$25.10
|
PP = $24.55
|
|
MB = $25.78
|
Most Recent Note - 7/25/2017 12:14:48 PM
G - Perched near its all-time high, encountering mild distributional pressure. Due to report Jun '17 quarterly earnings on 7/31/17. Volume and volatility often increase near earnings news. Its 50 DMA line ($30.71) and prior lows in the $26.50 - $27.00 area define near-term support. Bullish action continued after sub par Mar '17 earnings were repeatedly noted.
>>> FEATURED STOCK ARTICLE : New Highs on Twice Average Volume; Fundamental Concerns Remain - 7/14/2017 |
View all notes |
Set NEW NOTE alert |
Company Profile |
SEC
News |
Chart |
Request a new note
C
A
S
I |
ESNT
-
NYSE
Essent Group Ltd
Finance-MrtgandRel Svc
|
$38.35
|
+0.26
0.68% |
$39.17
|
344,414
79.73% of 50 DAV
50 DAV is 432,000
|
$39.61
-3.18%
|
7/3/2017
|
$38.05
|
PP = $39.60
|
|
MB = $41.58
|
Most Recent Note - 7/20/2017 5:44:24 PM
Y - Quietly perched near its all-time high. Subsequent gains above the pivot point backed by at least +40% above average volume may trigger a new (or add-on) technical buy signal. Losses below the 50 DMA line ($37.02) and prior low ($34.08 on 5/05/17) would raise concerns and trigger technical sell signals.
>>> FEATURED STOCK ARTICLE : Sputtering Below its 50-Day Moving Average - 6/20/2017 |
View all notes |
Set NEW NOTE alert |
Company Profile |
SEC
News |
Chart |
Request a new note
C
A
S
I |
Symbol/Exchange
Company Name
Industry Group |
PRICE |
CHANGE
(%Change) |
Day High |
Volume
(% DAV)
(% 50 day avg vol) |
52 Wk Hi
% From Hi |
Featured
Date |
Price
Featured |
Pivot Featured |
|
Max Buy |
MTSI
-
NASDAQ
Macom Tech Solution Hldg
Elec-Semiconductor Mfg
|
$64.96
|
+1.29
2.03% |
$65.54
|
731,272
86.13% of 50 DAV
50 DAV is 849,000
|
$64.20
1.18%
|
5/16/2017
|
$52.52
|
PP = $53.89
|
|
MB = $56.58
|
Most Recent Note - 7/24/2017 2:50:12 PM
G - Gains have lacked great volume conviction while it hit another new all-time high with today's 4th consecutive gain. Did not form a sound base. Found support near its 50 DMA line ($58.02) during its latest consolidation.
>>> FEATURED STOCK ARTICLE : Meeting Resistance Near Prior High - 6/27/2017 |
View all notes |
Set NEW NOTE alert |
Company Profile |
SEC
News |
Chart |
Request a new note
C
A
S
I |
VEEV
-
NYSE
Veeva Systems Inc Cl A
Computer Sftwr-Medical
|
$64.93
|
-0.86
-1.31% |
$66.02
|
1,584,808
87.46% of 50 DAV
50 DAV is 1,812,000
|
$68.07
-4.61%
|
7/24/2017
|
$65.91
|
PP = $68.17
|
|
MB = $71.58
|
Most Recent Note - 7/24/2017 2:41:25 PM
Y - Color code is changed to yellow with a new pivot point cited based on its 6/06/17 high plus 10 cents. Subsequent volume-driven gains for a new 52-week high may trigger a new (or add-on) technical buy signal. Found support at its 50 DMA line ($62.14) in recent weeks.
>>> FEATURED STOCK ARTICLE : Rebounding Since Testing Support at 50-Day Moving Average Line - 6/23/2017 |
View all notes |
Set NEW NOTE alert |
Company Profile |
SEC
News |
Chart |
Request a new note
C
A
S
I |
ANET
-
NYSE
Arista Networks Inc
TELECOMMUNICATIONS - Communication Equipment
|
$158.00
|
+2.78
1.79% |
$158.07
|
405,132
52.14% of 50 DAV
50 DAV is 777,000
|
$162.97
-3.05%
|
4/17/2017
|
$132.75
|
PP = $135.27
|
|
MB = $142.03
|
Most Recent Note - 7/21/2017 12:08:13 PM
G - Gapped down today undercutting its 50 DMA line ($151.11) then rebounding from early lows. It is extended from any sound base. Prior lows in the $144-143 area define the next important support to watch.
>>> FEATURED STOCK ARTICLE : Networking Firm Consolidating Above 50-Day Moving Average Line - 7/18/2017 |
View all notes |
Set NEW NOTE alert |
Company Profile |
SEC
News |
Chart |
Request a new note
C
A
S
I |
GRUB
-
NYSE
Grubhub Inc
COMPUTER SOFTWARE and SERVICES - Technical and System Software
|
$45.61
|
+0.17
0.37% |
$45.92
|
1,346,793
72.84% of 50 DAV
50 DAV is 1,849,000
|
$47.84
-4.66%
|
6/21/2017
|
$47.33
|
PP = $46.94
|
|
MB = $49.29
|
Most Recent Note - 7/25/2017 3:19:53 PM
Y - Quietly perched within striking distance of its 52-week and all-time highs. Volume totals still have been cooling while stubbornly holding its ground since gapping up above its 50 DMA line on 7/12/17. Endured distributional pressure recently after it briefly rose above the new pivot point cited based on its 5/08/17 high plus 10 cents. Members were previously reminded - "A confirming gain backed by at least +40% above average volume and strong close above the pivot point may clinch a technical buy signal."
>>> FEATURED STOCK ARTICLE : Found Prompt Support at 50-Day Moving Average - 6/30/2017 |
View all notes |
Set NEW NOTE alert |
Company Profile |
SEC
News |
Chart |
Request a new note
C
A
S
I |
IBP
-
NYSE
Installed Building Prod
DIVERSIFIED SERVICES - Business/Management Services
|
$51.90
|
+0.85
1.67% |
$51.90
|
72,102
53.81% of 50 DAV
50 DAV is 134,000
|
$55.45
-6.40%
|
6/13/2017
|
$54.25
|
PP = $55.55
|
|
MB = $58.33
|
Most Recent Note - 7/24/2017 12:08:38 PM
Y - Consolidating in a tight range near its 50 DMA line ($51.44). Volume-driven gains above the pivot point are still needed to trigger a proper new technical buy signal.
>>> FEATURED STOCK ARTICLE : Volume Cooling While Staying Above 50-Day Moving Average Line - 7/17/2017 |
View all notes |
Set NEW NOTE alert |
Company Profile |
SEC
News |
Chart |
Request a new note
C
A
S
I |
Symbol/Exchange
Company Name
Industry Group |
PRICE |
CHANGE
(%Change) |
Day High |
Volume
(% DAV)
(% 50 day avg vol) |
52 Wk Hi
% From Hi |
Featured
Date |
Price
Featured |
Pivot Featured |
|
Max Buy |
NCOM
-
NASDAQ
National Commerce Corp
BANKING - Regional - Southeast Banks
|
$40.65
|
+0.60
1.50% |
$40.88
|
18,772
60.55% of 50 DAV
50 DAV is 31,000
|
$41.25
-1.45%
|
4/25/2017
|
$38.95
|
PP = $40.09
|
|
MB = $42.09
|
Most Recent Note - 7/24/2017 2:46:56 PM
Y - Due to report Jun '17 earnings news after the market closes on Tuesday, July 25, 2017, and volume and volatility often increase near earnings news. Found support at its 50 DMA line ($38.90) recently and any damaging losses violating it or the recent lows would trigger technical sell signals.
>>> FEATURED STOCK ARTICLE : Recent Breakout Lacked Great Volume Conviction - 7/10/2017 |
View all notes |
Set NEW NOTE alert |
Company Profile |
SEC
News |
Chart |
Request a new note
C
A
S
I |
INGN
-
NASDAQ
Inogen Inc
HEALTH SERVICES - Medical Instruments and Supplies
|
$96.44
|
+0.48
0.50% |
$97.31
|
93,873
52.15% of 50 DAV
50 DAV is 180,000
|
$97.71
-1.30%
|
7/12/2017
|
$94.95
|
PP = $97.81
|
|
MB = $102.70
|
Most Recent Note - 7/24/2017 2:56:10 PM
Y - Color code was changed to yellow with new pivot point cited based on its 6/22/17 high as it formed an advanced "3-weeks tight" base. Subsequent volume-driven gains for new highs may trigger a new (or add-on) technical buy signal. Near-term support is its 50 DMA line ($91.35).
>>> FEATURED STOCK ARTICLE : In Tight Range Near All-Time High With Volume Totals Cooling - 7/12/2017 |
View all notes |
Set NEW NOTE alert |
Company Profile |
SEC
News |
Chart |
Request a new note
C
A
S
I |
HQY
-
NASDAQ
Healthequity Inc
COMPUTER SOFTWARE and SERVICES - Healthcare Information Service
|
$49.35
|
+0.64
1.31% |
$49.98
|
311,866
59.63% of 50 DAV
50 DAV is 523,000
|
$54.95
-10.19%
|
6/7/2017
|
$50.01
|
PP = $49.35
|
|
MB = $51.82
|
Most Recent Note - 7/25/2017 3:31:19 PM
Y - Color code is changed to yellow after rebounding above its 50 DMA line ($49.02) helping its outlook improve. Faces some resistance due to overhead supply up through the $54 level.
>>> FEATURED STOCK ARTICLE : 50-Day Moving Average Violation Triggers Technical Sell Signal - 7/19/2017 |
View all notes |
Set NEW NOTE alert |
Company Profile |
SEC
News |
Chart |
Request a new note
C
A
S
I |
PLAY
-
NASDAQ
Dave & Buster's Ent Inc
Retail-Restaurants
|
$64.87
|
-1.10
-1.67% |
$66.24
|
811,042
120.15% of 50 DAV
50 DAV is 675,000
|
$73.48
-11.72%
|
2/23/2017
|
$55.41
|
PP = $58.35
|
|
MB = $61.27
|
Most Recent Note - 7/24/2017 5:08:34 PM
G - Sputtered back below its 50-day moving average (DMA) line ($67.09) raising concerns. It faces near-term resistance due to overhead supply up through the $73 level. Prior lows in the $64 area define important near-term support to watch where more damaging losses would trigger a worrisome technical sell signal. See the latest FSU analysis for more details and a new annotated graph.
>>> FEATURED STOCK ARTICLE : Faces Near-Term Resistance Up to $73 Due to Overhead Supply - 7/24/2017 |
View all notes |
Set NEW NOTE alert |
Company Profile |
SEC
News |
Chart |
Request a new note
C
A
S
I |
OLLI
-
NASDAQ
Ollie's Bargain Outlet
Retail-DiscountandVariety
|
$44.25
|
+0.50
1.14% |
$44.30
|
407,702
54.58% of 50 DAV
50 DAV is 747,000
|
$44.68
-0.95%
|
7/17/2017
|
$43.96
|
PP = $44.18
|
|
MB = $46.39
|
Most Recent Note - 7/25/2017 3:29:04 PM
Y - Perched at its 52-week high after gains with light volume. Subsequent gains and a strong close above the pivot point backed by at least +40% above average volume may trigger a new (or add-on) technical buy signal. Its 50 DMA line ($41.76) defines support above recent lows in the $37-38 area.
>>> FEATURED STOCK ARTICLE : Recently Found Support Near 50-Day Moving Average - 6/29/2017 |
View all notes |
Set NEW NOTE alert |
Company Profile |
SEC
News |
Chart |
Request a new note
C
A
S
I |
Symbol/Exchange
Company Name
Industry Group |
PRICE |
CHANGE
(%Change) |
Day High |
Volume
(% DAV)
(% 50 day avg vol) |
52 Wk Hi
% From Hi |
Featured
Date |
Price
Featured |
Pivot Featured |
|
Max Buy |
LITE
-
NASDAQ
Lumentum Holdings Inc
TELECOMMUNICATIONS - Cables / Satalite Equipment
|
$66.95
|
-1.00
-1.47% |
$67.75
|
2,440,034
144.81% of 50 DAV
50 DAV is 1,685,000
|
$68.05
-1.62%
|
7/13/2017
|
$64.15
|
PP = $67.40
|
|
MB = $70.77
|
Most Recent Note - 7/25/2017 12:47:31 PM
Y - Pulling back below its pivot point today after a technical breakout on the prior session. The considerable gain above the pivot point backed by +124% above average volume triggered a new (or add-on) technical buy signal. Its 50 DMA line ($60.15) and prior low ($56.20 on 6/29/17) define near-term support to watch.
>>> FEATURED STOCK ARTICLE : High Ranked Telecom - Fiber Optics Firm - 7/13/2017 |
View all notes |
Set NEW NOTE alert |
Company Profile |
SEC
News |
Chart |
Request a new note
C
A
S
I |
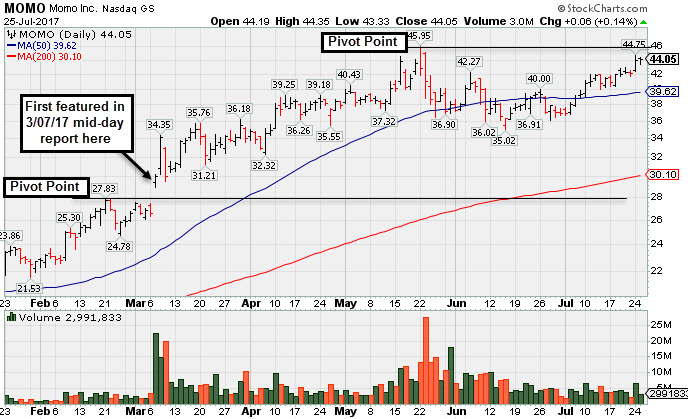
MOMO
-
NASDAQ
Momo Inc Ads Cl A
INTERNET - Content
|
$44.05
|
+0.06
0.14% |
$44.35
|
2,990,785
42.45% of 50 DAV
50 DAV is 7,045,000
|
$45.95
-4.13%
|
7/25/2017
|
$44.05
|
PP = $46.05
|
|
MB = $48.35
|
Most Recent Note - 7/25/2017 4:52:25 PM
Y - Color code is changed to yellow with new pivot point cited based in 5/22/17 high plus 10 cents. Subsequent volume-driven gains for new highs may trigger a new (or add-on) technical buy signal. Consolidating above its 50 DMA line, building on a third-stage base. Prior low ($35.02 on 6/15/17) defines the next important chart support level where a violation would raise more serious concerns. See the latest FSU analysis for more details and a new annotated graph.
>>> FEATURED STOCK ARTICLE : Perched Within Striking Distance of Prior High - 7/25/2017 |
View all notes |
Set NEW NOTE alert |
Company Profile |
SEC
News |
Chart |
Request a new note
C
A
S
I |
HLI
-
NYSE
Houlihan Lokey Inc Cl A
Finance-Invest Bnk/Bkrs
|
$37.94
|
+1.20
3.27% |
$38.08
|
196,079
121.04% of 50 DAV
50 DAV is 162,000
|
$37.32
1.66%
|
5/10/2017
|
$35.85
|
PP = $35.05
|
|
MB = $36.80
|
Most Recent Note - 7/25/2017 3:21:25 PM
G - Color code is changed to green while rallying above its "max buy" level for a new high. Prior highs and its 50 DMA line defines near-term support to watch on pullbacks.
>>> FEATURED STOCK ARTICLE : Gapped Up and Nearly Challenged Prior High - 6/19/2017 |
View all notes |
Set NEW NOTE alert |
Company Profile |
SEC
News |
Chart |
Request a new note
C
A
S
I |