***Last / Change / Volume data in this table is the closing quote data***
Symbol/Exchange
Company Name
Industry Group |
PRICE |
CHANGE
(%Change) |
Day High |
Volume
(% DAV)
(% 50 day avg vol) |
52 Wk Hi
% From Hi |
Featured
Date |
Price
Featured |
Pivot Featured |
|
Max Buy |
THO
-
NYSE
Thor Industries Inc
AUTOMOTIVE - Recreational Vehicles
|
$105.31
|
+0.63
0.60% |
$106.08
|
436,668
58.46% of 50 DAV
50 DAV is 747,000
|
$115.74
-9.01%
|
6/7/2017
|
$102.95
|
PP = $98.92
|
|
MB = $103.87
|
Most Recent Note - 8/2/2017 6:07:34 PM
G - Testing its 50 DMA line ($102.87) with today's loss. More damaging loses would raise concerns and trigger a technical sell signal. Previously noted - "Faces some resistance due to overhead supply up through the $115 level."
>>> FEATURED STOCK ARTICLE : Still Faces Some Resistance Due to Overhead Supply - 7/20/2017 |
View all notes |
Set NEW NOTE alert |
Company Profile |
SEC
News |
Chart |
Request a new note
C
A
S
I |
SBCF
-
NASDAQ
Seacoast Banking Corp Fl
BANKING - Regional - Mid-Atlantic Banks
|
$24.00
|
-0.10
-0.41% |
$24.32
|
172,494
62.73% of 50 DAV
50 DAV is 275,000
|
$25.88
-7.26%
|
6/9/2017
|
$24.13
|
PP = $25.98
|
|
MB = $27.28
|
Most Recent Note - 8/4/2017 12:46:26 PM
G - Rebounding above its 50 DMA line ($23.86) with today's 4th consecutive gain. Recently reported earnings +21% on +27% sales revenues for the Jun '17 quarter, below the +25% minimum earnings guideline (C criteria). The 200 DMA line ($22.47) and prior lows in the $21 area define the next important support.
>>> FEATURED STOCK ARTICLE : Florida Bank Perched -6.6% Off All-Time High - 7/6/2017 |
View all notes |
Set NEW NOTE alert |
Company Profile |
SEC
News |
Chart |
Request a new note
C
A
S
I |
BERY
-
NYSE
Berry Global Group Inc
CONSUMER NON-DURABLES - Packaging and Containers
|
$57.57
|
+0.15
0.26% |
$57.75
|
788,322
88.28% of 50 DAV
50 DAV is 893,000
|
$58.95
-2.34%
|
7/14/2017
|
$57.67
|
PP = $59.05
|
|
MB = $62.00
|
Most Recent Note - 8/3/2017 11:38:56 AM
G - Reported Jun '17 quarterly earnings +13% on +16% sales revenues, below the +25% minimum earnings guideline (C criteria), raising fundamental concerns. Still sputtering below its 50 DMA line ($57.55). More damaging losses would raise greater concerns and trigger a worrisome technical sell signal.
>>> FEATURED STOCK ARTICLE : Found Prompt Support at 50-Day Moving Average Line - 7/7/2017 |
View all notes |
Set NEW NOTE alert |
Company Profile |
SEC
News |
Chart |
Request a new note
C
A
S
I |
HSKA
-
NASDAQ
Heska Corporation
DRUGS - Biotechnology
|
$100.39
|
+1.64
1.66% |
$101.39
|
44,615
60.29% of 50 DAV
50 DAV is 74,000
|
$115.00
-12.70%
|
7/31/2017
|
$114.27
|
PP = $110.35
|
|
MB = $115.87
|
Most Recent Note - 8/2/2017 1:51:31 PM
Y - Retreating from its high toward its 50 DMA line ($99.59). Encountered distributional pressure after highlighted in yellow in the 7/31/17 mid-day report with pivot point cited based on its high hit on 5/01/17 plus 10 cents. Subsequent gains and a strong finish above its pivot point may clinch a convincing technical buy signal. Quarterly and annual earnings (C and A criteria) history has been strong. Small supply of only 6 million shares in the public float (S criteria) can contribute to greater price volatility in the event of institutional buying or selling. See the latest FSU analysis for more details and an annotated graph.
>>> FEATURED STOCK ARTICLE : Small Supply of Shares and Closed In Lower Half of Intra-day Range - 7/31/2017 |
View all notes |
Set NEW NOTE alert |
Company Profile |
SEC
News |
Chart |
Request a new note
C
A
S
I |
EW
-
NYSE
Edwards Lifesciences Cp
HEALTH SERVICES - Medical Appliances and Equipment
|
$116.48
|
+0.29
0.25% |
$116.74
|
722,918
60.39% of 50 DAV
50 DAV is 1,197,000
|
$121.75
-4.33%
|
7/11/2017
|
$117.23
|
PP = $121.85
|
|
MB = $127.94
|
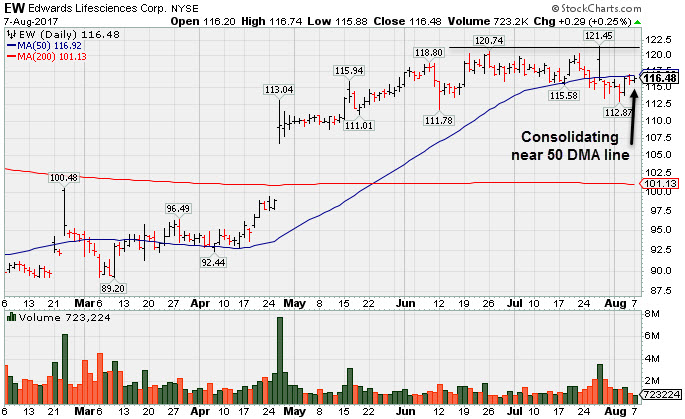
 Most Recent Note - 8/7/2017 5:04:22 PM
G - Perched within striking distance of its 52-week high but its Relative Strength Rating has slumped to 75, below the 80+ minimum guideline for buy candidates. Still lingering below its 50 DMA line ($116.92). Reported Jun '17 quarterly earnings +42% on +11% sales revenues, continuing its strong earnings track record. Subsequent volume-driven gains for new highs may trigger a new (or add-on) technical buy signal which could mark the beginning of a new leg up. See the latest FSU analysis for more details and a new annotated graph.
>>> FEATURED STOCK ARTICLE : Near 50-Day Moving Average Line, Yet Not Far Off High - 8/7/2017 |
View all notes |
Set NEW NOTE alert |
Company Profile |
SEC
News |
Chart |
Request a new note
C
A
S
I |
Symbol/Exchange
Company Name
Industry Group |
PRICE |
CHANGE
(%Change) |
Day High |
Volume
(% DAV)
(% 50 day avg vol) |
52 Wk Hi
% From Hi |
Featured
Date |
Price
Featured |
Pivot Featured |
|
Max Buy |
NTES
-
NASDAQ
Netease Inc Adr
INTERNET - Internet Information Providers
|
$307.81
|
+3.34
1.10% |
$308.74
|
1,272,468
109.41% of 50 DAV
50 DAV is 1,163,000
|
$337.55
-8.81%
|
6/8/2017
|
$310.76
|
PP = $307.62
|
|
MB = $323.00
|
Most Recent Note - 8/4/2017 5:38:49 PM
G - Quietly consolidating near its 50 DMA line ($305.32). Due to report Jun '17 earnings news on Wednesday, 8/09/17. Volume and volatility often increase near earnings news. Disciplined investors limit losses by selling any stock that falls more than -7% from their purchase price. Recent gains lacked great volume conviction.
>>> FEATURED STOCK ARTICLE : Found Recent Support at 50-Day Moving Average Line - 7/21/2017 |
View all notes |
Set NEW NOTE alert |
Company Profile |
SEC
News |
Chart |
Request a new note
C
A
S
I |
STMP
-
NASDAQ
Stamps.com Inc
INTERNET - Internet Software and Services
|
$213.45
|
+2.20
1.04% |
$220.25
|
1,385,183
281.54% of 50 DAV
50 DAV is 492,000
|
$214.80
-0.63%
|
5/24/2017
|
$133.10
|
PP = $136.10
|
|
MB = $142.91
|
Most Recent Note - 8/7/2017 12:40:59 PM
G - Reported earnings +61% on +38% sales revenues for the Jun '17 quarter. Extended from any sound base after a considerable "breakaway gap" on 8/03/17 for new 52-week and all-time highs. Its 50 DMA line ($150) defines near-term support above prior lows in the $140-141 area.
>>> FEATURED STOCK ARTICLE : Pulling Back After Getting Extended From Prior Base - 7/5/2017 |
View all notes |
Set NEW NOTE alert |
Company Profile |
SEC
News |
Chart |
Request a new note
C
A
S
I |
MELI
-
NASDAQ
Mercadolibre Inc
INTERNET - Internet Software and; Services
|
$256.17
|
-4.30
-1.65% |
$265.50
|
1,535,357
212.12% of 50 DAV
50 DAV is 723,800
|
$297.95
-14.02%
|
6/15/2017
|
$261.73
|
PP = $297.95
|
|
MB = $312.85
|
Most Recent Note - 8/7/2017 12:31:49 PM
G - Slumping further today after a gap down on the prior session violated its 50 DMA line ($273) triggering a technical sell signal. Color code was changed to green after reporting Jun '17 quarterly earnings -18% on +59% sales revenues, raising fundamental concerns.
>>> FEATURED STOCK ARTICLE : Technical Weakness After Earnings Below System's Guidelines - 8/4/2017 |
View all notes |
Set NEW NOTE alert |
Company Profile |
SEC
News |
Chart |
Request a new note
C
A
S
I |
HTHT
-
NASDAQ
China Lodging Group Ads
LEISURE - Lodging
|
$105.61
|
+6.65
6.72% |
$106.35
|
268,661
112.88% of 50 DAV
50 DAV is 238,000
|
$103.32
2.22%
|
9/29/2016
|
$46.12
|
PP = $47.82
|
|
MB = $50.21
|
Most Recent Note - 8/7/2017 5:06:46 PM
G - Hit yet another new all-time high today, getting very extended from any sound base. Its 50 DMA line ($85.35) defines near-term support. Sub par sales revenues growth was recently noted among concerns, however, earnings increases through the Mar '17 quarter have been strong versus the year-ago periods.
>>> FEATURED STOCK ARTICLE : China-Based Hotel Firm is Extended From Any Sound Base - 6/28/2017 |
View all notes |
Set NEW NOTE alert |
Company Profile |
SEC
News |
Chart |
Request a new note
C
A
S
I |
LMAT
-
NASDAQ
Lemaitre Vascular Inc
Medical-Products
|
$33.95
|
+0.79
2.38% |
$33.99
|
192,728
104.18% of 50 DAV
50 DAV is 185,000
|
$36.09
-5.93%
|
7/28/2017
|
$33.50
|
PP = $33.32
|
|
MB = $34.99
|
Most Recent Note - 8/4/2017 10:51:18 AM
Y - Pulling back near prior highs in the $32-33 area noted as initial support to watch. Disciplined investors avoid chasing extended stocks more than +5% above prior highs, and they always limit losses by selling any stock that falls more than -7% from their purchase price.
>>> FEATURED STOCK ARTICLE : Big Volume-Driven Gain Following Strong Earnings News - 7/28/2017 |
View all notes |
Set NEW NOTE alert |
Company Profile |
SEC
News |
Chart |
Request a new note
C
A
S
I |
Symbol/Exchange
Company Name
Industry Group |
PRICE |
CHANGE
(%Change) |
Day High |
Volume
(% DAV)
(% 50 day avg vol) |
52 Wk Hi
% From Hi |
Featured
Date |
Price
Featured |
Pivot Featured |
|
Max Buy |
BEAT
-
NASDAQ
BioTelemetry Inc
Medical-Services
|
$35.15
|
+1.20
3.53% |
$35.60
|
448,809
104.86% of 50 DAV
50 DAV is 428,000
|
$35.75
-1.68%
|
2/14/2017
|
$25.10
|
PP = $24.55
|
|
MB = $25.78
|
Most Recent Note - 8/7/2017 5:11:15 PM
G - Perched near its 52-week and all-time highs and no resistance remains due to overhead supply. Due to report Jun '17 quarterly earnings on Tuesday, 8/08/17 after the close. Volume and volatility often increase near earnings news. Its 50 DMA line ($31.82) and prior lows in the $26.50 - $27.00 area define near-term support. Bullish action continued after sub par Mar '17 earnings were repeatedly noted.
>>> FEATURED STOCK ARTICLE : New Highs on Twice Average Volume; Fundamental Concerns Remain - 7/14/2017 |
View all notes |
Set NEW NOTE alert |
Company Profile |
SEC
News |
Chart |
Request a new note
C
A
S
I |
ESNT
-
NYSE
Essent Group Ltd
Finance-MrtgandRel Svc
|
$40.66
|
+0.64
1.60% |
$41.44
|
1,359,832
314.05% of 50 DAV
50 DAV is 433,000
|
$40.12
1.35%
|
7/3/2017
|
$38.05
|
PP = $39.60
|
|
MB = $41.58
|
Most Recent Note - 8/7/2017 12:12:46 PM
Y - Hitting another new all-time high with above average volume behind today's 2nd consecutive gain. Prior session's gain above the pivot point backed by +227% above average volume triggered a new (or add-on) technical buy signal. Losses below the 50 DMA line ($37.51) and prior low ($34.08 on 5/05/17) would raise concerns and trigger technical sell signals. Reported Jun '17 quarterly earnings +35% on +27% sales revenues, continuing its strong earnings track record.
>>> FEATURED STOCK ARTICLE : Perched Within Close Striking Distance of a New High - 8/1/2017 |
View all notes |
Set NEW NOTE alert |
Company Profile |
SEC
News |
Chart |
Request a new note
C
A
S
I |
VEEV
-
NYSE
Veeva Systems Inc Cl A
Computer Sftwr-Medical
|
$63.18
|
+1.06
1.71% |
$63.32
|
855,534
49.83% of 50 DAV
50 DAV is 1,717,000
|
$68.07
-7.18%
|
7/24/2017
|
$65.91
|
PP = $68.17
|
|
MB = $71.58
|
Most Recent Note - 8/7/2017 5:13:26 PM
G - Quiet gain today finishing above its 50 DMA line ($62.92), but it faces resistance due to overhead supply up through the $$68 level. More damaging losses would raise greater concerns. Disciplined investors will note that it did not produce the necessary volume-driven gains for a new 52-week high needed to trigger a new (or add-on) technical buy signal.
>>> FEATURED STOCK ARTICLE : Slump Below 50-Day Moving Average Line Raises Concerns - 8/2/2017 |
View all notes |
Set NEW NOTE alert |
Company Profile |
SEC
News |
Chart |
Request a new note
C
A
S
I |
ANET
-
NYSE
Arista Networks Inc
TELECOMMUNICATIONS - Communication Equipment
|
$173.75
|
+1.70
0.99% |
$176.50
|
1,617,092
181.90% of 50 DAV
50 DAV is 889,000
|
$175.40
-0.94%
|
8/4/2017
|
$173.31
|
PP = $163.07
|
|
MB = $171.22
|
Most Recent Note - 8/7/2017 12:09:42 PM
G - Color code is changed to green after rallying above its "max buy" level. Cleared a new pivot point cited based on its 6/23/17 high plus 10 cents with a big "breakaway gap" on the prior session triggering a technical buy signal. Reported Jun '17 quarterly earnings +81% on +51% sales revenues, continuing its strong earnings history.
>>> FEATURED STOCK ARTICLE : Networking Firm Consolidating Above 50-Day Moving Average Line - 7/18/2017 |
View all notes |
Set NEW NOTE alert |
Company Profile |
SEC
News |
Chart |
Request a new note
C
A
S
I |
GRUB
-
NYSE
Grubhub Inc
COMPUTER SOFTWARE and SERVICES - Technical and System Software
|
$56.96
|
+4.34
8.25% |
$57.26
|
5,595,084
278.64% of 50 DAV
50 DAV is 2,008,000
|
$53.36
6.75%
|
6/21/2017
|
$47.33
|
PP = $46.94
|
|
MB = $49.29
|
Most Recent Note - 8/7/2017 12:15:18 PM
G - Spiking to new 52-week and all-time highs with today's 3rd big gain. Color code was changed to green after rallying above its "max buy" level. Reported earnings +13% on +32% sales revenues for the Jun '17 quarter, below the +25% minimum earnings guideline (C criteria) raising fundamental concerns.
>>> FEATURED STOCK ARTICLE : Found Prompt Support at 50-Day Moving Average - 6/30/2017 |
View all notes |
Set NEW NOTE alert |
Company Profile |
SEC
News |
Chart |
Request a new note
C
A
S
I |
Symbol/Exchange
Company Name
Industry Group |
PRICE |
CHANGE
(%Change) |
Day High |
Volume
(% DAV)
(% 50 day avg vol) |
52 Wk Hi
% From Hi |
Featured
Date |
Price
Featured |
Pivot Featured |
|
Max Buy |
IBP
-
NYSE
Installed Building Prod
DIVERSIFIED SERVICES - Business/Management Services
|
$57.45
|
-1.25
-2.13% |
$59.53
|
142,916
109.94% of 50 DAV
50 DAV is 130,000
|
$60.00
-4.25%
|
6/13/2017
|
$54.25
|
PP = $55.55
|
|
MB = $58.33
|
Most Recent Note - 8/4/2017 12:23:09 PM
Y - Hitting a new all-time high with today's big volume-driven gain, triggering a technical buy signal while quickly rallying well above the pivot point and also above its "max buy" level. Reported earnings +48% on +33% sales revenues for the Jun '17 quarter.
>>> FEATURED STOCK ARTICLE : Volume Cooling While Staying Above 50-Day Moving Average Line - 7/17/2017 |
View all notes |
Set NEW NOTE alert |
Company Profile |
SEC
News |
Chart |
Request a new note
C
A
S
I |
NCOM
-
NASDAQ
National Commerce Corp
BANKING - Regional - Southeast Banks
|
$39.90
|
-0.05
-0.13% |
$40.00
|
18,899
60.96% of 50 DAV
50 DAV is 31,000
|
$41.25
-3.27%
|
4/25/2017
|
$38.95
|
PP = $40.09
|
|
MB = $42.09
|
Most Recent Note - 8/4/2017 5:33:26 PM
Y - Consolidating above support at its 50 DMA line ($39.30). Subsequent damaging losses violating it or the recent lows would trigger technical sell signals. Reported Jun '17 earnings +23% on +45% sales revenues, below the +25% minimum earnings guideline (C criteria), raising fundamental concerns.
>>> FEATURED STOCK ARTICLE : Recent Breakout Lacked Great Volume Conviction - 7/10/2017 |
View all notes |
Set NEW NOTE alert |
Company Profile |
SEC
News |
Chart |
Request a new note
C
A
S
I |
HQY
-
NASDAQ
Healthequity Inc
COMPUTER SOFTWARE and SERVICES - Healthcare Information Service
|
$48.17
|
+1.40
2.99% |
$48.28
|
290,311
54.67% of 50 DAV
50 DAV is 531,000
|
$54.95
-12.34%
|
6/7/2017
|
$50.01
|
PP = $49.35
|
|
MB = $51.82
|
Most Recent Note - 8/4/2017 5:35:15 PM
G - Still sputtering well below its 50 DMA line ($49.35). A rebound above the 50 DMA line is needed for its outlook to improve. Faces some resistance due to overhead supply up through the $54 level.
>>> FEATURED STOCK ARTICLE : 50-Day Moving Average Violation Triggers Technical Sell Signal - 7/19/2017 |
View all notes |
Set NEW NOTE alert |
Company Profile |
SEC
News |
Chart |
Request a new note
C
A
S
I |
OLLI
-
NASDAQ
Ollie's Bargain Outlet
Retail-DiscountandVariety
|
$45.05
|
-0.30
-0.66% |
$45.90
|
753,896
103.70% of 50 DAV
50 DAV is 727,000
|
$46.08
-2.22%
|
7/17/2017
|
$43.96
|
PP = $44.18
|
|
MB = $46.39
|
Most Recent Note - 8/7/2017 5:05:31 PM
Y - Encountered distributional pressure today while perched near its 52-week high. Subsequent gains and a strong close above the pivot point backed by at least +40% above average volume may trigger a new (or add-on) technical buy signal. Its 50 DMA line ($42.59) defines support above recent lows in the $37-38 area.
>>> FEATURED STOCK ARTICLE : Recently Found Support Near 50-Day Moving Average - 6/29/2017 |
View all notes |
Set NEW NOTE alert |
Company Profile |
SEC
News |
Chart |
Request a new note
C
A
S
I |
LITE
-
NASDAQ
Lumentum Holdings Inc
TELECOMMUNICATIONS - Cables / Satalite Equipment
|
$58.75
|
-0.10
-0.17% |
$60.65
|
1,983,290
115.71% of 50 DAV
50 DAV is 1,714,000
|
$68.63
-14.40%
|
7/13/2017
|
$64.15
|
PP = $67.40
|
|
MB = $70.77
|
Most Recent Note - 8/4/2017 12:31:32 PM
G - Color code was changed to green while slumping below its 50 DMA line ($61.33). Only a prompt rebound above the 50 DMA line would help its outlook improve. Disciplined investors always limit losses by selling any stock that falls more than -7% from their purchase price. The prior low ($56.20 on 6/29/17) defines the next important support to watch. Due to report Jun '17 quarterly earnings before the open on Wednesday, 8/09/17.
>>> FEATURED STOCK ARTICLE : High Ranked Telecom - Fiber Optics Firm - 7/13/2017 |
View all notes |
Set NEW NOTE alert |
Company Profile |
SEC
News |
Chart |
Request a new note
C
A
S
I |
Symbol/Exchange
Company Name
Industry Group |
PRICE |
CHANGE
(%Change) |
Day High |
Volume
(% DAV)
(% 50 day avg vol) |
52 Wk Hi
% From Hi |
Featured
Date |
Price
Featured |
Pivot Featured |
|
Max Buy |
MOMO
-
NASDAQ
Momo Inc Ads Cl A
INTERNET - Content
|
$45.99
|
+1.94
4.40% |
$46.18
|
4,366,960
78.18% of 50 DAV
50 DAV is 5,586,000
|
$46.33
-0.73%
|
7/25/2017
|
$44.05
|
PP = $46.05
|
|
MB = $48.35
|
Most Recent Note - 8/7/2017 5:08:49 PM
Y - Quietly rose with below average volume to a best-ever close today. Perched within close striking distance of the new pivot point cited based in 5/22/17 high plus 10 cents. Subsequent volume-driven gains for new highs may trigger a new (or add-on) technical buy signal. Consolidating above its 50 DMA line, building on a third-stage base. Prior low ($35.02 on 6/15/17) defines the next important chart support level where a violation would raise more serious concerns.
>>> FEATURED STOCK ARTICLE : Perched Within Striking Distance of Prior High - 7/25/2017 |
View all notes |
Set NEW NOTE alert |
Company Profile |
SEC
News |
Chart |
Request a new note
C
A
S
I |
HLI
-
NYSE
Houlihan Lokey Inc Cl A
Finance-Invest Bnk/Bkrs
|
$36.05
|
-0.34
-0.93% |
$36.51
|
100,764
55.98% of 50 DAV
50 DAV is 180,000
|
$39.68
-9.15%
|
5/10/2017
|
$35.85
|
PP = $35.05
|
|
MB = $36.80
|
Most Recent Note - 8/2/2017 6:00:57 PM
G - Retreating further from its all-time high with a loss today on lighter than average volume. Prior highs in the $35-36 area and its 50 DMA line define near-term support to watch.
>>> FEATURED STOCK ARTICLE : Extended Leader Encounters Distributional Pressure - 7/27/2017 |
View all notes |
Set NEW NOTE alert |
Company Profile |
SEC
News |
Chart |
Request a new note
C
A
S
I |