***Last / Change / Volume data in this table is the closing quote data***
Symbol/Exchange
Company Name
Industry Group |
PRICE |
CHANGE
(%Change) |
Day High |
Volume
(% DAV)
(% 50 day avg vol) |
52 Wk Hi
% From Hi |
Featured
Date |
Price
Featured |
Pivot Featured |
|
Max Buy |
THO
-
NYSE
Thor Industries Inc
AUTOMOTIVE - Recreational Vehicles
|
$105.39
|
-1.20
-1.13% |
$106.50
|
366,311
47.14% of 50 DAV
50 DAV is 777,000
|
$115.74
-8.94%
|
6/7/2017
|
$102.95
|
PP = $98.92
|
|
MB = $103.87
|
Most Recent Note - 7/27/2017 6:30:19 PM
G - Made little headway but holding its ground above its 50 DMA line following its prior breakout from a "double bottom" base. As previously noted - "Faces some resistance due to overhead supply up through the $115 level."
>>> FEATURED STOCK ARTICLE : Still Faces Some Resistance Due to Overhead Supply - 7/20/2017 |
View all notes |
Set NEW NOTE alert |
Company Profile |
SEC
News |
Chart |
Request a new note
C
A
S
I |
SBCF
-
NASDAQ
Seacoast Banking Corp Fl
BANKING - Regional - Mid-Atlantic Banks
|
$23.55
|
-0.81
-3.33% |
$24.50
|
452,942
162.93% of 50 DAV
50 DAV is 278,000
|
$25.88
-9.00%
|
6/9/2017
|
$24.13
|
PP = $25.98
|
|
MB = $27.28
|
 Most Recent Note - 7/28/2017 3:59:34 PM
G - Slumping below its 50 DMA line ($23.79) with a volume-drive loss after reporting earnings +21% on +27% sales revenues for the Jun '17 quarter, below the +25% minimum earnings guideline (C criteria). Color code is changed to green. Subsequent losses below the recent low ($23.03) would trigger a more worrisome technical sell signal.
>>> FEATURED STOCK ARTICLE : Florida Bank Perched -6.6% Off All-Time High - 7/6/2017 |
View all notes |
Set NEW NOTE alert |
Company Profile |
SEC
News |
Chart |
Request a new note
C
A
S
I |
BERY
-
NYSE
Berry Global Group Inc
CONSUMER NON-DURABLES - Packaging and Containers
|
$56.03
|
-0.73
-1.29% |
$56.98
|
516,226
58.66% of 50 DAV
50 DAV is 880,000
|
$58.95
-4.95%
|
7/14/2017
|
$57.67
|
PP = $59.05
|
|
MB = $62.00
|
Most Recent Note - 7/27/2017 6:23:40 PM
G - Color code is changed to green while sputtering below its 50 DMA line ($57.53). A rebound above the 50 DMA line and subsequent volume-driven gains above the pivot point are needed for its outlook to improve and for a new (or add-on) technical buy signal to be triggered. More damaging losses below the recent low ($56.14 on 7/06/17) would raise greater concerns and trigger a worrisome technical sell signal.
>>> FEATURED STOCK ARTICLE : Found Prompt Support at 50-Day Moving Average Line - 7/7/2017 |
View all notes |
Set NEW NOTE alert |
Company Profile |
SEC
News |
Chart |
Request a new note
C
A
S
I |
EW
-
NYSE
Edwards Lifesciences Cp
HEALTH SERVICES - Medical Appliances and Equipment
|
$115.51
|
-0.85
-0.73% |
$116.19
|
2,179,001
185.34% of 50 DAV
50 DAV is 1,175,700
|
$121.75
-5.13%
|
7/11/2017
|
$117.23
|
PP = $121.85
|
|
MB = $127.94
|
Most Recent Note - 7/27/2017 1:20:48 PM
Y - Off earlier highs after gapping up today and rebounding above its 50 DMA line ($116.62). Reported Jun '17 quarterly earnings +42% on +11% sales revenues, continuing its strong earnings track record. Subsequent volume-driven gains for new highs may trigger a new (or add-on) technical buy signal which could mark the beginning of a new leg up.
>>> FEATURED STOCK ARTICLE : Medical Products Firm Perched Near All-Time High - 6/26/2017 |
View all notes |
Set NEW NOTE alert |
Company Profile |
SEC
News |
Chart |
Request a new note
C
A
S
I |
NTES
-
NASDAQ
Netease Inc Adr
INTERNET - Internet Information Providers
|
$313.79
|
+3.65
1.18% |
$316.25
|
764,542
61.26% of 50 DAV
50 DAV is 1,248,000
|
$337.55
-7.04%
|
6/8/2017
|
$310.76
|
PP = $307.62
|
|
MB = $323.00
|
Most Recent Note - 7/27/2017 6:36:47 PM
Y - Churned higher volume today while consolidating just above its 50 DMA line ($303). Disciplined investors limit losses by selling any stock that falls more than -7% from their purchase price. Recent gains lacked great volume conviction.
>>> FEATURED STOCK ARTICLE : Found Recent Support at 50-Day Moving Average Line - 7/21/2017 |
View all notes |
Set NEW NOTE alert |
Company Profile |
SEC
News |
Chart |
Request a new note
C
A
S
I |
Symbol/Exchange
Company Name
Industry Group |
PRICE |
CHANGE
(%Change) |
Day High |
Volume
(% DAV)
(% 50 day avg vol) |
52 Wk Hi
% From Hi |
Featured
Date |
Price
Featured |
Pivot Featured |
|
Max Buy |
STMP
-
NASDAQ
Stamps.com Inc
INTERNET - Internet Software and Services
|
$148.90
|
+0.10
0.07% |
$149.90
|
206,710
44.36% of 50 DAV
50 DAV is 466,000
|
$158.75
-6.20%
|
5/24/2017
|
$133.10
|
PP = $136.10
|
|
MB = $142.91
|
Most Recent Note - 7/27/2017 6:42:31 PM
G - Pulled back today on higher (near average) volume. It did not form a sound base. Its 50 DMA line ($143.39) defines near-term support above prior lows in the $140-141 area.
>>> FEATURED STOCK ARTICLE : Pulling Back After Getting Extended From Prior Base - 7/5/2017 |
View all notes |
Set NEW NOTE alert |
Company Profile |
SEC
News |
Chart |
Request a new note
C
A
S
I |
MELI
-
NASDAQ
Mercadolibre Inc
INTERNET - Internet Software and; Services
|
$288.87
|
+2.23
0.78% |
$290.79
|
742,251
109.15% of 50 DAV
50 DAV is 680,000
|
$297.95
-3.05%
|
6/15/2017
|
$261.73
|
PP = $297.95
|
|
MB = $312.85
|
Most Recent Note - 7/26/2017 5:27:57 PM
G - Finished near the session high with a gain on higher (near average) volume today while consolidating above its 50 DMA line ($273). Faces little resistance due to overhead supply up to the $298 level. See the latest FSU analysis for more details and a new annotated graph.
>>> FEATURED STOCK ARTICLE : Little Resistance Remains While Rebounding Near Prior Highs - 7/26/2017 |
View all notes |
Set NEW NOTE alert |
Company Profile |
SEC
News |
Chart |
Request a new note
C
A
S
I |
HTHT
-
NASDAQ
China Lodging Group Ads
LEISURE - Lodging
|
$95.17
|
+2.08
2.23% |
$95.42
|
166,140
71.92% of 50 DAV
50 DAV is 231,000
|
$97.44
-2.33%
|
9/29/2016
|
$46.12
|
PP = $47.82
|
|
MB = $50.21
|
Most Recent Note - 7/24/2017 11:52:23 AM
G - Rallying into new all-time high territory with today's early gain. Its 50 DMA line ($80.97) defines near-term support above the prior low ($75.01 on 6/15/17). Sub par sales revenues growth was recently noted among concerns, however, earnings increases through the Mar '17 quarter have been strong versus the year-ago periods.
>>> FEATURED STOCK ARTICLE : China-Based Hotel Firm is Extended From Any Sound Base - 6/28/2017 |
View all notes |
Set NEW NOTE alert |
Company Profile |
SEC
News |
Chart |
Request a new note
C
A
S
I |
LMAT
-
NASDAQ
Lemaitre Vascular Inc
Medical-Products
|
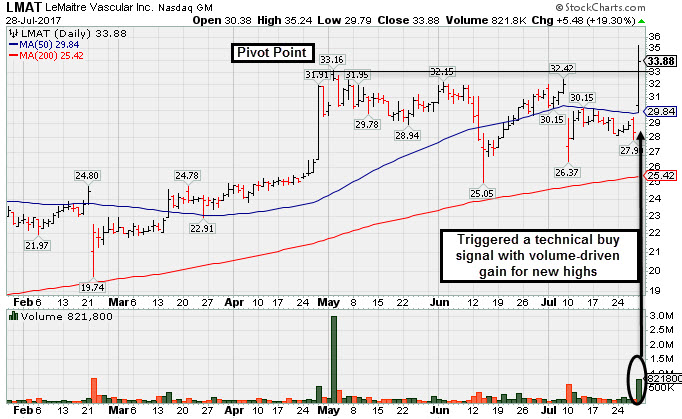
$33.94
|
+5.54
19.51% |
$35.24
|
858,914
561.38% of 50 DAV
50 DAV is 153,000
|
$33.22
2.18%
|
7/28/2017
|
$33.50
|
PP = $33.32
|
|
MB = $34.99
|
Most Recent Note - 7/28/2017 4:36:37 PM
Y - Finished strong after highlighted in yellow with new pivot point cited based on its 5/02/17 high plus 10 cents in the earlier mid-day report. Triggered a technical buy signal and powered to a new all-time high after gapping up for a big volume-driven gain. Reported earnings +64% on +15% sales revenues for the Jun '17 quarter, Three of the past four quarterly comparisons were above the +25% minimum guideline (C criteria). See the latest FSU analysis for more details and a new annotated graph.
>>> FEATURED STOCK ARTICLE : Big Volume-Driven Gain Following Strong Earnings News - 7/28/2017 |
View all notes |
Set NEW NOTE alert |
Company Profile |
SEC
News |
Chart |
Request a new note
C
A
S
I |
BEAT
-
NASDAQ
BioTelemetry Inc
Medical-Services
|
$34.80
|
+0.65
1.90% |
$34.80
|
282,638
63.09% of 50 DAV
50 DAV is 448,000
|
$35.75
-2.66%
|
2/14/2017
|
$25.10
|
PP = $24.55
|
|
MB = $25.78
|
Most Recent Note - 7/25/2017 12:14:48 PM
G - Perched near its all-time high, encountering mild distributional pressure. Due to report Jun '17 quarterly earnings on 7/31/17. Volume and volatility often increase near earnings news. Its 50 DMA line ($30.71) and prior lows in the $26.50 - $27.00 area define near-term support. Bullish action continued after sub par Mar '17 earnings were repeatedly noted.
>>> FEATURED STOCK ARTICLE : New Highs on Twice Average Volume; Fundamental Concerns Remain - 7/14/2017 |
View all notes |
Set NEW NOTE alert |
Company Profile |
SEC
News |
Chart |
Request a new note
C
A
S
I |
Symbol/Exchange
Company Name
Industry Group |
PRICE |
CHANGE
(%Change) |
Day High |
Volume
(% DAV)
(% 50 day avg vol) |
52 Wk Hi
% From Hi |
Featured
Date |
Price
Featured |
Pivot Featured |
|
Max Buy |
ESNT
-
NYSE
Essent Group Ltd
Finance-MrtgandRel Svc
|
$37.73
|
-0.05
-0.13% |
$37.88
|
231,641
54.50% of 50 DAV
50 DAV is 425,000
|
$39.61
-4.75%
|
7/3/2017
|
$38.05
|
PP = $39.60
|
|
MB = $41.58
|
Most Recent Note - 7/27/2017 6:25:26 PM
Y - Encountering mild distributional pressure while consolidating within striking distance of its all-time high. Subsequent gains above the pivot point backed by at least +40% above average volume may trigger a new (or add-on) technical buy signal. Losses below the 50 DMA line ($37.14) and prior low ($34.08 on 5/05/17) would raise concerns and trigger technical sell signals.
>>> FEATURED STOCK ARTICLE : Sputtering Below its 50-Day Moving Average - 6/20/2017 |
View all notes |
Set NEW NOTE alert |
Company Profile |
SEC
News |
Chart |
Request a new note
C
A
S
I |
MTSI
-
NASDAQ
Macom Tech Solution Hldg
Elec-Semiconductor Mfg
|
$60.89
|
+0.12
0.20% |
$61.12
|
483,522
58.75% of 50 DAV
50 DAV is 823,000
|
$65.99
-7.73%
|
5/16/2017
|
$52.52
|
PP = $53.89
|
|
MB = $56.58
|
Most Recent Note - 7/27/2017 6:39:29 PM
G - Encountered distributional pressure this afternoon and abruptly retreated from all-time high with a big loss on heavy volume. Did not form a sound base. Found support near its 50 DMA line ($58.72) during its prior consolidation.
>>> FEATURED STOCK ARTICLE : Meeting Resistance Near Prior High - 6/27/2017 |
View all notes |
Set NEW NOTE alert |
Company Profile |
SEC
News |
Chart |
Request a new note
C
A
S
I |
VEEV
-
NYSE
Veeva Systems Inc Cl A
Computer Sftwr-Medical
|
$63.63
|
+1.14
1.82% |
$64.24
|
1,029,274
56.24% of 50 DAV
50 DAV is 1,830,000
|
$68.07
-6.52%
|
7/24/2017
|
$65.91
|
PP = $68.17
|
|
MB = $71.58
|
Most Recent Note - 7/28/2017 4:04:46 PM
Y - Finding prompt support after undercutting its 50 DMA line ($62.67) on the prior session. More damaging losses would raise greater concerns. Disciplined investors will note that it did not produce the necessary volume-driven gains for a new 52-week high needed to trigger a new (or add-on) technical buy signal.
>>> FEATURED STOCK ARTICLE : Rebounding Since Testing Support at 50-Day Moving Average Line - 6/23/2017 |
View all notes |
Set NEW NOTE alert |
Company Profile |
SEC
News |
Chart |
Request a new note
C
A
S
I |
ANET
-
NYSE
Arista Networks Inc
TELECOMMUNICATIONS - Communication Equipment
|
$150.40
|
-1.64
-1.08% |
$153.57
|
988,706
128.91% of 50 DAV
50 DAV is 767,000
|
$162.97
-7.71%
|
4/17/2017
|
$132.75
|
PP = $135.27
|
|
MB = $142.03
|
Most Recent Note - 7/27/2017 6:35:05 PM
G - Tested its 50 DMA line ($151.85) with today's loss on higher volume. Prior lows in the $144-143 area define the next important support to watch. It is extended from any sound base.
>>> FEATURED STOCK ARTICLE : Networking Firm Consolidating Above 50-Day Moving Average Line - 7/18/2017 |
View all notes |
Set NEW NOTE alert |
Company Profile |
SEC
News |
Chart |
Request a new note
C
A
S
I |
GRUB
-
NYSE
GrubHub Inc
COMPUTER SOFTWARE and SERVICES - Technical and System Software
|
$46.64
|
-0.35
-0.74% |
$47.35
|
988,761
53.00% of 50 DAV
50 DAV is 1,865,700
|
$48.16
-3.16%
|
6/21/2017
|
$47.33
|
PP = $46.94
|
|
MB = $49.29
|
Most Recent Note - 7/25/2017 3:19:53 PM
Y - Quietly perched within striking distance of its 52-week and all-time highs. Volume totals still have been cooling while stubbornly holding its ground since gapping up above its 50 DMA line on 7/12/17. Endured distributional pressure recently after it briefly rose above the new pivot point cited based on its 5/08/17 high plus 10 cents. Members were previously reminded - "A confirming gain backed by at least +40% above average volume and strong close above the pivot point may clinch a technical buy signal."
>>> FEATURED STOCK ARTICLE : Found Prompt Support at 50-Day Moving Average - 6/30/2017 |
View all notes |
Set NEW NOTE alert |
Company Profile |
SEC
News |
Chart |
Request a new note
C
A
S
I |
Symbol/Exchange
Company Name
Industry Group |
PRICE |
CHANGE
(%Change) |
Day High |
Volume
(% DAV)
(% 50 day avg vol) |
52 Wk Hi
% From Hi |
Featured
Date |
Price
Featured |
Pivot Featured |
|
Max Buy |
IBP
-
NYSE
Installed Building Prod
DIVERSIFIED SERVICES - Business/Management Services
|
$52.90
|
+0.60
1.15% |
$52.90
|
63,751
48.66% of 50 DAV
50 DAV is 131,000
|
$55.45
-4.60%
|
6/13/2017
|
$54.25
|
PP = $55.55
|
|
MB = $58.33
|
Most Recent Note - 7/24/2017 12:08:38 PM
Y - Consolidating in a tight range near its 50 DMA line ($51.44). Volume-driven gains above the pivot point are still needed to trigger a proper new technical buy signal.
>>> FEATURED STOCK ARTICLE : Volume Cooling While Staying Above 50-Day Moving Average Line - 7/17/2017 |
View all notes |
Set NEW NOTE alert |
Company Profile |
SEC
News |
Chart |
Request a new note
C
A
S
I |
NCOM
-
NASDAQ
National Commerce Corp
BANKING - Regional - Southeast Banks
|
$39.80
|
-0.10
-0.25% |
$40.00
|
22,764
71.14% of 50 DAV
50 DAV is 32,000
|
$41.25
-3.52%
|
4/25/2017
|
$38.95
|
PP = $40.09
|
|
MB = $42.09
|
Most Recent Note - 7/24/2017 2:46:56 PM
Y - Due to report Jun '17 earnings news after the market closes on Tuesday, July 25, 2017, and volume and volatility often increase near earnings news. Found support at its 50 DMA line ($38.90) recently and any damaging losses violating it or the recent lows would trigger technical sell signals.
>>> FEATURED STOCK ARTICLE : Recent Breakout Lacked Great Volume Conviction - 7/10/2017 |
View all notes |
Set NEW NOTE alert |
Company Profile |
SEC
News |
Chart |
Request a new note
C
A
S
I |
INGN
-
NASDAQ
Inogen Inc
HEALTH SERVICES - Medical Instruments and Supplies
|
$93.97
|
-0.30
-0.32% |
$95.19
|
177,234
100.70% of 50 DAV
50 DAV is 176,000
|
$97.71
-3.83%
|
7/12/2017
|
$94.95
|
PP = $97.81
|
|
MB = $102.70
|
Most Recent Note - 7/24/2017 2:56:10 PM
Y - Color code was changed to yellow with new pivot point cited based on its 6/22/17 high as it formed an advanced "3-weeks tight" base. Subsequent volume-driven gains for new highs may trigger a new (or add-on) technical buy signal. Near-term support is its 50 DMA line ($91.35).
>>> FEATURED STOCK ARTICLE : In Tight Range Near All-Time High With Volume Totals Cooling - 7/12/2017 |
View all notes |
Set NEW NOTE alert |
Company Profile |
SEC
News |
Chart |
Request a new note
C
A
S
I |
HQY
-
NASDAQ
Healthequity Inc
COMPUTER SOFTWARE and SERVICES - Healthcare Information Service
|
$47.26
|
-0.63
-1.32% |
$47.85
|
398,918
76.42% of 50 DAV
50 DAV is 522,000
|
$54.95
-13.99%
|
6/7/2017
|
$50.01
|
PP = $49.35
|
|
MB = $51.82
|
Most Recent Note - 7/25/2017 3:31:19 PM
Y - Color code is changed to yellow after rebounding above its 50 DMA line ($49.02) helping its outlook improve. Faces some resistance due to overhead supply up through the $54 level.
>>> FEATURED STOCK ARTICLE : 50-Day Moving Average Violation Triggers Technical Sell Signal - 7/19/2017 |
View all notes |
Set NEW NOTE alert |
Company Profile |
SEC
News |
Chart |
Request a new note
C
A
S
I |
PLAY
-
NASDAQ
Dave & Buster's Ent Inc
Retail-Restaurants
|
$61.21
|
-1.67
-2.66% |
$62.50
|
914,082
129.11% of 50 DAV
50 DAV is 708,000
|
$73.48
-16.70%
|
2/23/2017
|
$55.41
|
PP = $58.35
|
|
MB = $61.27
|
Most Recent Note - 7/28/2017 3:59:12 PM
Slumping further below its 50-day moving average (DMA) line today after triggering technical sell signals. It will be dropped from the Featured Stocks list tonight.
>>> FEATURED STOCK ARTICLE : Faces Near-Term Resistance Up to $73 Due to Overhead Supply - 7/24/2017 |
View all notes |
Set NEW NOTE alert |
Company Profile |
SEC
News |
Chart |
Request a new note
C
A
S
I |
Symbol/Exchange
Company Name
Industry Group |
PRICE |
CHANGE
(%Change) |
Day High |
Volume
(% DAV)
(% 50 day avg vol) |
52 Wk Hi
% From Hi |
Featured
Date |
Price
Featured |
Pivot Featured |
|
Max Buy |
OLLI
-
NASDAQ
Ollie's Bargain Outlet
Retail-DiscountandVariety
|
$45.40
|
+0.60
1.34% |
$45.55
|
379,757
51.39% of 50 DAV
50 DAV is 739,000
|
$45.00
0.89%
|
7/17/2017
|
$43.96
|
PP = $44.18
|
|
MB = $46.39
|
Most Recent Note - 7/25/2017 3:29:04 PM
Y - Perched at its 52-week high after gains with light volume. Subsequent gains and a strong close above the pivot point backed by at least +40% above average volume may trigger a new (or add-on) technical buy signal. Its 50 DMA line ($41.76) defines support above recent lows in the $37-38 area.
>>> FEATURED STOCK ARTICLE : Recently Found Support Near 50-Day Moving Average - 6/29/2017 |
View all notes |
Set NEW NOTE alert |
Company Profile |
SEC
News |
Chart |
Request a new note
C
A
S
I |
LITE
-
NASDAQ
Lumentum Holdings Inc
TELECOMMUNICATIONS - Cables / Satalite Equipment
|
$61.90
|
+0.00
0.00% |
$63.00
|
997,696
58.52% of 50 DAV
50 DAV is 1,705,000
|
$68.63
-9.81%
|
7/13/2017
|
$64.15
|
PP = $67.40
|
|
MB = $70.77
|
Most Recent Note - 7/27/2017 6:47:01 PM
Y - Pulled back on even higher volume today raising concerns while slumping back into the prior base and testing its 50 DMA line ($60.15). Disciplined investors always limit losses by selling any stock that falls more than -7% from their purchase price. More damaging losses would raise concerns and the prior low ($56.20 on 6/29/17) defines the next important support to watch.
>>> FEATURED STOCK ARTICLE : High Ranked Telecom - Fiber Optics Firm - 7/13/2017 |
View all notes |
Set NEW NOTE alert |
Company Profile |
SEC
News |
Chart |
Request a new note
C
A
S
I |
MOMO
-
NASDAQ
Momo Inc Ads Cl A
INTERNET - Content
|
$44.06
|
+0.87
2.01% |
$44.59
|
2,640,695
38.71% of 50 DAV
50 DAV is 6,822,000
|
$45.95
-4.11%
|
7/25/2017
|
$44.05
|
PP = $46.05
|
|
MB = $48.35
|
Most Recent Note - 7/28/2017 4:02:45 PM
Y - Perched within close striking distance of the new pivot point cited based in 5/22/17 high plus 10 cents. Subsequent volume-driven gains for new highs may trigger a new (or add-on) technical buy signal. Consolidating above its 50 DMA line, building on a third-stage base. Prior low ($35.02 on 6/15/17) defines the next important chart support level where a violation would raise more serious concerns. See the latest FSU analysis for more details and a new annotated graph.
>>> FEATURED STOCK ARTICLE : Perched Within Striking Distance of Prior High - 7/25/2017 |
View all notes |
Set NEW NOTE alert |
Company Profile |
SEC
News |
Chart |
Request a new note
C
A
S
I |
HLI
-
NYSE
Houlihan Lokey Inc Cl A
Finance-Invest Bnk/Bkrs
|
$37.14
|
-0.54
-1.43% |
$38.04
|
173,215
96.23% of 50 DAV
50 DAV is 180,000
|
$39.68
-6.40%
|
5/10/2017
|
$35.85
|
PP = $35.05
|
|
MB = $36.80
|
Most Recent Note - 7/27/2017 6:33:11 PM
G - Encountered distributional pressure today, retreating from its all-time high with a big volume-driven loss. Extended from prior highs in the $35-36 area and its 50 DMA line which define support to watch on pullbacks. See the latest FSU analysis for more details and a new annotated graph.
>>> FEATURED STOCK ARTICLE : Extended Leader Encounters Distributional Pressure - 7/27/2017 |
View all notes |
Set NEW NOTE alert |
Company Profile |
SEC
News |
Chart |
Request a new note
C
A
S
I |