***Last / Change / Volume data in this table is the closing quote data***
Symbol/Exchange
Company Name
Industry Group |
PRICE |
CHANGE
(%Change) |
Day High |
Volume
(% DAV)
(% 50 day avg vol) |
52 Wk Hi
% From Hi |
Featured
Date |
Price
Featured |
Pivot Featured |
|
Max Buy |
THO
-
NYSE
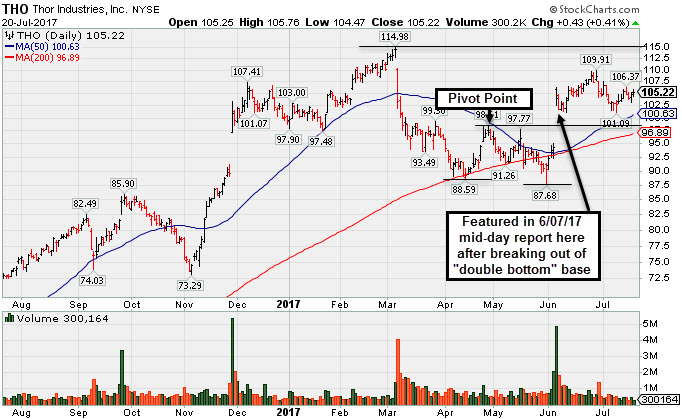
Thor Industries Inc
AUTOMOTIVE - Recreational Vehicles
|
$105.22
|
+0.43
0.41% |
$105.76
|
300,164
37.01% of 50 DAV
50 DAV is 811,000
|
$115.74
-9.09%
|
6/7/2017
|
$102.95
|
PP = $98.92
|
|
MB = $103.87
|
 Most Recent Note - 7/20/2017 5:24:55 PM
G - Consolidating above its "max buy" level following its prior breakout from a"double bottom" base. Faces some resistance due to overhead supply up through the $115 level. See the latest FSU analysis for more details and a new annotated graph.
>>> FEATURED STOCK ARTICLE : Still Faces Some Resistance Due to Overhead Supply - 7/20/2017 |
View all notes |
Set NEW NOTE alert |
Company Profile |
SEC
News |
Chart |
Request a new note
C
A
S
I |
SBCF
-
NASDAQ
Seacoast Banking Corp Fl
BANKING - Regional - Mid-Atlantic Banks
|
$23.63
|
-0.02
-0.08% |
$23.85
|
72,947
24.98% of 50 DAV
50 DAV is 292,000
|
$25.88
-8.69%
|
6/9/2017
|
$24.13
|
PP = $25.98
|
|
MB = $27.28
|
Most Recent Note - 7/20/2017 5:43:00 PM
Y - Still quietly consolidating near its 50 DMA line ($23.71). Subsequent losses below the recent low would trigger a more worrisome technical sell signal. Previously noted - "Subsequent volume-driven gains for new highs may trigger a new technical buy signal. "
>>> FEATURED STOCK ARTICLE : Florida Bank Perched -6.6% Off All-Time High - 7/6/2017 |
View all notes |
Set NEW NOTE alert |
Company Profile |
SEC
News |
Chart |
Request a new note
C
A
S
I |
BERY
-
NYSE
Berry Global Group Inc
CONSUMER NON-DURABLES - Packaging and Containers
|
$57.36
|
-0.83
-1.43% |
$58.26
|
769,444
82.82% of 50 DAV
50 DAV is 929,000
|
$58.95
-2.70%
|
7/14/2017
|
$57.67
|
PP = $59.05
|
|
MB = $62.00
|
Most Recent Note - 7/20/2017 5:30:08 PM
Y - Quietly fell today, slumping to a close just below its 50 DMA line ($57.48). Subsequent volume-driven gains above the pivot point may trigger a new (or add-on) technical buy signal. More damaging losses below the recent low ($56.14 on 7/06/17) would raise greater concerns and trigger a worrisome technical sell signal.
>>> FEATURED STOCK ARTICLE : Found Prompt Support at 50-Day Moving Average Line - 7/7/2017 |
View all notes |
Set NEW NOTE alert |
Company Profile |
SEC
News |
Chart |
Request a new note
C
A
S
I |
EW
-
NYSE
Edwards Lifesciences Cp
HEALTH SERVICES - Medical Appliances and Equipment
|
$119.42
|
+0.38
0.32% |
$120.00
|
1,580,893
140.56% of 50 DAV
50 DAV is 1,124,700
|
$121.75
-1.91%
|
7/11/2017
|
$117.23
|
PP = $121.85
|
|
MB = $127.94
|
Most Recent Note - 7/19/2017 6:30:45 PM
Y - Posted a big gain today with above average volume, rallying from support at its 50 DMA line ($115.91). Color code was changed to yellow with new pivot point based on its 10/10/16 all-time high plus 10 cents. Subsequent volume-driven gains for new highs may trigger a new (or add-on) technical buy signal which could mark the beginning of a considerable new leg up. Volume totals have been mostly below average in recent weeks while holding its ground in a tight range.
>>> FEATURED STOCK ARTICLE : Medical Products Firm Perched Near All-Time High - 6/26/2017 |
View all notes |
Set NEW NOTE alert |
Company Profile |
SEC
News |
Chart |
Request a new note
C
A
S
I |
NTES
-
NASDAQ
Netease Inc Adr
INTERNET - Internet Information Providers
|
$308.65
|
+1.69
0.55% |
$310.74
|
847,611
61.33% of 50 DAV
50 DAV is 1,382,000
|
$337.55
-8.56%
|
6/8/2017
|
$310.76
|
PP = $307.62
|
|
MB = $323.00
|
Most Recent Note - 7/17/2017 5:23:31 PM
Y - Fell near its 50 DMA line ($297.70) which recently acted as support. Disciplined investors limit losses by selling any stock that falls more than -7% from their purchase price. Recent gains lacked great volume conviction.
>>> FEATURED STOCK ARTICLE : Encountered Distributional Pressure After Hitting New Highs - 6/9/2017 |
View all notes |
Set NEW NOTE alert |
Company Profile |
SEC
News |
Chart |
Request a new note
C
A
S
I |
Symbol/Exchange
Company Name
Industry Group |
PRICE |
CHANGE
(%Change) |
Day High |
Volume
(% DAV)
(% 50 day avg vol) |
52 Wk Hi
% From Hi |
Featured
Date |
Price
Featured |
Pivot Featured |
|
Max Buy |
STMP
-
NASDAQ
Stamps.com Inc
INTERNET - Internet Software and Services
|
$149.35
|
+2.55
1.74% |
$149.65
|
179,468
33.17% of 50 DAV
50 DAV is 541,000
|
$156.40
-4.51%
|
5/24/2017
|
$133.10
|
PP = $136.10
|
|
MB = $142.91
|
Most Recent Note - 7/17/2017 5:25:14 PM
Y - Fell below its "max buy" level with today's big volume-driven loss and its color code is changed to yellow. Its prior high ($136 on 2/22/17) defines near term support along with its 50 DMA line ($137).
>>> FEATURED STOCK ARTICLE : Pulling Back After Getting Extended From Prior Base - 7/5/2017 |
View all notes |
Set NEW NOTE alert |
Company Profile |
SEC
News |
Chart |
Request a new note
C
A
S
I |
MELI
-
NASDAQ
Mercadolibre Inc
INTERNET - Internet Software and; Services
|
$282.08
|
+1.52
0.54% |
$284.01
|
491,132
72.33% of 50 DAV
50 DAV is 679,000
|
$297.95
-5.33%
|
6/15/2017
|
$261.73
|
PP = $297.95
|
|
MB = $312.85
|
Most Recent Note - 7/18/2017 4:14:48 PM
G - Recently rebounded above its 50 DMA line ($273) helping its outlook to improve. Faces resistance due to overhead supply up to the $298 level.
>>> FEATURED STOCK ARTICLE : Test of 10-Week Moving Average May Be a Secondary Buy Point - 6/15/2017 |
View all notes |
Set NEW NOTE alert |
Company Profile |
SEC
News |
Chart |
Request a new note
C
A
S
I |
HTHT
-
NASDAQ
China Lodging Group Ads
LEISURE - Lodging
|
$93.04
|
-1.29
-1.37% |
$95.20
|
317,728
123.15% of 50 DAV
50 DAV is 258,000
|
$94.48
-1.52%
|
9/29/2016
|
$46.12
|
PP = $47.82
|
|
MB = $50.21
|
Most Recent Note - 7/18/2017 12:20:18 PM
G - Rallying from a late-stage base and hitting another new all-time high with today's 3rd consecutive gain on ever increasing volume. Found prompt support at its 50 DMA line ($79.50) during its ongoing ascent. The prior low ($75.01 on 6/15/17) defines the next support level to watch. Sub par sales revenues growth was recently noted among concerns, however, earnings increases through the Mar '17 quarter have been strong versus the year-ago periods.
>>> FEATURED STOCK ARTICLE : China-Based Hotel Firm is Extended From Any Sound Base - 6/28/2017 |
View all notes |
Set NEW NOTE alert |
Company Profile |
SEC
News |
Chart |
Request a new note
C
A
S
I |
BEAT
-
NASDAQ
BioTelemetry Inc
Medical-Services
|
$35.00
|
-0.25
-0.71% |
$35.60
|
346,264
74.31% of 50 DAV
50 DAV is 466,000
|
$35.60
-1.69%
|
2/14/2017
|
$25.10
|
PP = $24.55
|
|
MB = $25.78
|
Most Recent Note - 7/17/2017 11:55:45 AM
G - Hit another new high today following a big gain in the prior session with twice average volume. Its 50 DMA line ($30.02) and prior lows in the $26.50 - $27.00 area define near-term support levels to watch. Raised fundamental concerns with sub par Mar '17 earnings that were repeatedly noted. See the latest FSU analysis for more details and an annotated graph.
>>> FEATURED STOCK ARTICLE : New Highs on Twice Average Volume; Fundamental Concerns Remain - 7/14/2017 |
View all notes |
Set NEW NOTE alert |
Company Profile |
SEC
News |
Chart |
Request a new note
C
A
S
I |
ESNT
-
NYSE
Essent Group Ltd
Finance-MrtgandRel Svc
|
$39.10
|
+0.13
0.33% |
$39.31
|
318,485
70.00% of 50 DAV
50 DAV is 455,000
|
$39.61
-1.29%
|
7/3/2017
|
$38.05
|
PP = $39.60
|
|
MB = $41.58
|
Most Recent Note - 7/20/2017 5:44:24 PM
Y - Quietly perched near its all-time high. Subsequent gains above the pivot point backed by at least +40% above average volume may trigger a new (or add-on) technical buy signal. Losses below the 50 DMA line ($37.02) and prior low ($34.08 on 5/05/17) would raise concerns and trigger technical sell signals.
>>> FEATURED STOCK ARTICLE : Sputtering Below its 50-Day Moving Average - 6/20/2017 |
View all notes |
Set NEW NOTE alert |
Company Profile |
SEC
News |
Chart |
Request a new note
C
A
S
I |
Symbol/Exchange
Company Name
Industry Group |
PRICE |
CHANGE
(%Change) |
Day High |
Volume
(% DAV)
(% 50 day avg vol) |
52 Wk Hi
% From Hi |
Featured
Date |
Price
Featured |
Pivot Featured |
|
Max Buy |
MTSI
-
NASDAQ
Macom Tech Solution Hldg
Elec-Semiconductor Mfg
|
$62.73
|
+1.95
3.21% |
$63.46
|
1,085,401
129.68% of 50 DAV
50 DAV is 837,000
|
$62.75
-0.03%
|
5/16/2017
|
$52.52
|
PP = $53.89
|
|
MB = $56.58
|
Most Recent Note - 7/20/2017 5:32:52 PM
G - Considerable gain today with +30% above average volume conviction as it hit a new all-time high. Did not form a sound base. Found support near its 50 DMA line ($57.42) during its latest consolidation.
>>> FEATURED STOCK ARTICLE : Meeting Resistance Near Prior High - 6/27/2017 |
View all notes |
Set NEW NOTE alert |
Company Profile |
SEC
News |
Chart |
Request a new note
C
A
S
I |
VEEV
-
NYSE
Veeva Systems Inc Cl A
Computer Sftwr-Medical
|
$63.29
|
-0.45
-0.71% |
$63.98
|
920,489
51.08% of 50 DAV
50 DAV is 1,802,000
|
$68.07
-7.02%
|
3/16/2017
|
$49.00
|
PP = $48.05
|
|
MB = $50.45
|
Most Recent Note - 7/20/2017 5:47:12 PM
G - Quietly consolidating -7% off its 52-week high. Found support at its 50 DMA line ($61.81) in recent weeks. Below that important short-term average the recent low ($56.94 on 6/12/17) defines the next important support to watch.
>>> FEATURED STOCK ARTICLE : Rebounding Since Testing Support at 50-Day Moving Average Line - 6/23/2017 |
View all notes |
Set NEW NOTE alert |
Company Profile |
SEC
News |
Chart |
Request a new note
C
A
S
I |
ANET
-
NYSE
Arista Networks Inc
TELECOMMUNICATIONS - Communication Equipment
|
$156.80
|
-0.83
-0.53% |
$158.61
|
355,277
45.84% of 50 DAV
50 DAV is 775,000
|
$162.97
-3.79%
|
4/17/2017
|
$132.75
|
PP = $135.27
|
|
MB = $142.03
|
Most Recent Note - 7/18/2017 4:53:57 PM
G - Quietly holding its ground above its 50 DMA line ($150), extended from any sound base. Prior low ($143.00 on 6/12/17) defines the next important support level to watch. See the latest FSU analysis for more details and a new annotated graph.
>>> FEATURED STOCK ARTICLE : Networking Firm Consolidating Above 50-Day Moving Average Line - 7/18/2017 |
View all notes |
Set NEW NOTE alert |
Company Profile |
SEC
News |
Chart |
Request a new note
C
A
S
I |
GRUB
-
NYSE
Grubhub Inc
COMPUTER SOFTWARE and SERVICES - Technical and System Software
|
$45.79
|
+0.26
0.57% |
$46.12
|
984,408
51.84% of 50 DAV
50 DAV is 1,899,000
|
$47.84
-4.29%
|
6/21/2017
|
$47.33
|
PP = $46.94
|
|
MB = $49.29
|
Most Recent Note - 7/18/2017 4:09:32 PM
Y - Volume totals have been cooling and stubbornly held its ground since gapping up above its 50 DMA line ($44.22) on 7/12/17 helping its outlook improve. Endured distributional pressure recently after it briefly rose above the new pivot point cited based on its 5/08/17 high plus 10 cents. Members were previously reminded - "A confirming gain backed by at least +40% above average volume and strong close above the pivot point may clinch a technical buy signal."
>>> FEATURED STOCK ARTICLE : Found Prompt Support at 50-Day Moving Average - 6/30/2017 |
View all notes |
Set NEW NOTE alert |
Company Profile |
SEC
News |
Chart |
Request a new note
C
A
S
I |
IBP
-
NYSE
Installed Building Prod
DIVERSIFIED SERVICES - Business/Management Services
|
$51.95
|
-0.20
-0.38% |
$52.10
|
55,670
40.05% of 50 DAV
50 DAV is 139,000
|
$55.45
-6.31%
|
6/13/2017
|
$54.25
|
PP = $55.55
|
|
MB = $58.33
|
Most Recent Note - 7/17/2017 5:16:33 PM
Y - Volume totals have been light in recent weeks while finding support at its 50 DMA line ($51.19), consolidating within close striking distance of its 52-week high. Subsequent volume-driven gains above the pivot point may trigger a new technical buy signal. See the latest FSU analysis for more details and a new annotated graph.
>>> FEATURED STOCK ARTICLE : Volume Cooling While Staying Above 50-Day Moving Average Line - 7/17/2017 |
View all notes |
Set NEW NOTE alert |
Company Profile |
SEC
News |
Chart |
Request a new note
C
A
S
I |
Symbol/Exchange
Company Name
Industry Group |
PRICE |
CHANGE
(%Change) |
Day High |
Volume
(% DAV)
(% 50 day avg vol) |
52 Wk Hi
% From Hi |
Featured
Date |
Price
Featured |
Pivot Featured |
|
Max Buy |
NCOM
-
NASDAQ
National Commerce Corp
BANKING - Regional - Southeast Banks
|
$39.85
|
+0.30
0.76% |
$39.85
|
11,082
34.63% of 50 DAV
50 DAV is 32,000
|
$41.25
-3.39%
|
4/25/2017
|
$38.95
|
PP = $40.09
|
|
MB = $42.09
|
Most Recent Note - 7/20/2017 5:40:51 PM
Y - Managed a "positive reversal" today and closed at the session high after testing support at its 50 DMA line ($38.85). Any damaging losses violating its 50 DMA line and recent lows would trigger technical sell signals.
>>> FEATURED STOCK ARTICLE : Recent Breakout Lacked Great Volume Conviction - 7/10/2017 |
View all notes |
Set NEW NOTE alert |
Company Profile |
SEC
News |
Chart |
Request a new note
C
A
S
I |
INGN
-
NASDAQ
Inogen Inc
HEALTH SERVICES - Medical Instruments and Supplies
|
$96.75
|
+0.57
0.59% |
$97.26
|
120,312
62.66% of 50 DAV
50 DAV is 192,000
|
$97.71
-0.98%
|
4/17/2017
|
$76.77
|
PP = $80.04
|
|
MB = $84.04
|
Most Recent Note - 7/18/2017 4:13:01 PM
Y - Color code was changed to yellow with new pivot point cited based on its 6/22/17 high as it formed an advanced "3-weeks tight" base. Subsequent volume-driven gains for new highs may trigger a new (or add-on) technical buy signal. Near-term support is its 50 DMA line ($90.38).
>>> FEATURED STOCK ARTICLE : In Tight Range Near All-Time High With Volume Totals Cooling - 7/12/2017 |
View all notes |
Set NEW NOTE alert |
Company Profile |
SEC
News |
Chart |
Request a new note
C
A
S
I |
HQY
-
NASDAQ
Healthequity Inc
COMPUTER SOFTWARE and SERVICES - Healthcare Information Service
|
$47.64
|
-0.66
-1.37% |
$48.66
|
832,980
162.37% of 50 DAV
50 DAV is 513,000
|
$54.95
-13.30%
|
6/7/2017
|
$50.01
|
PP = $49.35
|
|
MB = $51.82
|
Most Recent Note - 7/19/2017 6:27:11 PM
G - Color code is changed to green after a loss today with higher volume undercut prior lows and violated its 50 DMA line ($48.82) triggering technical sell signals. Only a prompt rebound above the 50 DMA line would help its outlook improve. See the latest FSU analysis for more details and a new annotated graph.
>>> FEATURED STOCK ARTICLE : 50-Day Moving Average Violation Triggers Technical Sell Signal - 7/19/2017 |
View all notes |
Set NEW NOTE alert |
Company Profile |
SEC
News |
Chart |
Request a new note
C
A
S
I |
PLAY
-
NASDAQ
Dave & Buster's Ent Inc
Retail-Restaurants
|
$67.63
|
+0.92
1.38% |
$67.88
|
282,081
41.48% of 50 DAV
50 DAV is 680,000
|
$73.48
-7.96%
|
2/23/2017
|
$55.41
|
PP = $58.35
|
|
MB = $61.27
|
Most Recent Note - 7/20/2017 5:45:27 PM
G - Quietly rebounded above its 50 DMA line ($67.09) today helping its outlook to improve. Damaging losses below the recent low ($64.26 on 7/07/17) would raise greater concerns and trigger a worrisome technical sell signal.
>>> FEATURED STOCK ARTICLE : Perched Near Record High After Solid April '17 Quarterly Results - 6/12/2017 |
View all notes |
Set NEW NOTE alert |
Company Profile |
SEC
News |
Chart |
Request a new note
C
A
S
I |
OLLI
-
NASDAQ
Ollie's Bargain Outlet
Retail-DiscountandVariety
|
$43.60
|
+0.55
1.28% |
$44.15
|
341,373
45.16% of 50 DAV
50 DAV is 756,000
|
$44.68
-2.41%
|
7/17/2017
|
$43.96
|
PP = $44.18
|
|
MB = $46.39
|
Most Recent Note - 7/19/2017 6:29:09 PM
Y - Pulled back today after recent gains lacking volume conviction. A new pivot point was cited based on its 6/02/17 high plus 10 cents. Subsequent gains and a strong close above the pivot point backed by at least +40% above average volume may trigger a new (or add-on) technical buy signal. Its 50 DMA line ($41.42) defines support above recent lows in the $37-38 area.
>>> FEATURED STOCK ARTICLE : Recently Found Support Near 50-Day Moving Average - 6/29/2017 |
View all notes |
Set NEW NOTE alert |
Company Profile |
SEC
News |
Chart |
Request a new note
C
A
S
I |
Symbol/Exchange
Company Name
Industry Group |
PRICE |
CHANGE
(%Change) |
Day High |
Volume
(% DAV)
(% 50 day avg vol) |
52 Wk Hi
% From Hi |
Featured
Date |
Price
Featured |
Pivot Featured |
|
Max Buy |
LITE
-
NASDAQ
Lumentum Holdings Inc
TELECOMMUNICATIONS - Cables / Satalite Equipment
|
$60.45
|
-1.10
-1.79% |
$62.35
|
1,733,521
107.34% of 50 DAV
50 DAV is 1,615,000
|
$67.30
-10.18%
|
7/13/2017
|
$64.15
|
PP = $67.40
|
|
MB = $70.77
|
Most Recent Note - 7/20/2017 5:27:45 PM
Y - Ended near the session low today with a loss on near average volume. Near-term support is at its 50 DMA line ($59.35) and its prior low ($56.20 on 6/29/17), where damaging violations may trigger technical sell signals. Subsequent volume-driven gains for new highs may trigger a new (or add-on) technical buy signal.
>>> FEATURED STOCK ARTICLE : High Ranked Telecom - Fiber Optics Firm - 7/13/2017 |
View all notes |
Set NEW NOTE alert |
Company Profile |
SEC
News |
Chart |
Request a new note
C
A
S
I |
MOMO
-
NASDAQ
Momo Inc Ads Cl A
INTERNET - Content
|
$42.33
|
+0.33
0.79% |
$42.98
|
3,807,361
53.58% of 50 DAV
50 DAV is 7,106,000
|
$45.95
-7.88%
|
3/7/2017
|
$29.71
|
PP = $27.83
|
|
MB = $29.22
|
Most Recent Note - 7/17/2017 5:19:52 PM
G - Consolidating above its 50 DMA line ($39.15), building on a new base. Prior low ($35.02 on 6/15/17) defines the next important chart support level where a violation would raise more serious concerns.
>>> FEATURED STOCK ARTICLE : Sputtering Below 50-Day Moving Average Line - 6/14/2017 |
View all notes |
Set NEW NOTE alert |
Company Profile |
SEC
News |
Chart |
Request a new note
C
A
S
I |
HLI
-
NYSE
Houlihan Lokey Inc Cl A
Finance-Invest Bnk/Bkrs
|
$36.95
|
-0.03
-0.08% |
$37.22
|
138,896
78.03% of 50 DAV
50 DAV is 178,000
|
$37.25
-0.81%
|
5/10/2017
|
$35.85
|
PP = $35.05
|
|
MB = $36.80
|
Most Recent Note - 7/18/2017 4:11:18 PM
Y - Perched near its "max buy" level, stubbornly holding its ground. Its 50 DMA line ($34.73) defines important near-term support to watch.
>>> FEATURED STOCK ARTICLE : Gapped Up and Nearly Challenged Prior High - 6/19/2017 |
View all notes |
Set NEW NOTE alert |
Company Profile |
SEC
News |
Chart |
Request a new note
C
A
S
I |